

Abstract
ATP-sensitive K+ (KATP) channels link metabolic state to cell excitability. Here, we examined regulation of KATP channels in substantia nigra dopamine neurons by hydrogen peroxide (H2O2), which is produced in all cells during aerobic metabolism. Blockade of KATP channels by glibenclamide (100 nm) or depletion of intracellular H2O2 by including catalase, a peroxidase enzyme, in the patch pipette increased the spontaneous firing rate of all dopamine neurons tested in guinea pig midbrain slices. Using fluorescence imaging with dichlorofluorescein to visualize intracellular H2O2, we found that moderate increases in H2O2 during partial inhibition of glutathione (GSH) peroxidase by mercaptosuccinate (0.1-0.3 mm) had no effect on dopamine neuron firing rate. However, with greater GSH inhibition (1 mm mercaptosuccinate) or application of exogenous H2O2, 50% of recorded cells showed KATP channel-dependent hyperpolarization. Responsive cells also hyperpolarized with diazoxide, a selective opener for KATP channels containing sulfonylurea receptor SUR1 subunits, but not with cromakalim, a selective opener for SUR2-based channels, indicating that SUR1-based KATP channels conveyed enhanced sensitivity to elevated H2O2. In contrast, when endogenous H2O2 levels were increased after inhibition of catalase, the predominant peroxidase in the substantia nigra, with 3-amino-1,2,4-triazole (1 mm), all dopamine neurons responded with glibenclamide-reversible hyperpolarization. Fluorescence imaging of H2O2 indicated that catalase inhibition rapidly amplified intracellular H2O2, whereas inhibition of GSH peroxidase, a predominantly glial enzyme, caused a slower, smaller increase, especially in nonresponsive cells. Thus, endogenous H2O2 modulates neuronal activity via KATP channel opening, thereby enhancing the reciprocal relationship between metabolism and excitability.
- basal ganglia
- DCF fluorescence imaging
- dopamine
- KATP channels
- Parkinson's disease
- peroxide
- potassium (K + ) channels
- substantia nigra
Introduction
ATP-sensitive K+ (KATP) channels are multimeric proteins composed of inwardly rectifying pore-forming subunits (typically Kir6.2 in neurons) and regulatory, sulfonylurea receptor subunits (SUR1/SUR2) (Inagaki et al., 1996; Ashcroft and Gribble, 1998; Babenko et al., 1998). KATP channel opening causes membrane hyperpolarization, which lowers cell activity and energy consumption, thereby linking metabolic state to excitability (Noma, 1983; Ashcroft and Ashcroft, 1990). The highest levels of KATP channels in the CNS are found in the substantia nigra (SN) and striatum (Mourre et al., 1989; Xia and Haddad, 1991; Zini et al., 1993), which are key structures of the basal ganglia required for movement (Dahlstrom and Fuxe, 1964; Albin et al., 1989; Olanow and Tatton, 1999; Prensa and Parent, 2001).
The prominent expression of KATP channels in dopamine (DA) cells of the SN pars compacta (SNc) suggests a potential role in governing nigrostriatal excitability, yet the function and regulation of these channels are poorly understood. Although KATP channel opening in DA neurons of the SNc can accompany hypoxia (Jiang et al., 1994; Mercuri et al., 1994; Guatteo et al., 1998) or metabolic suppression (Jiang et al., 1994; Liss et al., 1999), interpretation of reported data has been hindered by variable cell responses. Multiple populations of DA cells (Murphy and Greenfield, 1992; Liss et al., 1999) and/or novel KATP channel subtypes (Jiang et al., 1994) have been proposed to reconcile conflicting findings.
The primary factor thought to govern KATP channel opening is ATP/ADP ratio (Noma, 1983; Cook and Hales, 1984; Ashcroft and Ashcroft, 1990; Ashcroft and Gribble, 1998). Glucose, by regulating ATP levels, is an indirect modulator of these channels; glucose-dependent KATP channel regulation underlies insulin secretion in pancreatic β-cells (Cook and Hales, 1984; Ashcroft and Ashcroft, 1990) and GABA release in the SN (Amoroso et al., 1990). More recently, hydrogen peroxide (H2O2) has been shown to regulate KATP channel activity (Ichinari et al., 1996; Tokube et al., 1998; Krippeit-Drews et al., 1999; Avshalumov and Rice, 2003; Avshalumov et al., 2003). In β-cells, exogenous H2O2 causes sulfonylurea-sensitive hyperpolarization and suppression of insulin release (Krippeit-Drews et al., 1999). Moreover, endogenous H2O2 generated downstream from AMPA receptor activation in the striatum suppresses axonal DA release via SUR1-based KATP channels (Avshalumov and Rice, 2003; Avshalumov et al., 2003); endogenous H2O2 also suppresses somatodendritic DA release in the SNc (Chen et al., 2002), although a role for KATP channels has not been examined.
Regulation of KATP channels in DA neurons by H2O2 would provide a mechanism to reconcile previous conflicting results in the literature: H2O2 is generated in all cells by mitochondrial respiration (Boveris and Chance, 1973; Dugan et al., 1995; Liu et al., 2002) and is therefore well suited to serve as a signaling agent (besides ATP) to link excitability to energy demands. Here, we used whole-cell recording coupled with fluorescence imaging to examine the physiological role of H2O2 and KATP channels in SNc DA neurons. The data indicate that endogenous H2O2 acts in a graded manner to regulate tonic DA cell activity and responsiveness to oxidative challenge via KATP channels.
Materials and Methods
Brain slice preparation. Animal-handling procedures were in accordance with National Institutes of Health guidelines and were approved by the New York University School of Medicine Animal Care and Use Committee. The procedure for preparing midbrain slices for whole-cell recording was similar to that described by Koós and Tepper (1999). Young adult guinea pigs (male; Hartley; 150-250 g) were deeply anesthetized with 40 mg/kg pentobarbital (intraperitoneally) and perfused transcardially with ∼30 ml of nearly frozen (∼0°C) modified artificial CSF (ACSF) at a rate of ∼10 ml/min. This solution contained the following (in mm): 225 sucrose, 2.5 KCl, 0.5 CaCl2, 7 MgCl2, 28 NaHCO3, 1.25 NaH2PO4, 7 glucose, 1 ascorbate, and 3 pyruvate. After perfusion, the brain was removed into ice-cold modified ACSF for 1-2 min. Midbrain containing the SNc was blocked and fixed to the stage of a vibratome (Ted Pella, St. Louis, MO) for slicing. Slices (300 μm) were maintained initially at 34°C for 30 min in medium (in mm: 125 NaCl, 2.5 KCl, 2 CaCl2, 1 MgCl2, 25 NaHCO3, 1.25 NaH2PO4, 25 glucose, 1 ascorbate, and 3 pyruvate, pH 7.3-7.4, equilibrated with 95% O2/5% CO2) and then allowed to cool to room temperature for at least 30 min. For experiments, slices were transferred to a submersion chamber at 32°C and superfused at 1.2 ml/min with recording ACSF containing the following (in mm): 124 NaCl, 3.7 KCl, 26 NaHCO3, 2.4 CaCl2, 1.3 MgSO4, 1.3 KH2PO4, and 10 glucose, equilibrated with 95% O2/5% CO2 (Avshalumov et al., 2003).
Visualized whole-cell recording. Neurons of the SNc were visualized under infrared-differential interference contrast microscopy using an Olympus BX51WI fixed-stage microscope (New York/New Jersey Scientific, Middlebush, NJ) with a 40× water immersion objective; in imaging studies, a Pro-Scan 11 z-axis controller (Prior Scientific, Rockland, MA) was used to sharpen focus. Whole-cell recordings were obtained with patch pipettes pulled from 1.5 mm outer diameter/0.86 mm inner diameter borosilicate glass (Sutter Instruments, Novato, CA) on a Flaming/Brown model P-97 patch pipette puller (Sutter Instruments). Pipettes had open-tip diameters of <2 μm and resistances of 5-7 MΩ. The intracellular filling solution contained the following (in mm): 120 K-gluconate, 20 KCl, 2 MgCl, 10 Na-HEPES, 10 EGTA, 3 Na2-ATP, and 0.2 GTP, pH adjusted to 7.2-7.3 with KOH, 280-290 mOsm (Koós and Tepper, 1999; Paladini et al., 1999). In some experiments, the internal solution also contained Lucifer yellow (0.1%), Alexa Red (0.1%) plus 2′,7′-dichlorodihydrofluorescein (H2DCF) diacetate (H2DCFDA) (7 μm), or catalase [500 international units (IU)/ml]. Amphotericin B (240-300 μg/ml of backfill solution) was used for perforated-patch recordings (Rae et al., 1991); the electrode tip was filled with normal intracellular solution lacking amphotericin B. After gigaseal formation, the patch was monitored until action potential amplitudes were stable (15-25 min); Alexa Red was included in the backfill solution to indicate that the perforation remained intact.
Cell input resistance was calculated from the current-voltage plot of a family of hyperpolarizing current pulses; measurements were taken 100 ms after pulse onset at the same membrane potential (-91 mV) for each neuron under control and experimental conditions. Whole-cell recording data were acquired using an Axopatch 200B amplifier and Digidata board 1322A controlled by Clampex 9.0 and analyzed using ClampFit (Axon Instruments, Union City, CA); liquid junction potential correction (9.4 mV) was calculated using Clampex.
H2O2 imaging. To image intracellular H2O2, the H2O2-selective fluorescent dye H2DCFDA (Molecular Probes, Eugene, OR) was loaded into a given cell via the patch pipette used for simultaneous physiological recording. This dye is cleaved by intracellular esterases to form H2DCF, which becomes fluorescent dichlorofluorescein (DCF) after oxidation by primary intracellular peroxides (Reynolds and Hastings, 1995; Sah and Schwartz-Bloom, 1999). Once a seal was obtained, cells were held for 15-20 min before images were taken to allow time for diffusion of the dye into the cell (confirmed by visualization of Alexa Red) and esterase cleavage to form DCF. Data were acquired with an illuminator, a monochrometer, and an IC-200 (see Figs. 2, 5) or a Cascade 512 (see Fig. 8) camera obtained from Photon Technology International (Lawrenceville, NJ) and analyzed using Image Master software (Photon Technology International). The excitation wavelength for DCF was 488 nm, with fluorescence emission at 535 nm. To minimize DCF photo-oxidation, illumination was limited to 30 ms at 500 ms intervals; images were acquired using eight-frame averaging. A background image was taken from each cell before DCF infiltration; this background was subtracted from each averaged image for a given cell in subsequent data analysis. Fluorescence intensity in background-subtracted frame averages was normalized and illustrated as [(intensity - basal)/(basal)] × 100%.

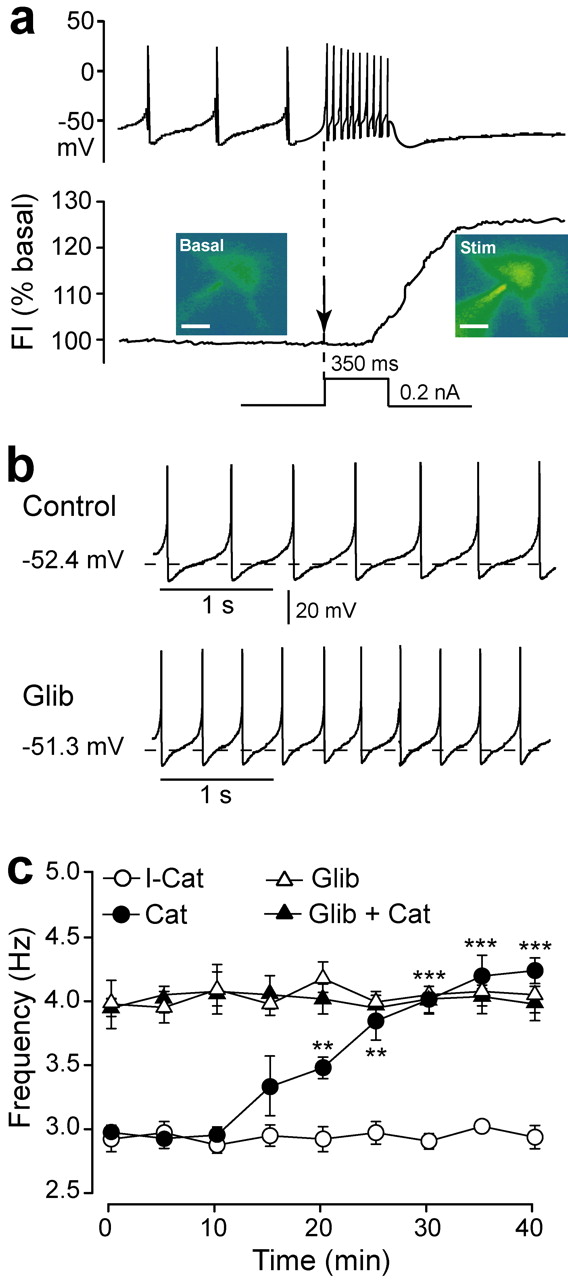
Regulation of spontaneous activity in DA cells by H2O2 and KATP channels. a, In all DA neurons tested (n = 17), depolarizing current injection (0.2 nA, 350 ms) induced an increase in the firing rate (top) that was accompanied by elevated H2O2 levels [DCF fluorescence intensity (FI); shown as pseudocolored images; p < 0.01 vs basal FI (bottom)]. The dashed vertical line and arrow indicate the onset of current injection. Stim, Stimulated. Scale bars, 20 μm. b, Pacemaker activity in a representative DA neuron under control conditions and after 15 min in glibenclamide (100 nm; Glib); KATP channel blockade by glibenclamide increased the firing rate (n = 5; p < 0.01). c, The firing rate also increased progressively when catalase (Cat; 500 IU/ml) was included in the patch pipette backfill solution [n = 7; **p < 0.01 and ***p < 0.001 vs respective control frequency after 10 min of recording (ANOVA)]; heat-inactivated catalase (I-Cat) did not alter spontaneous activity (n = 6). Glib (100 nm) applied 15 min before patching prevented the Cat-induced increase in the firing rate (n = 5). Data are means ± SEM.

Activity-dependent H2O2 generation in DA neurons. The average time course and amplitude of MCS-induced increases in intracellular H2O2 in responders (Resp; n = 7) and nonresponders (Nonresp; n = 7) is shown. FI, DCF fluorescence intensity. Intracellular levels of H2O2 did not change when MCS was applied in the presence of TTX (1 μm; n = 3), indicating that MCS-induced increases in H2O2 require action potentials. Data are means ± SEM. **p < 0.01 and ***p < 0.001 versus basal fluorescence; neither time course nor amplitude differed significantly between responders and nonresponders.

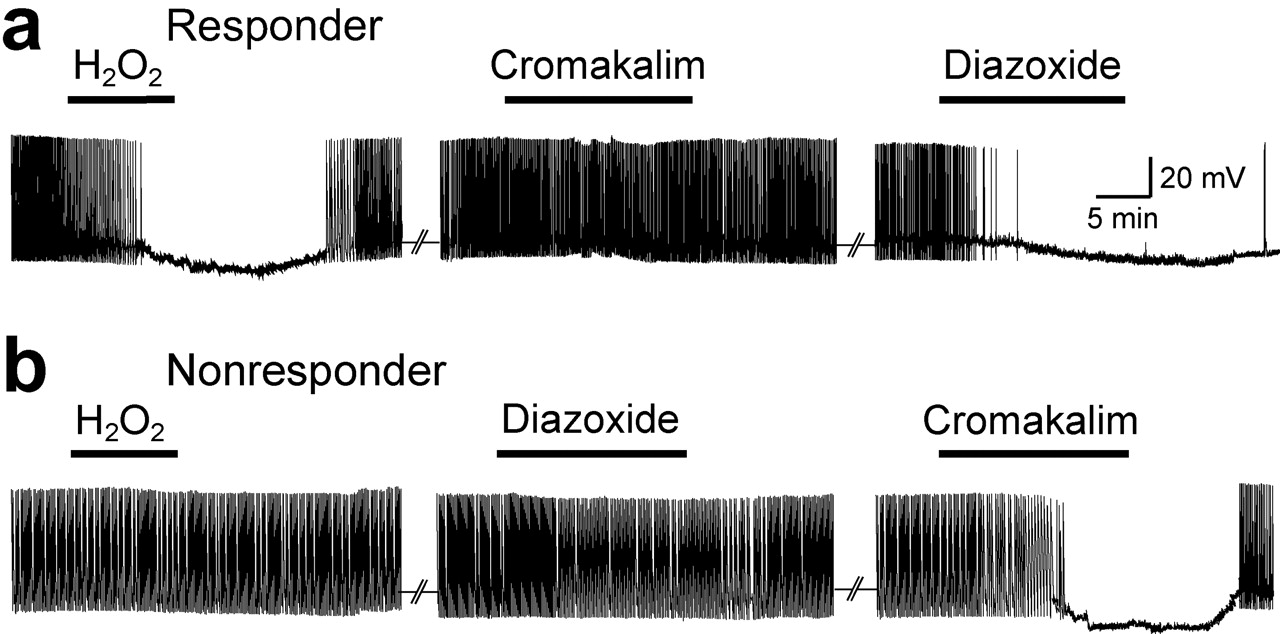
Effect of SUR1- and SUR2-selective KATP channel openers on H2O2 responders and nonresponders. a, Representative continuous current-clamp recording in a responder: H2O2 (1.5 mm) caused membrane hyperpolarization and inhibition of spontaneous firing activity in this DA neuron; cromakalim (60 μm; 20 min) had no effect, whereas subsequently applied diazoxide (60 μm; 20 min) caused hyperpolarization and loss of spontaneous activity. b, Representative current-clamp recording in a nonresponder: H2O2 (1.5 mm) applied for 10 min did not alter membrane properties; diazoxide had no effect, whereas subsequently applied cromakalim caused membrane hyperpolarization and loss of spontaneous activity.
Immunocytochemistry. To confirm DA cell identity, cells were double labeled with Lucifer yellow and a fluorescence-labeled antibody to tyrosine hydroxylase (TH). Presumed DA cells were filled with Lucifer yellow during recording. Slices were then fixed for 1 h in 4% paraformaldehyde in phosphate buffer (50 mm NaH2PO4 and 100 mm NaCl, pH 7.4), washed, and processed for TH immunoreactivity at room temperature (Rice et al., 1997; Witkovsky et al., 2000). The primary antibody was a monoclonal mouse anti-TH (Chemicon, Temecula, CA), and the secondary antibody was Texas Red-conjugated rabbit anti-mouse fluorescein isothiocyanate (Jackson ImmunoResearch, West Grove, PA). Fixed and stained whole slices were mounted in Vectashield medium (Vector Laboratories, Burlingame, CA) and viewed using a D-Eclipse confocal microscope (Nikon, Melville, NY).
Chemicals and statistical analysis. Glibenclamide, tolbutamide, H2O2, mercaptosuccinate (MCS), 3-amino-1,2,4-triazole (ATZ), tetrodotoxin (TTX), Lucifer yellow, amphotericin B, and components of all intracellular and extracellular media were obtained from Sigma (St. Louis, MO); Alexa Red and H2DCFDA were obtained from Molecular Probes; and catalase (bovine liver) was obtained from Calbiochem (San Diego, CA). Stock solutions of glibenclamide, amphotericin B, and H2DCFDA were made in dimethylsulfoxide (DMSO) (final DMSO concentration in ACSF or backfill solution was 0.01%). Control data for these agents were obtained with 0.01% DMSO, which had no effect on the physiological properties of DA cells. Data are given as means ± SEM (n = number of cells). Significance of differences (p < 0.05) was assessed using unpaired Student's t test or one-way ANOVA.
Results
Identification of DA neurons
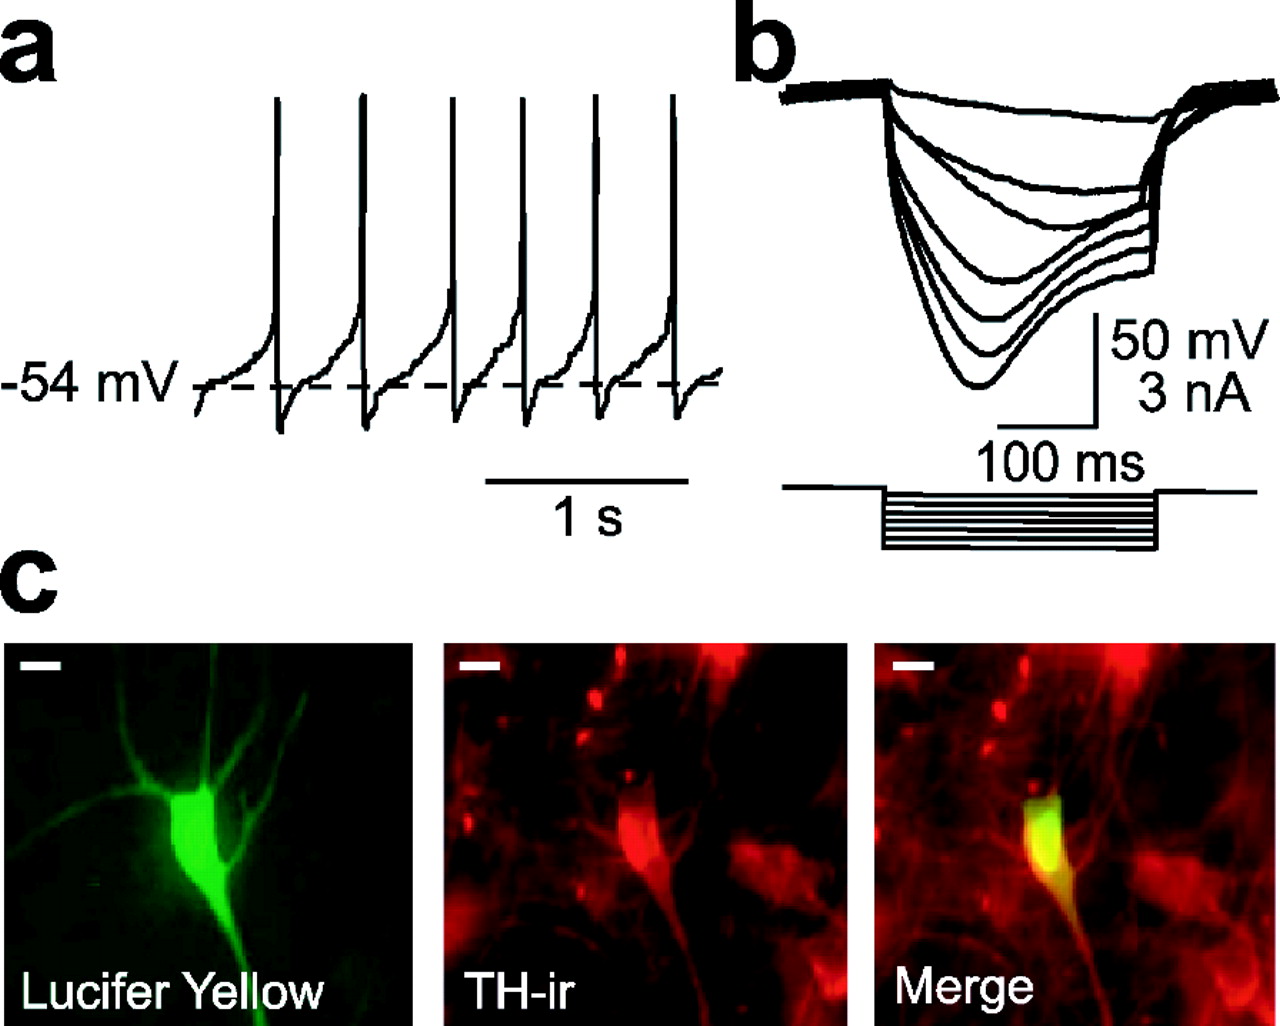
DA neurons in slices of guinea pig SNc exhibited characteristic pacemaker activity, with an average firing frequency of 3.0 ± 0.3 Hz (n = 83) (Fig. 1a), a relatively long action potential duration (2.6 ± 0.2 ms; n = 83), and a mean input resistance of 192 ± 16 MΩ (n = 83). Additionally, during hyperpolarizing current injection, all recorded neurons showed a prominent sag in membrane potential (Fig. 1b). These properties are similar to those reported previously for DA neurons in vitro (Grace and Onn, 1989; Yung et al., 1991; Jiang et al., 1994; Paladini et al., 1999). Cells exhibiting DA cell-like electrophysiological characteristics were also positive for TH immunoreactivity (Fig. 1c), confirming that these were DA neurons (Grace and Onn, 1989; Yung et al., 1991).

Identification of DA neurons. a, Representative current-clamp record from a neuron in the SNc showing spontaneous “pacemaker” firing activity. b, Voltage responses to hyperpolarizing current injection in this cell; note the prominent time-dependent rectification (sag). c, This cell was filled with Lucifer yellow during recording (left), and then the slice was processed for TH immunochemistry (TH-ir; middle). Double labeling (right) confirmed that the recorded cell was a DA neuron. Scale bars, 20 μm.
KATP channels and H2O2 regulate spontaneous firing rate
To examine basal and activity-dependent H2O2 generation in DA neurons, we monitored intracellular H2O2 using DCF. Basal DCF fluorescence was detected in all DA neurons (Fig. 2a, bottom), indicating tonic H2O2 generation during normal pacemaker activity. To confirm activity-dependent H2O2 generation in DA neurons, we increased the cell firing rate by injecting depolarizing current (0.2 nA, 350 ms). This caused an increase in mean spike frequency to 32 ± 6Hz (n = 17) (Fig. 2a, top). After a few spikes, DCF fluorescence began to rise, reaching a maximum change of 27 ± 2% (n = 17; p < 0.01 vs basal fluorescence) shortly after the pulse ended (Fig. 2a, bottom).
We then examined whether H2O2-sensitive KATP channels contributed to resting membrane properties under basal conditions. With conventional whole-cell recording, glibenclamide (3 μm), a KATP channel blocker, caused a significant, 60% increase in mean firing frequency (from 3.0 ± 0.3 to 4.8 ± 0.2 Hz; n = 19; p < 0.001) in all cells tested, accompanied by a small but significant membrane depolarization (+2.5 mV; n = 19; p < 0.01) but no change in input resistance (control, 194 ± 18 MΩ; glibenclamide, 243 ± 28 MΩ; n = 19; p > 0.05). Similar results were obtained with amphotericin B perforated-patch-clamp recording, which prevents dialysis of intracellular fluid (Rae et al., 1991). The basal firing rate was slightly lower with perforated-patch versus conventional whole-cell recording; nonetheless, glibenclamide again caused a 61% increase in the firing rate (from 2.3 ± 0.1 to 3.7 ± 0.2 Hz; n = 5; p < 0.01).
Although these data implicated KATP channels, previous studies in other cell types indicate that glibenclamide can also block other K+ channels, albeit at higher concentrations (10-87 μm) than those found to be effective here (Crepel et al., 1993; Schaffer et al., 1999). We therefore repeated examination of resting membrane properties with 100 nm glibenclamide, which is specific for KATP channels (Liss et al., 1999). With conventional whole-cell recording, 100 nm glibenclamide caused a significant 34% increase in mean firing frequency in all cells tested (from 2.9 ± 0.1 to 3.9 ± 0.1 Hz; n = 5; p < 0.01) (Fig. 2b,c), with no change in membrane potential or input resistance. A comparable 38% increase (from 2.4 ± 0.2 to 3.3 ± 0.3 Hz; n = 5; p < 0.01) was seen with 100 nm glibenclamide in perforated-patch-clamp recording. Together, these data confirm a role for KATP channels in the tonic regulation of DA neuron activity.
Inclusion of the H2O2 metabolizing enzyme catalase (500 IU/ml) in the patch pipette backfill solution caused a similar 38% increase in DA cell firing rate (Fig. 2c): pacemaker activity increased progressively from 2.9 ± 0.2 to 4.1 ± 0.1 Hz (n = 7; p < 0.001) after 40 min of recording and catalase infiltration into the cells. In contrast, DA neurons recorded with heat-inactivated catalase (Avshalumov et al., 2003) in the pipette showed no change in the firing rate during a similar recording period (n = 6) (Fig. 2c). Moreover, catalase had no effect on the spontaneous firing rate when KATP channels were blocked by glibenclamide (n = 5) (Fig. 2c), confirming that the effect of catalase was mediated by H2O2-sensitive KATP channels.
Effect of elevated endogenous H2O2 on DA neurons
Elevation of intracellular H2O2 during inhibition of glutathione peroxidase
To examine whether elevated levels of endogenous H2O2 might also affect DA cell physiology, we used MCS (Dringen et al., 1998) to inhibit glutathione (GSH) peroxidase, which should increase intracellular levels of H2O2 by decreasing H2O2 metabolism (Chen et al., 2002; Avshalumov et al., 2003). Changes in DCF fluorescence were used to indicate increases in H2O2 in response to a range of MCS concentrations applied to a given cell (n = 7). A linear increase in DCF fluorescence was seen over an MCS concentration range of 0.1-1 mm (R2 = 0.946), with a significant increase for each MCS concentration step (p < 0.001) (Fig. 3). Although 0.3 mm MCS caused a 25 ± 2% increase in DCF fluorescence intensity (p < 0.001 vs basal), this had no effect on the spontaneous neuron firing rate or membrane potential in any cell tested. Moreover, in three of seven cells, 1 mm MCS was also without effect on DA neuron physiology, despite a mean 65 ± 3% increase in fluorescence (p < 0.001 vs basal). However, at this MCS concentration, four of seven cells responded with marked hyperpolarization and cessation of firing. These data suggest a concentration threshold for the physiological effects of elevated H2O2 in responsive cells. Unfortunately, absolute H2O2 concentration cannot be determined from a given change in DCF fluorescence intensity, because there are no reliable methods for DCF calibration at the present time. Although we and others (Oyama et al., 1994) have attempted to calibrate DCF with exogenous H2O2, the nonlinear responses obtained suggests that the dye responds to the number of H2O2 molecules encountered, rather than concentration per se. Consequently, determination of the H2O2 concentration threshold must await development of a reliable calibration method for DCF or another H2O2-sensitive dye.

Concentration-dependent effect of GSH peroxidase inhibition by MCS on H2O2 amplification. Inhibition of GSH peroxidase by MCS (0.1-1 mm) caused a progressive increase in H2O2 levels [DCF fluorescence intensity (FI); R2 = 0.946]. All concentrations were tested in each cell (n = 7; ***p < 0.001 vs basal). Images are representative examples of DCF fluorescence for each concentration of MCS tested in one cell. Scale bars, 20 μm.
Physiological effects of elevated intracellular H2O2 in DA neurons
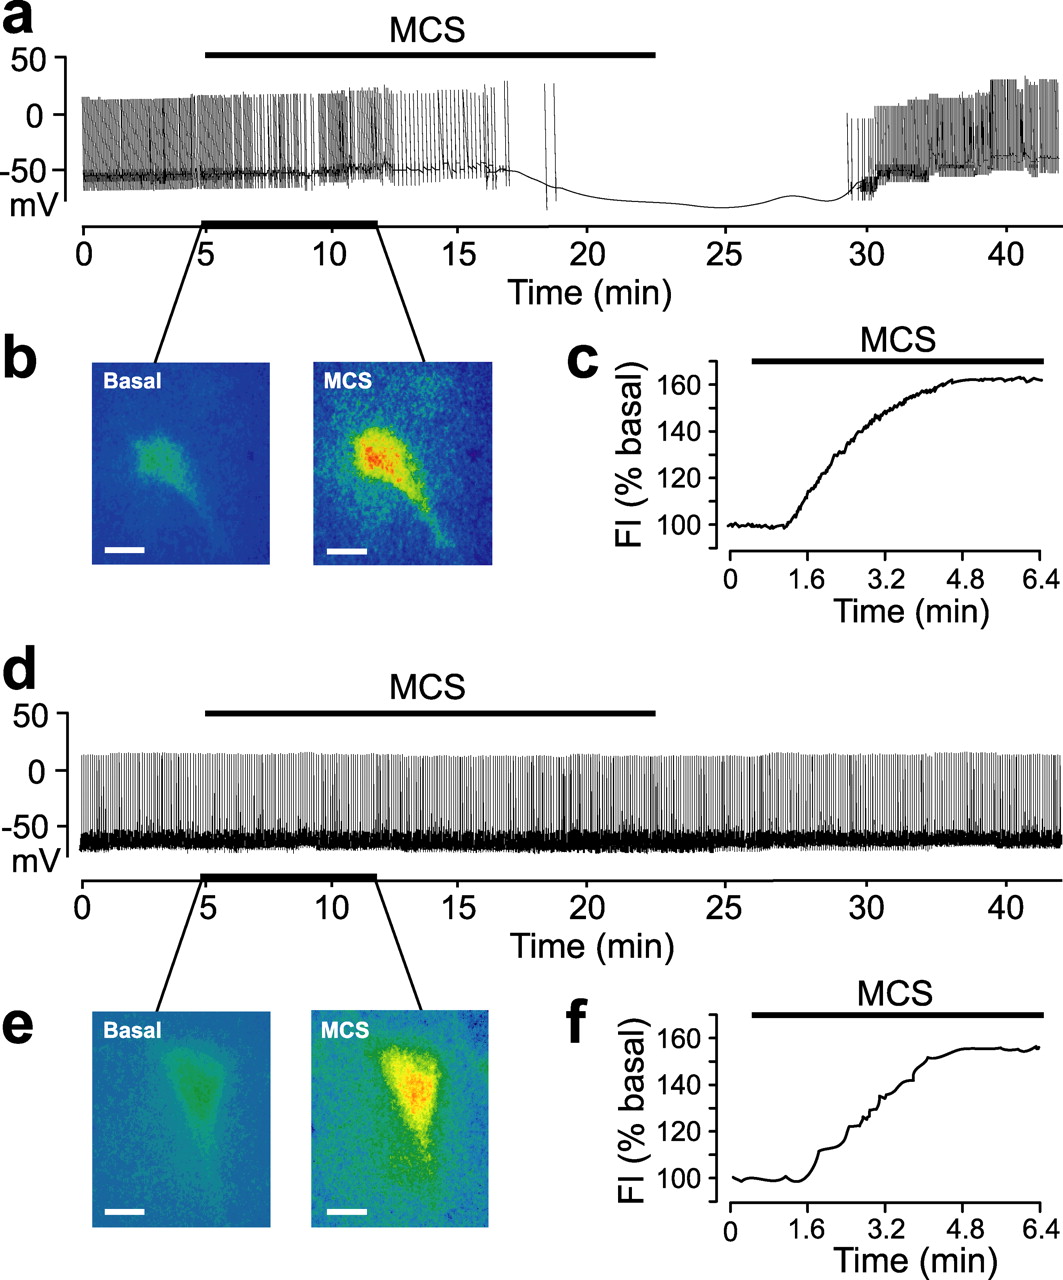
We then examined the effect of GSH peroxidase inhibition by 1 mm MCS on a larger population of DA neurons (n = 38) to explore the apparent diversity in DA neuron responsiveness to elevated H2O2. Again, 1 mm MCS induced profound membrane hyperpolarization (13 ± 3.4 mV; n = 20; p < 0.001 MCS vs control) and complete cessation of activity in one population of DA neurons, “responders” (53%; n = 20 of 38) (Fig. 4a). The increase in endogenous H2O2 also caused a decrease in input resistance of 43% (from 192 ± 16 to 113 ± 18 MΩ; n = 20; p < 0.001) accompanied by loss of the sag in membrane potential with hyperpolarizing current injection. These effects reversed after MCS washout (Fig. 4a). A second population of DA cells, “nonresponders” (47%; n = 18 of 38), did not respond to MCS application (Fig. 4d). Thus, two groups of DA cells could be distinguished by their sensitivity to endogenous H2O2.

Effects of GSH peroxidase inhibition on membrane properties and H2O2. a, Inhibition of GSH peroxidase by MCS (1 mm) caused hyperpolarization and cessation of spontaneous activity in one population of DA neurons (responders; n = 20 of 38). b, Simultaneously recorded DCF fluorescence in the responder in a before (Basal) and during MCS exposure. c, Time course of H2O2 elevation [fluorescence intensity (FI)] in this cell. d, MCS did not affect spontaneous activity in a second population of DA neurons (nonresponders; n = 18 of 38). e, Simultaneously recorded DCF fluorescence images before and during MCS in the nonresponder in d. f, Time course of H2O2 elevation in this cell. Scale bars, 20 μm.
In all recorded neurons, 1 mm MCS caused a consistent increase in intracellular H2O2, indicated by an ∼60% increase in DCF fluorescence (n = 14; p < 0.001 vs basal) (Figs. 4b,c,e,f, 5). A plateau in DCF fluorescence seen in all cells reflected the irreversible activation of DCF and precluded examination of the time course of H2O2 clearance after MCS washout. Neither time course nor amplitude of increases in DCF fluorescence differed significantly between responders (n = 7 of 14) and nonresponders (n = 7 of 14; p > 0.05; ANOVA) (Fig. 5); physiological data from these cells were included in the data averages above.
To determine whether the MCS-dependent increase in intracellular H2O2 depended on neuronal activity, we monitored DCF fluorescence when MCS was applied in the presence of TTX (1 μm). Application of TTX blocked Na+ channel-dependent action potentials but not an underlying pacemaker oscillation in membrane potential (n = 3; data not shown), as described previously (Kang and Kitai, 1993; Wilson and Callaway, 2000). In the presence of TTX, 1 mm MCS did not alter DCF fluorescence (n = 3) (Fig. 5); application of exogenous H2O2 (1.5 mm), however, caused a marked increase in DCF fluorescence in these cells, confirming successful dye loading (data not shown).
Effects of MCS-enhanced H2O2 are mediated by KATP channels
Voltage-clamp measurements indicated that MCS induced an outward current (107 ± 4 pA; n = 4), consistent with K+ channel opening, which ceased after MCS washout (Fig. 6a). The suppression of spontaneous activity in responders seen in current-clamp mode was reversed by glibenclamide (either 100 nm or 3 μm) during continued exposure to MCS (Fig. 6b), with restoration of membrane potential, input resistance, and sag (Fig. 6c) (n = 10). Glibenclamide at 100 nm was as effective as 3 μm in restoring membrane properties, although the recovery rate was slower than that seen with 3 μm. These data demonstrate that elevated levels of endogenous H2O2 can cause hyperpolarization in a large population of DA neurons via KATP channels.
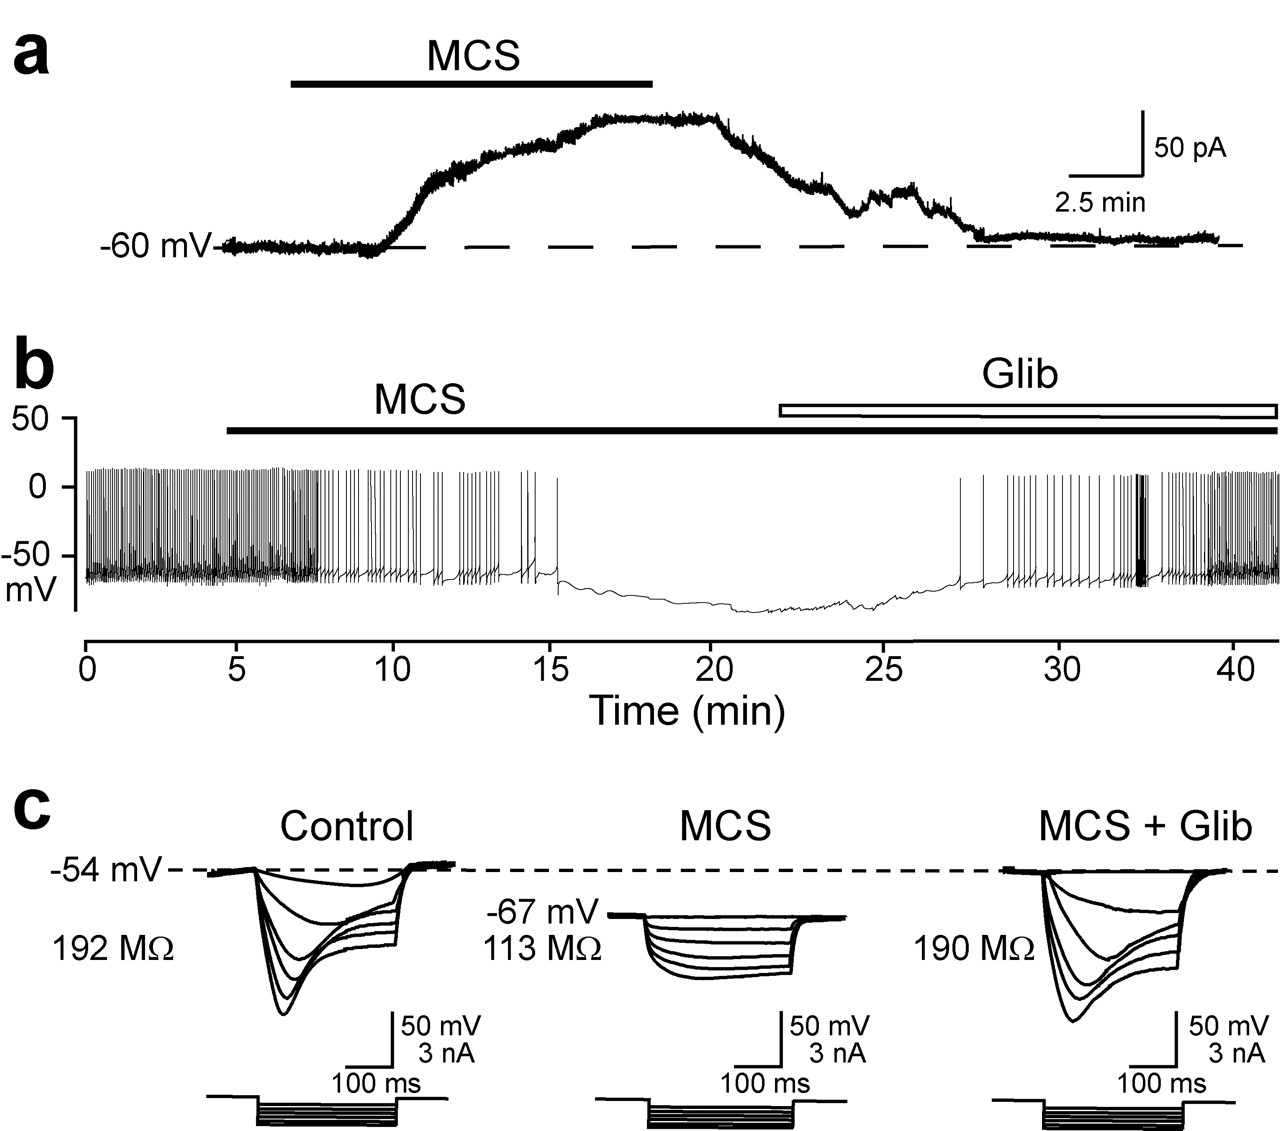
Endogenous H2O2 activates KATP channels. a, Representative voltage-clamp record from a DA neuron during MCS application showing activation of an outward current. b, Glibenclamide (Glib; 3 μm) reversed the MCS-induced membrane hyperpolarization and loss of spontaneous firing in the presence of MCS. c, Voltage responses to hyperpolarizing current recorded in this cell under control conditions, in MCS, and in MCS plus Glib.
Effect of exogenous H2O2 on DA neurons
To confirm the specific involvement of H2O2, we tested whether the effects of MCS could be mimicked by exogenously applied H2O2, using the minimum concentration of H2O2 (1.5 mm) found previously to inhibit DA release in striatal slices (Chen et al., 2001). We again found that one population of DA cells was physiologically responsive to H2O2 (10 min application), whereas a second population was not. In responders (53%; n = 15 of 28), current-clamp recording showed that exogenous H2O2 induced an average membrane hyperpolarization of 12 ± 2.7 mV (n = 15; p < 0.001 control vs H2O2), with a 39% decrease in membrane resistance (from 193 ± 20 to 118 ± 15 MΩ; n = 15; p < 0.001) accompanied by loss of sag. These changes were accompanied by suppression of spontaneous activity (Fig. 7a). All of these effects were reversible with H2O2 washout. In nonresponders (47%; n = 13 of 28), H2O2 had no effect on any physiological parameter examined (Fig. 7b). Thus, the relative proportions of responders and nonresponders to exogenously applied H2O2 were the same as with MCS. Moreover, in a separate study, we found that DA neurons that hyperpolarized with MCS also hyperpolarized with exogenous H2O2 (n = 3 of 5), whereas nonresponders did not respond to either MCS or H2O2 (n = 2 of 5). Either glibenclamide (3 μm; n = 7) or another sulfonylurea KATP channel blocker, tolbutamide (200 μm; n = 2), completely reversed the suppression of spontaneous activity in responders in the presence of exogenous H2O2 (Fig. 7c), confirming KATP channel involvement. Recovery of spontaneous activity and membrane resting potential was never seen during prolonged H2O2 application alone.

Effect of exogenous H2O2 on physiological properties of DA neurons. a, Exogenous H2O2 (1.5 mm) applied for 10 min caused a reversible membrane hyperpolarization and loss of spontaneous firing activity in one population of identified DA neurons (responders; n = 15 of 28) but not in a second population of DA cells (b; nonresponders; n = 13 of 28). c, Current-clamp recording from a responder during application of exogenous H2O2; glibenclamide (Glib; 3 μm) reversed the H2O2-induced membrane hyperpolarization and restored spontaneous activity in the continuous presence of H2O2 (n = 7).
Representative responders and nonresponders filled with Lucifer yellow were also TH positive, confirming that both populations were DA neurons. Both cell types were found throughout the SNc, with no obvious pattern of anatomical localization. The physiological characteristics of responders (n = 35) and nonresponders (n = 31) to either exogenous or endogenous (exposure to 1 mm MCS) H2O2 were also indistinguishable for all parameters tested (p > 0.05 for responders vs nonresponders). These parameters included spontaneous firing rate (responders, 3.0 ± 0.3 Hz; nonresponders, 3.0 ± 0.3 Hz), input resistance (responders, 194 ± 18 MΩ; nonresponders, 189 ± 17 MΩ), sag amplitude seen with -0.2 nA injection (responders: 27.3 ± 0.9 mV; range, 19.8-36.9 mV; nonresponders: 26.9 ± 0.8 mV; range, 20.4-37.9), and delay in rebound firing after hyperpolarizing current injection (responders: 478 ± 45 ms; range, 234-1299 ms; nonresponders: 525 ± 50 ms; range, 235-1156 ms).
Responsiveness to H2O2 depends on SUR subunit of KATP channels
Previous studies indicate that two major populations of DA neurons in the SNc can be distinguished by the sensitivity of KATP channel opening to metabolic stress, with greater sensitivity of SUR1-versus SUR2-expressing cells (Liss et al., 1999). We therefore examined the role of SUR1 and SUR2 KATP channel isoforms in conveying sensitivity to elevated H2O2. We addressed this pharmacologically using diazoxide (60 μm), a SUR1-selective opener, and cromakalim (60 μm), a SUR2-selective opener. Our experimental design took into account a previous observation that diazoxide can act at SUR2B-containing as well as SUR1-containing KATP channels in muscle cells (Isomoto et al., 1996). We ascertained whether a given cell was a responder or nonresponder during a 10 min exposure to exogenous H2O2, followed by H2O2 washout, then sequentially applied diazoxide and cromakalim to the same cell. For responders, cromakalim was applied first, followed by diazoxide, with the opposite protocol for nonresponders. Cromakalim had no effect on most responders (n = 5 of 6), indicating a lack of involvement of SUR2 subunits; in contrast, diazoxide caused hyperpolarization and cessation of spontaneous activity in all of these cells (n = 6 of 6) (Fig. 8a). Nonresponders showed the opposite response pattern, with no response to diazoxide (n = 5 of 6) but hyperpolarization with cromakalim (n = 6 of 6) (Fig. 8b). These data suggest that diazoxide at the concentration tested has no effect on SUR2B-containing KATP channels in DA neurons. Although one cell in each group showed membrane hyperpolarization in response to both diazoxide and cromakalim, this presumably reflected dual expression of both SUR isoforms (Liss et al., 1999). Membrane hyperpolarization induced by diazoxide or cromakalim was also accompanied by a decrease in input resistance and loss of sag.
One other caveat in the use of diazoxide is that it can cause an increase in reactive oxygen species (ROS) generation, detected by DCF fluorescence (Forbes et al., 2001). To address this concern, we examined the effect of 60 μm diazoxide on DCF fluorescence in DA neurons. We found that diazoxide caused an increase of 18 ± 1% (p < 0.05 vs basal), whether the cell hyperpolarized with diazoxide (n = 5 of 7) or not (n = 2 of 7). Our studies of graded H2O2 generation with GSH peroxidase inhibition, however, suggest that the H2O2 levels indicated by an 18% increase in DCF fluorescence (Fig. 3) would be insufficient to alter membrane properties of DA neurons. Thus, the hyperpolarization seen with diazoxide appears to be from its conventional action as aKATP channel opener.
Inhibition of catalase
In SNc, the activity of endogenous catalase is much higher than that of GSH peroxidase (Hung and Lee, 1998). We therefore examined the effect of catalase inhibition on DA cell physiology using ATZ (1 mm) (Desagher et al., 1996). Catalase inhibition by ATZ caused membrane hyperpolarization and loss of spontaneous activity in all neurons tested (n = 12) (Fig. 9a). The effect reversed after ATZ washout (Fig. 9a). Intracellular H2O2 increased sharply during ATZ application (Fig. 9b,c). In comparisons of the time course and amplitude of changes in DCF fluorescence with MCS versus ATZ, we found that the initial increase in DCF fluorescence with ATZ was significantly greater than with MCS, with a t50 (time of 50% maximal response) of 1.4 ± 0.1 min (n = 5) for ATZ versus 2.1 ± 0.2 min (n = 5; p < 0.01) for MCS responders (Fig. 9d,e) and 2.3 ± 0.2 min (n = 5; p < 0.01) for MCS nonresponders. Moreover, DCF fluorescence with ATZ was significantly greater at all time points than that seen in MCS nonresponders (Fig. 9d,e). The effects of ATZ could be reversed by glibenclamide, confirming KATP channel involvement (n = 4) (Fig. 9f), although 10 μm rather than 3 μm glibenclamide was required. These data suggest that above a certain level, H2O2 can lead to KATP channel activation in all DA neurons.

Effects of catalase inhibition on membrane properties and H2O2. a, Current-clamp record showing a reversible membrane hyperpolarization and loss of spontaneous firing in a DA neuron by catalase inhibition with ATZ (1 mm); all DA neurons responded to ATZ (n = 12). b, Simultaneously recorded DCF fluorescence in this cell before (Basal) and during ATZ exposure confirmed H2O2 elevation. Scale bar, 20 μm. c, Time course of H2O2 increase. FI, Fluorescence intensity. d, e, Average time course and amplitude of H2O2 increases induced by ATZ versus those in MCS responders (d; MCSResp) and MCS nonresponders (e; MCSNonresp). Data are means ± SEM. **p < 0.01 and ***p < 0.001 versus MCS. f, Glibenclamide (Glib; 10 μm) reversed ATZ-induced membrane hyperpolarization and loss of cell firing in the continued presence of ATZ (n = 4).
Discussion
Here, we introduce H2O2 as a key signaling element [or “cytosolic factor” (Ashcroft and Gribble, 1998)] that, along with ATP, links metabolism and cell activity via KATP channels. The data demonstrate tonic regulation of DA cell firing rate by H2O2-sensitive KATP channels, as well as additional patterns of KATP channel regulation when H2O2 rises above basal levels. Although the moderate H2O2 elevation that accompanied partial GSH peroxidase inhibition by 0.1-0.3 mm MCS did not alter the firing rate or membrane properties in any recorded cell, the higher elevation seen with GSH peroxidase inhibition by 1 mm MCS or application of exogenous H2O2 caused KATP channel-dependent hyperpolarization in ∼50% of DA neurons. With the more rapid H2O2 elevation caused by catalase inhibition, all DA neurons exhibited KATP channel-dependent hyperpolarization. Thus, H2O2 acts in a graded manner to regulate DA cell excitability.
Tonic regulation of DA neuron activity by H2O2-sensitive KATP channels
Most endogenously produced ROS, including H2O2, are derived from mitochondrial respiration (Dugan et al., 1995; Liu et al., 2002), with 1-2% of consumed oxygen converted to superoxide radical then to H2O2 (Boveris and Chance, 1973; Cohen, 1994). Notably, H2O2 is not a free radical (all of its electrons are paired) and does not readily cause oxidative damage (Cohen, 1994), making it an ideal ROS to act as a signaling agent.
In the present studies, basal H2O2 levels were detected in all recorded DA neurons during normal pacemaker activity. A resting KATP channel tone was also seen in all cells, indicated by a significant increase in the spontaneous firing rate in the presence of glibenclamide with both conventional whole-cell and perforated-patch recording. Moreover, a similar increase in the spontaneous firing frequency accompanied depletion of intracellular H2O2 when catalase was included in the whole-cell backfill solution. The catalase-induced increase in the firing rate was prevented by glibenclamide, confirming that tonically generated H2O2 regulates DA neuron excitability via KATP channels. KATP channel modulation by H2O2 may not be unique to DA neurons, because a resting KATP channel tone has also been demonstrated in striatal cholinergic interneurons using perforated-patch recording (Lee et al., 1998).
Importantly, the backfill solution in the present studies contained 3 mm ATP, at which concentration KATP channels should be closed (Häusser et al., 1991; Roeper and Ashcroft, 1995; Stanford and Lacey, 1995; Inagaki et al., 1996). Thus, it is unlikely that the resting KATP channel tone in DA neurons was caused by low ATP. Rather, our data suggest that the active regulator is H2O2. Indeed, previous studies using inside-out membrane patches from cardiac cells have shown a direct, concentration-dependent effect of H2O2 on KATP channel opening by decreasing channel sensitivity to ATP (Ichinari et al., 1996; Tokube et al., 1998). The mechanism underlying this effect is not known; however, it cannot involve complete oxidation of redox-sensitive sites in KATP channels, because strong oxidants cause KATP channel closure (Coetzee et al., 1995).
Functional consequences of endogenous H2O2 elevation
We also found that intracellular H2O2 levels increased during depolarization-induced increases in DA cell activity (Fig. 1a), which is the first demonstration of activity-dependent H2O2 generation in single cells in brain tissue. The dependence of H2O2 generation on cell activity was further demonstrated by the TTX sensitivity of the increase in DCF fluorescence seen during GSH peroxidase inhibition by MCS. The amplification of activity-dependent H2O2 levels by MCS provided a means to examine the effect of elevated H2O2 on DA cell physiology. A progressive increase in DCF fluorescence was seen with increasing GSH peroxidase inhibition. Moderate increases in H2O2 (e.g., those indicated by a 25% increase in fluorescence intensity) were not accompanied by changes in membrane properties. However, the increase in endogenous H2O2 seen with 1 mm MCS was sufficient to cause profound hyperpolarization and loss of spontaneous activity in 50% of DA neurons; a second population was not responsive, despite equivalent increases in intracellular H2O2. A similar distribution of responders and nonresponders was seen during application of exogenous H2O2. Exogenous H2O2 has been shown in previous studies to activate K+ channels in a variety of cell types, including hippocampal CA1 neurons, cardiac myocytes, and pancreatic β-cells (Seutin et al., 1995; Ichinari et al., 1996; Tokube et al., 1998; Krippeit-Drews et al., 1999). Here, reversal of H2O2-dependent hyperpolarization by glibenclamide confirmed the involvement of KATP channels in DA neurons.
In contrast to the differential responses seen with GSH peroxidase, all DA cells responded with hyperpolarization and loss of spontaneous activity when catalase was inhibited by ATZ. Moreover, DCF imaging demonstrated a faster rate of H2O2 amplification in DA neurons with ATZ versus MCS. The enhanced effects of ATZ are consistent with the dominant role of catalase in managing neuronal H2O2 in the SNc: not only is catalase activity 20-fold higher than GSH peroxidase activity (Hung and Lee, 1998), GSH peroxidase is primarily glial, with weak expression in DA neurons (Damier et al., 1993; Trépanier et al., 1996). Whether regulation of KATP channels by elevated H2O2 is direct or indirect in DA neurons remains to be elucidated. In isolated pancreatic β-cells, activation of KATP channels by exogenous H2O2 was accompanied by a fall in ATP, implying an indirect action of H2O2; however, the observed membrane hyperpolarization was irreversible (Krippeit-Drews et al., 1999). In contrast, the KATP channel-dependent hyperpolarization of DA neurons seen with all agents, including ATZ, reversed after washout, suggesting that mechanisms required to maintain cell viability, including ATP generation and ion homeostasis, were not irreversibly damaged.
Diversity of DA neuron responsiveness to H2O2
Diversity of DA cell characteristics is well known, although often disregarded. Dorsal- and ventral-tier DA cells in the SNc can be distinguished by differential expression of calbindin, with higher levels in dorsal-tier versus ventral-tier neurons, and by differences in their striatal projection targets (Gerfen et al., 1987; Hanley and Bolam, 1997; Prensa and Parent, 2001; Neuhoff et al., 2002). Additionally, subtle differences in physiological characteristics, including sag amplitude and delay in rebound firing activity, have been detected in DA cell populations identified by differential calbindin expression (Neuhoff et al., 2002). Additionally, Liss et al. (1999) identified two populations of DA cells in mouse SNc that were defined by differential sensitivity to mitochondrial inhibition, with a greater sensitivity of cells expressing SUR1-versus SUR2-based KATP channels.
In the present studies, we found no differences in the physiological characteristics of responders and nonresponders, indicating that these populations include both calbindin-positive and -negative cells. Rather, the populations defined by differential sensitivity to H2O2 seem to reflect the distribution of DA neurons expressing SUR1- and SUR2-based KATP channels (Liss et al. 1999). Indeed, our pharmacological studies with diazoxide and cromakalim suggest that the sensitivity of responders to amplified H2O2 is conveyed by SUR1-based KATP channels (Fig. 7). Although nonspecific effects of diazoxide have been reported, including ROS generation and mitochondrial dysfunction (Forbes et al., 2001), the H2O2 elevation seen in the present studies was below that required to activate KATP channels.
Hyperpolarization of all DA cells with ATZ suggests that the H2O2 levels achieved were sufficient to recruit SUR2-based as well as SUR1-based KATP channels, because SUR2-expressing as well as SUR1-expressing neurons must be affected. The higher concentration of glibenclamide (10 vs 3 μm) required to reverse ATZ-induced hyperpolarization would also be consistent with SUR2-based channel recruitment, because these are less sensitive to glibenclamide than are SUR1-based channels (Inagaki et al., 1996), with the caveat that 10 μm glibenclamide can have nonspecific effects on other K+ channels (Crepel et al., 1993).
Summary and conclusions
We show here that DA neuron excitability is regulated by H2O2 via KATP channels. Regulation of spontaneous activity in all DA neurons suggests that this tonic control is independent of SUR subunit composition, perhaps implicating a modulatory site on pore-forming subunits. In contrast, differential sensitivity of DA neurons to elevated H2O2 is defined by SUR subunit composition.
Given the dependence of both axon terminal and somatodendritic DA release on DA cell firing rate (Gonon and Buda, 1985; Rice et al., 1997), H2O2-dependent regulation of DA cell activity would influence DA release throughout the nigrostriatal pathway. Indeed, GSH peroxidase inhibition by MCS (1 mm) causes suppression of somatodendritic DA release in the SNc (Chen et al., 2002). These data have pathophysiological implications because GSH content and GSH peroxidase activity in the SNc fall in Parkinson's disease (Damier et al., 1993; Olanow and Tatton, 1999). The involvement of KATP channels in the regulation of DA release in vivo and the potential importance of this in movement control has been suggested by behavioral studies showing that unilateral nigral injection of tolbutamide induces rotation behavior in rats given systemic amphetamine (Levesque and Greenfield, 1991). Additionally, SUR1-containing KATP channels are required for inhibition of DA release by endogenous H2O2 in the striatum (Avshalumov and Rice, 2003). Although diazoxide and cromakalim each decrease evoked DA release in the striatum by ∼40%, only SUR1-selective diazoxide prevents additional suppression by endogenous H2O2. These data suggest that the 50:50 distribution of responders and nonresponders in the SNc is reflected in the pattern of functional KATP channel expression in striatal DA axons.
The present findings extend a growing body of evidence indicating that ROS, including H2O2, are important signaling molecules (Sundaresan et al., 1995; Nishida et al., 2000; Kamsler and Segal, 2004). Given that exogenous H2O2 can activate K+ channels in a variety of cell types and that SUR1-based KATP channels are widely expressed by neurons in the CNS (Scuvee-Moreau et al., 1997; Lee et al., 1998; Liss et al., 1999), it is unlikely that regulation of cell activity by H2O2 and KATP channels is unique to DA neurons in the SNc. Thus, demonstrated sensitivity of KATP channels to H2O2 in intact neurons reveals a mechanism that could modulate physiological functions from excitability and transmitter release to differential cell responses to ischemia or metabolic stress.
Footnotes
This work was supported by National Institutes of Health-National Institute of Neurological Disorders and Stroke Grants NS-36362 and NS-45325 and by the National Parkinson Foundation (M.E.R.). We are grateful to Dr. Paul Witkovsky for assistance with immunocytochemistry and to Abram Akopian for advice about whole-cell recording.
Correspondence should be addressed to Dr. Margaret E. Rice, Department of Physiology and Neuroscience, New York University School of Medicine, 550 First Avenue, New York, NY 10016. E-mail: margaret.rice{at}nyu.edu.
B. T. Chen's present address: Ernest Gallo Clinic and Research Center, Department of Neurology, University of California, San Francisco, 5858 Horton Street, Suite 200, Emeryville, CA 94608.
T. Koós' present address: Department of Neurobiology, Yale University School of Medicine, 333 Cedar Street, New Haven, CT 06520.
Copyright © 2005 Society for Neuroscience 0270-6474/05/254222-10$15.00/0


