

Abstract
Spastic (spa), spasmodic (spd), and oscillator (ot) mice have naturally occurring glycine receptor (GlyR) mutations, which manifest as motor deficits and an exaggerated “startle response.” Using whole-cell recording in hypoglossal motoneurons, we compared the physiological mechanisms by which each mutation alters GlyR function. Mean glycinergic miniature IPSC (mIPSC) amplitude and frequency were dramatically reduced (>50%) compared with controls for each mutant. mIPSC decay times were unchanged in spa/spa (4.5 ± 0.3 vs 4.7 ± 0.2 ms), reduced in spd/spd (2.7 ± 0.2 vs 4.7 ± 0.2 ms), and increased in ot/ot (12.3 ± 1.2 vs 4.8 ± 0.2 ms). Thus, in spastic, GlyRs are functionally normal but reduced in number, whereas in spasmodic, GlyR kinetics is faster. The oscillator mutation results in complete absence of α1-containing GlyRs; however, some non-α1-containing GlyRs persist at synapses. Fluctuation analysis of membrane current, induced by glycine application to outside-out patches, showed that mean single-channel conductance was increased in spa/spa (64.2 ± 4.9 vs 36.1 ± 1.4 pS), but unchanged in spd/spd (32.4 ± 2.1 vs 35.3 ± 2.1 pS). GlyR-mediated whole-cell currents in spa/spa exhibited increased picrotoxin sensitivity (27 vs 71% block for 100 μm), indicating α1 homomeric GlyR expression. The picrotoxin sensitivity of evoked glycinergic IPSCs and conductance of synaptic GlyRs, as determined by nonstationary variance analysis, were identical for spa/spa and controls. Together, these findings show the three mutations disrupt GlyR-mediated inhibition via different physiological mechanisms, and the spastic mutation results in “compensatory” α1 homomeric GlyRs at extrasynaptic loci.
Introduction
Glycine receptors (GlyRs) are ligand-gated ion channels (LGICs) mediating fast inhibitory synaptic transmission in brainstem and spinal cord circuits (Rajendra et al., 1997; Legendre, 2001; Lynch, 2004). They are heteromultimeric pentamers composed of α and β subunits arranged in a 2:3 stoichiometry (Grudzinska et al., 2005). Our understanding of GlyR biology and LGIC function has advanced considerably by studying naturally occurring GlyR mutations, which occur in humans, cattle, horses, dogs, and mice (Rajendra and Schofield, 1995).
Three murine mutants, spastic (spa), spasmodic (spd), and oscillator (ot), have distinct GlyR defects that produce almost identical motor phenotypes. All three mutations are recessive disorders and homozygous affected animals exhibit a heightened “startle response,” muscle rigidity, tremor, and impaired righting when disturbed (Chai, 1961; Lane et al., 1987; Buckwalter et al., 1994). In spastic mice (Chai, 1961), an intronic insertion of a LINE 1 transposable element in the GlyR β subunit gene (Kingsmore et al., 1994; Mülhardt et al., 1994) causes exon-skipping and decreased transcriptional efficiency of the β subunit. This reduces GlyR levels in the spinal cord and brainstem (White and Heller, 1982; Becker, 1990). In contrast, the spasmodic mouse (Lane et al., 1987) has a single point mutation (A52S) in the α1 subunit (Ryan et al., 1994; Saul et al., 1994). GlyR levels appear to be normal; however, agonist sensitivity is reduced (Ryan et al., 1994; Saul et al., 1994). In the lethal oscillator mutation, a microdeletion in exon 8 of the α1 subunit gene results in virtual absence of α1 protein and functional GlyRs in membranes from spinal cord and brainstem (Buckwalter et al., 1994; Kling et al., 1997).
The physiological properties of mutant GlyRs, especially homomeric α subunit-containing receptors, have been studied extensively in recombinant systems (Legendre, 2001; Lynch, 2004). Fewer studies have examined the consequences of GlyR mutations on the function of “native” receptors (α1/β heteromers), the dominant form at adult synaptic connections. In this regard, the spastic mutation is the best characterized mutant. Consistent with the reduction in GlyR levels in this mutant, the amplitude of glycinergic miniature IPSPs (Biscoe and Duchen, 1986) and miniature IPSCs (mIPSCs) (Callister et al. 1999; Graham et al., 2003; von Wegerer et al., 2003) are reduced in spinal cord and brainstem neurons. Similarly, inhibitory synaptic transmission is dramatically altered in oscillator dorsal horn neurons (Graham et al., 2003) and spasmodic brainstem neurons (Callister et al., 1999).
Here, we use hypoglossal motoneurons (MNs) to compare the effects of each mutation on glycinergic synaptic transmission at intact/functional synaptic connections. Our data show that glycinergic drive is dramatically reduced in all three mutants, but by distinct mechanisms. In spastic, the number of functional GlyRs is reduced at postsynaptic densities, but receptor kinetics is unchanged. Furthermore, α1 homomeric GlyRs are assembled in the spastic mutant and are restricted to extrasynaptic locations. The spasmodic mutation dramatically changes GlyR kinetics with faster mIPSC rise and decay times. In oscillator, few functional GlyRs are present in animals older than 16 d; however, some GlyRs with slower mIPSC decay times persist.
Materials and Methods
Animals.
Spastic, spasmodic, and oscillator mice were obtained from The Jackson Laboratory (Bar Harbor, ME). Experiments were performed on wild-type, spastic, spasmodic, or oscillator mice (both sexes) backcrossed onto the C57BL/6 genetic background. Ages for each genotype are provided in Results. Spastic and spasmodic animals were bred by mating homozygous affected (spa/spa or spd/spd) females with heterozygous unaffected (spa/+ or spd/+) males. Because homozygous oscillator mice die ∼21 d after birth (Buckwalter et al., 1994) (i.e., before they are sexually mature), ot animals were bred by mating heterozygous (ot/+) animals. All experimental procedures were approved by the University of Newcastle and Garvan Institute of Medical Research Animal Experimentation and Ethics Committees. Homozygous affected spa, spd, and ot animals were easily identified ∼2 weeks after birth according to four criteria: (1) constant resting tremor, (2) clenching of limbs when picked up by the tail, (3) an impaired righting reflex, and (4) a tendency to walk on tiptoe with an arched back (Simon, 1995).
Genotyping.
Genotypes were determined on 2–5 mm tail tip biopsies, obtained under methoxyflurane anesthesia, from all breeding stock and experimental animals. Tail tips were digested with proteinase K at 0.63 mg/ml in 10 mm Tris-HCl, pH 7.5, 400 mm NaCl, 100 mm EDTA, 0.6% SDS in a total volume of 640 μl overnight at 42°C. The digest was cleared by addition of 170 μl of saturated NaCl and centrifuged 10 min at 13,000 × g. DNA was precipitated from supernatants by the addition of 800 μl of ice-cold 100% ethanol and spun at 13,000 × g for 5 min. Pellets were washed with 800 μl of ice-cold 70% ethanol and resuspended overnight in 100 μl of H2O. Genotypes were determined by PCR using the following primers. Spastic: SpaWT forward, 5′-GCAACTTGAGAGC-TGTATGT-3′, and SpaWT reverse, 5′-ACTTGGCTGGGCTTACATAT-3′; wild-type allele, 348 bp; Spa forward, 5′-TTCCTAAGTTCCGGT-CTGTG-3′, and Spa reverse, 5′-CAATTATCAAGGCTGATGGC-3′; spa allele, 358 bp. Spasmodic: SpdWT forward, 5′-TCAGCCTCCTGTGAG-GTATA-3′, and SpdWT reverse, 5′-TCACCTATGGTTGTCTCAGC-3′; wild-type allele, 280 bp; Spd forward, 5′-AGTCTAGTCTGGCAGA-GATG-3′, and Spd reverse, 5′-TCACCTATGGTTGTCTCAGA-3′; spd allele, 235 bp. Oscillator: Ot WT forward, 5′-AGTGACAGGTAGAG-GGTAGT-3′, and Ot WT reverse, 5′-AGTTCCTTGTGTTGCCGAGA-3′; wild-type allele, 313 bp; Ot forward, 5′-TTTGGCCACAGTCCA-TCTGA-3′, and Ot reverse, 5′-ATCGAAGCAGTTCCTTGTCA-3′; ot allele, 341 bp. All reactions were performed using AmpliTaq Gold (Applied Biosystems, Foster City, CA) according to the manufacturer’s instructions with 2 mm MgCl2 and the addition of 2 μl of Gene Releaser (Bio Ventures, Murfreesboro, TN) per 25 μl reaction. PCRs were initiated by incubation at 94°C for 12 min, followed by 36 cycles of 94°C for 1 min, 60°C for 1 min, and 72°C for 45 s, followed by 1 cycle at 72°C for 10 min. PCR products were resolved by agarose gel electrophoresis.
Tissue preparation for electrophysiology.
Mice were anesthetized with ketamine (100 mg/kg, i.p.) and decapitated. The brainstem was rapidly removed and immersed in ice-cold oxygenated sucrose substituted artificial CSF (S-ACSF). This solution was continually bubbled with Carbogen gas (95% O2 and 5% CO2) and contained the following (in mm): 250 sucrose, 25 NaHCO2, 10 glucose, 2.5 KCl, 1 NaH2PO4, 1 MgCl2, and 2.5 CaCl2. The brainstem was placed on a Styrofoam support block and glued rostral side down onto a brass or Teflon platform with cyanoacrylate glue (Loctite 454; Loctite, Caringbah, Australia). The platform was then placed in a chamber containing oxygenated S-ACSF. Transverse slices (300 μm thick) were obtained from the brainstem region containing the hypoglossal nucleus (∼0.5 mm above and below the obex) using a tissue slicer (Vibroslice 752; Campden Instruments, Sileby, UK; or Leica VT1000S; Leica Microsystems, Nussloch, Germany). Hypoglossal MNs are clustered in a reliably identified and discrete brainstem nucleus and receive powerful inhibitory drive from interneurons in the adjacent reticular formation (Umemiya and Berger, 1995). The three to four slices containing the hypoglossal nucleus were transferred to a storage chamber containing oxygenated ACSF (118 mm NaCl substituted for sucrose in S-ACSF) and allowed to recover for 1 h before commencing electrophysiological recording.
Recording of evoked and miniature spontaneous glycinergic IPSCs.
Transverse brainstem slices containing the hypoglossal nucleus were held in a recording chamber, using nylon netting fixed to a U-shaped platinum frame, and continually superfused with oxygenated ACSF (exchange rate, 4–6 bath vol/min). Whole-cell voltage-clamp recordings were made at room temperature (21−23°C) from hypoglossal motoneurons, which were visualized using infrared differential interference contrast (IR-DIC) optics and a Hamamatsu CCD camera (model C-2400) connected to a video monitor. Under IR-DIC optics, hypoglossal motoneurons are readily distinguished by their large size (diameter, 20–35 μm, vs 10–15 μm for local interneurons) and their large capacitance (>35 pF for motoneurons vs <20 pF for interneurons). Patch electrodes (2–3 MΩ resistance), made from thin-walled borosilicate glass (1.5 mm outer diameter; Vitrex 1631; Modulohm, Herlev, Denmark), were filled with an internal solution containing the following (in mm): 130 CsCl, 10 HEPES, 10 EGTA, 1 MgCl2, 2 ATP, and 0.3 GTP, pH adjusted to 7.35 with 1 m CsOH.
After obtaining the whole-cell recording configuration, series resistance and neuron input resistance were calculated based on the response to a 5–10 mV hyperpolarizing voltage step from a holding potential of –70 mV. These values were monitored at the beginning and end of each recording session and data were rejected if values changed by >20%. Miniature glycinergic IPSCs (mIPSCs), which represent the postsynaptic response to spontaneous release of single vesicles of neurotransmitter (Katz, 1969; Bekkers and Stevens, 1989) were pharmacologically isolated by including the sodium channel blocker, tetrodotoxin (TTX) (1 μm), the AMPA-kainate receptor antagonist 6-cyano-7-nitroquinoxaline-2,3-dione (CNQX) (10 μm), and the GABAA receptor antagonist bicuculline (10 μm) in the bath perfusate. At least 3 min of data were acquired under these conditions. Addition of strychnine (1 μm) abolished all synaptic activity (see Fig. 1A,B), confirming that mIPSCs recorded under these conditions were GlyR mediated. Evoked glycinergic synaptic currents (IPSCs) were acquired by extracellular stimulation, using a bipolar stimulating electrode placed on the surface of the slice in the adjacent ipsilateral reticular formation (ventrolateral to the hypoglossal nucleus) (Umemiya and Berger, 1995). All glycinergic currents were recorded at a holding potential of –70 mV, amplified and filtered at 5 kHz with an Axopatch 1D amplifier (Molecular Devices, Foster City, CA). Signals were recorded onto videotape using a video recorder (VCR) (Vetter, Rebersburg, PA) and subsequently digitized off-line at 10 kHz [using Whole Cell Program (WCP), Strathclyde Electrophysiology Software; or Axograph version 4.6–4.8 software]. In later experiments, data were digitized on-line using Axograph software.
Analysis of IPSCs.
In early experiments, glycinergic mIPSCs were detected and captured using a threshold detection criterion (∼5 pA) provided in the WCP analysis package (kindly provided by J. Dempster, Strathclyde Electrophysiology Software, Glasgow, UK). In later experiments, a sliding template method (semiautomated procedure within Axograph software package) was used to detect and capture mIPSCs (Clements and Bekkers, 1997). Captured mIPSCs were individually inspected and excluded from the analysis if they included overlapping mIPSCs or had an unstable baseline before the rise or after the decay phase of the mIPSC. Data were rejected if a significant trend was evident in either mIPSC amplitude or instantaneous frequency over the course of the experiment. Analyses were performed on averaged mIPSCs, generated by aligning the rising phase of all accepted mIPSCs. Peak amplitude, rise-time (calculated over 10–90% of peak amplitude), and decay time constant (calculated over 20–80% of the decay phase) were obtained using automated procedures within the WCP and Axograph analysis programs. mIPSC frequency was obtained by dividing the number of captured events by the recording time in seconds.
Ligand binding assays.
Brainstem and spinal cords were removed from killed animals, stored at –80°C, and homogenized ice-cold in Polytron homogenizer in PBS with protease inhibitors (leupeptin, 10 μg/ml; bacitracin, 100 μg/ml; PMSF, 1 mm). Membrane pellets were collected by centrifugation at 100,000 × g and resuspended in ice-cold PBS with protease inhibitors. This process was repeated three times and membranes were stored frozen at −80°C. Strychnine binding isotherms were obtained using aliquots of 250–750 μg membrane protein, determined using the Bio-Rad Protein Assay (Bio-Rad, Hercules, CA), incubated with [3H]strychnine (1–50 nm) (41 Ci/mmol; New England Nuclear, Boston, MA) with and without 10 mm unlabeled strychnine. After incubation to equilibrium at 4°C for 60 min, the membranes were harvested using a Brandel cell harvester onto Whatman GF-B filters, presoaked in 0.3% polyethleneimine, and washed twice with 2 ml of ice-cold PBS. Radioactivity remaining on the filters was counted in 5 ml of BCS liquid scintillant (Amersham Biosciences, Buckinghamshire, UK). Binding assay data were analyzed using Inplot4 software (GraphPad, San Diego, CA).
Fluctuation analysis of glycine-induced membrane currents.
In some experiments, outside-out membrane patches (Hamill et al., 1981) were excised from motoneuron somata at the completion of mIPSC recordings, to determine mean single-channel conductance of GlyRs in the spastic and spasmodic mutants. This was achieved by fluctuation or “noise” analysis (Sigworth, 1980) of the membrane current induced by bath application of low concentrations of glycine (25–100 μm). Current signals were recorded (filtered at 10 kHz) onto a PCM video recorder and analyzed off-line using the SPAN software in the Stathclyde Electrophysiology Software program suite. Plots of variance versus mean membrane current were obtained from epochs (256 ms) recorded during the rising phase of the current response to bath-applied glycine. Background variance, from sources other than the glycine-induced current, was removed by subtracting the mean value of ∼30 epochs recorded before glycine application. Single-channel current was estimated from a linear function fit to the initial phase of the mean current versus variance plots.
Whole-cell responses to glycine and picrotoxin.
The effect of the plant alkaloid picrotoxin on glycine-mediated whole-cell currents (holding potential, –70 mV) was used to test for the presence of homomeric or heteromeric GlyRs in spa/spa animals (Pribilla et al., 1992; Handford et al., 1996). Glycine (50 μm) and picrotoxin (50 or 100 μm) were dissolved in ACSF and applied to the somata of hypoglossal motoneurons via a u-tube device. The u-tube outflow was placed directly over the hypoglossal nucleus, just touching the slice surface. Solutions were applied via the u-tube (3 s application) in the following order: glycine/glycine plus picrotoxin/glycine. This protocol was repeated three times with a 30 s interval between successive applications to avoid GlyR desensitization. Peak responses and area within the first 2 s of each response were measured and averaged across the three successive protocols.
Measuring GlyR-channel conductance at synaptic locations.
The single-channel conductance of the channels underlying miniature GlyR-mediated synaptic currents, was analyzed using peak scaled nonstationary noise analysis provided in the Mini Analysis Program version 6 (Synaptosoft, Fort Lee, NJ). This method calculates a weighted mean of the underlying multiple conductance states of synaptically located channels (Robinson et al., 1991; Traynelis et al., 1993) [Singer and Berger (1999), as applied to GlyR-mediated mIPSCs]. Briefly, mIPSCs are aligned (midpoint of rise) and averaged. This average mIPSC is scaled to the peak amplitude of the individual mIPSCs for each neuron. The peak scaled average current is then subtracted from individual mIPSCs to obtain a difference current, which represents random channel fluctuations around the mean. Difference currents are then binned into 20 divisions over the mIPSC decay phase. The variance is then plotted against the mean current. A parabolic function is fit to the data: variance = I [current] − [current2]/NP + baseline noise, where I is single-channel current and NP is average number of channels open at mIPSC peak (Traynelis et al., 1993).
Statistical analysis.
Multivariate ANOVA with one between factor (mouse genotype) was used to determine whether the properties of GlyR-mediated mIPSCs differed across the four mouse genotypes. Student–Newman–Keuls post hoc tests were used to determine where differences existed among genotypes. Comparisons of mean single-channel conductance in spastic and spasmodic lines were analyzed using single-factor (genotype) ANOVA and post hoc Student’s t tests after Bonferroni’s correction for multiple comparisons (Sokal and Rohlf, 1995). All two-sample comparisons were made using two-sample Student’s t tests. Statistical significance was set at p < 0.05. All data are presented as mean ± SEM unless otherwise indicated.
Chemicals.
TTX was obtained from Alomone Laboratories (Jerusalem, Israel). All other drugs were purchased from Sigma (St. Louis, MO).
Results
Recordings were made from hypoglossal neurons in seven mouse genotypes. Animal ages (days) for each genotype were as follows (mean ± SEM): wild-type (+/+), 32 ± 3, n = 12; spa/+, 36 ± 9, n = 13; spa/spa, 33 ± 5, n = 11; spd/+, 73 ± 16, n = 11; spd/spd, 51 ± 12, n = 9; ot/+ or +/+, 17 ± 1, n = 5; ot/ot, 17 ± 1, n = 7. Previous studies in rodents indicate that the development of glycinergic transmission is complete by 2–3 weeks after birth (Becker et al., 1992; Singer et al., 1998). Therefore, all recordings were obtained from adult mice (i.e., >21 d), except for oscillator animals. Oscillator animals aged 16–18 d were used for comparisons because the mutation is fatal at ∼21 d (Buckwalter et al., 1994). In oscillators, the startle phenotype is evident by 16–18 d; however, the animals are still healthy. Oscillator control data were obtained from unaffected littermates (ot/+ or +/+) (see breeding regimen in Materials and Methods). Both access (∼7 MΩ) and input resistances (∼70 MΩ) were similar for neurons recorded from each genotype (multivariate ANOVA with genotype as within factor). This indicates that any differences in synaptic physiology, observed across genotypes, was not attributable to recording conditions.
Glycinergic transmission in wild-type mice
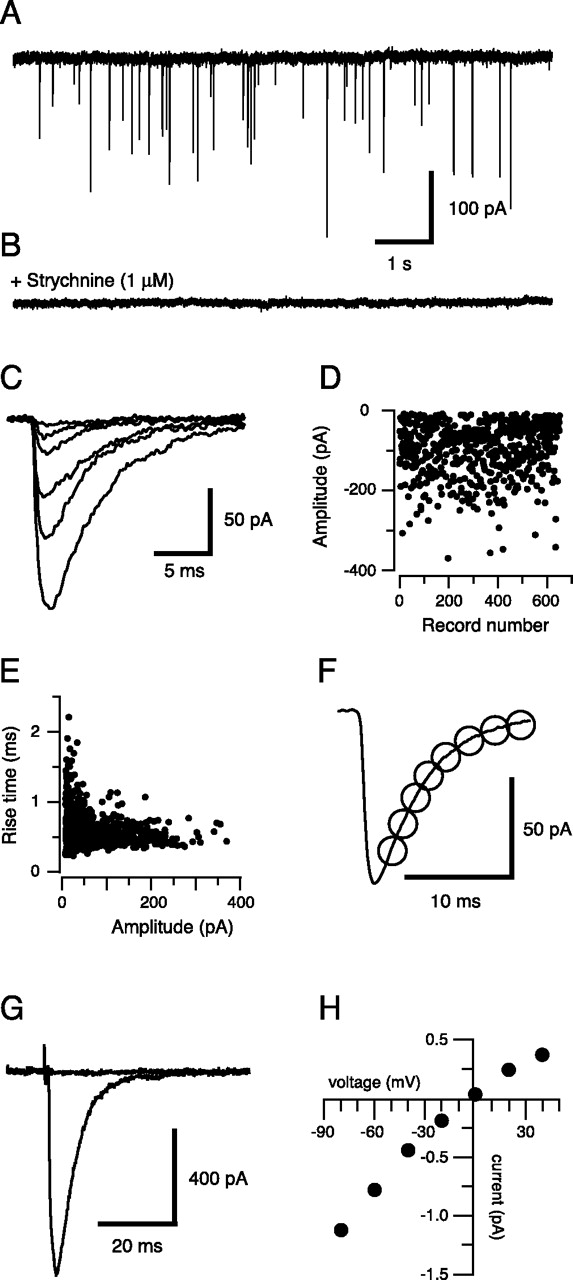
Glycinergic mIPSCs were recorded with a symmetrical chloride concentration at a holding potential of –70 mV. Under these conditions, and in the presence of TTX (1 μm), CNQX (10 μm), and bicuculline (10 μm), large inward currents were observed (Fig. 1A) at frequencies ranging from 0.6 to 6.7 Hz (n = 23 cells). These events were completely abolished by strychnine (1 μm; n = 6) (Fig. 1B), indicating that they were mediated by activation of postsynaptic strychnine-sensitive GlyRs. As previously reported in rat hypoglossal motoneurons (Singer et al., 1998; Donato and Nistri, 2000), there was a large variability in the amplitude of the glycinergic mIPSCs (Fig. 1C). However, mIPSC amplitudes were stable over time (Fig. 1D). Cells that exhibited time-dependent trends in mIPSC amplitude were excluded from our analysis. Some of this variability in amplitude likely results from a combination of the wide spatial dispersion of GlyR clusters on the large dendritic trees of hypoglossal motoneurons (Viana et al., 1994) and dendritic filtering of the somatically recorded events (Ulrich and Lüscher, 1993). Indeed, plots of rise time against event amplitude reveal that small events had larger average rise times (Fig. 1E). The average mIPSC had a 10–90% rise time of 0.9 ± 0.1 ms, and the decay was well fit by a single exponential with a time constant of 4.9 ± 0.2 ms (n = 23 cells) (Fig. 1F).

Methods used to quantify glycinergic mIPSCs in hypoglossal motoneurons. A, shows 9 s of pharmacologically isolated mIPSCs (holding potential, –70 mV) from a wild-type mouse, recorded in the presence of TTX (1 μm), CNQX (10 μm), and bicuculline (10 μm). B, The addition of strychnine (1 μm) completely abolished the large inward currents in A, confirming that the mIPSCs recorded under these conditions are mediated by GlyRs. C, Examples of captured glycinergic mIPSCs (from A; aligned to rising phase onset) showing their highly variable amplitudes. D, Plot of peak mIPSC amplitudes (650 events) during the course of an experiment (cell illustrated in A), showing the stability of the response. E, Relationship between 10 and 90% rise time and amplitude for mIPSCs shown in D (r2 = 0.06). F, Averaged glycinergic mIPSC from the data in A (average of 100 events). The averaged mIPSC is best fit by a single decay time constant (4.5 ms; open circles). G, An electrically evoked IPSC (average of 10 responses; holding potential, –70 mV), recorded under the same conditions as in A, after stimulation (0.6 ms; 4 V; 0.1 Hz) with a bipolar electrode placed in the reticular formation. The evoked response is completely abolished by the addition of 1 μm strychnine. H, Voltage–current relationship for the glycinergic IPSC shown in G. The reversal potential was near 0 mV, the calculated Nernst reversal potential for equivalent chloride concentrations across the neuronal membrane.
Local electrical stimulation in the presence of CNQX (10 μm) and bicuculline (10 μm) generated an IPSC that was completely blocked by strychnine (1 μm; n = 3 cells) (Fig. 1G). The IPSCs had a linear current–voltage relationship and a reversal potential of −5 ± 1 mV (n = 4 cells) (Fig. 1H). This is consistent with the calculated reversal potential for chloride and confirms that the major ionic species underlying the large inward currents is chloride.
Glycinergic transmission in wild-type and heterozygote mutant mice
To establish appropriate controls for examining the effect of GlyR mutations, we first compared glycinergic mIPSCs from wild-type mice and animals carrying a single mutant allele (i.e., spa/+, spd/+, and ot/+). Whereas mIPSC frequency, rise, and decay time constant are similar in these genotypes, average amplitude of mIPSCs differed (Table 1). Specifically, mIPSC amplitude is smaller in spasmodic and oscillator heterozygotes compared with wild-type and heterozygote spastic mice (56.6 ± 2.7 and 49.1 ± 4.1 pA vs 71.7 ± 3.5 and 65.0 ± 4.5 pA, respectively; multivariate ANOVA, p < 0.05). These data suggest that GlyR density may differ in wild-type vs spasmodic and oscillator heterozygotes.
Comparison of mIPSC properties in wild-type and heterozygote mutant mice
There are several explanations for these observations. First, it is possible that a mixed population of GlyRs are present in spasmodic heterozygotes. For example, receptors might contain various combinations of α subunits (i.e., 2 α1wt, 2 α1A52S, or 1 α1wt and 1 α1A52S). Genetic and biochemical considerations as well as our data, however, suggest these factors do not dramatically affect the GlyR physiology. Moreover, heterozygotes (carriers) of recessive genetic disorders, such as the three mouse mutants under study, are typically without overt phenotypic symptoms.
For oscillator heterozygotes, the above considerations also apply. Additionally, previous studies have shown that glycinergic mIPSC amplitude increases in the first 3 postnatal weeks in rats (Singer et al., 1998). This factor may help explain the reduced mIPSC amplitude observed in oscillator controls because much younger animals were used (16–18 vs >32 d). In summary, these results show that not all features of glycinergic transmission are comparable in wild-type and heterozygote animals. Therefore, when assessing the effect of each mutation on GlyR properties, we use data from age-matched heterozygotes rather than wild-type animals as controls. In this way, we are able to describe the specific physiological changes that are responsible for the phenotypic changes in each mutant line.
Effect of GlyR mutations on glycinergic mIPSC properties
Spastic
As for wild-type animals (Fig. 1), recordings made from hypoglossal neurons from spastic control (+/−) animals show numerous large-amplitude mIPSCs (Fig. 2A). In contrast, recordings made under identical conditions in a spa/spa mouse, show a dramatic reduction in both mIPSC amplitude and frequency (Fig. 2B). In both genotypes, mIPSCs were completely abolished by the addition of strychnine (1 μm) (data not shown) (n = 6 and 7 cells, respectively), confirming that the recorded mIPSCs were mediated by the spontaneous release of glycine from presynaptic terminals and its subsequent activation of GlyRs.

Properties of glycinergic mIPSCs in control (spa/+) and spa/spa mice. A, Three consecutive 5 s traces showing glycinergic mIPSCs recorded in a control mouse. Recordings were made in the presence of TTX (1 μm), CNQX (10 μm), and bicuculline (10 μm) at a holding potential of –70 mV. B, Glycinergic mIPSCs recorded in a spa/spa mouse under conditions identical to A. Note the dramatic reduction in mIPSC amplitude and frequency. C, Overlapping amplitude histograms for control (thin outline) and spa/spa (thick lines) constructed from 888 and 290 events, respectively. The inset shows aligned average mIPSCs for control (thin trace) and spa/spa (thick trace). D, Averaged mIPSCs from control and spa/spa mice (inset in C) scaled to the same peak amplitude. Note that the traces completely overlap.
Figure 2C shows overlapping amplitude histograms for the data presented in Figure 2, A and B. For controls, the amplitude distribution is highly skewed with some mIPSCs exceeding 300 pA. In contrast, the amplitude of the largest mIPSCs in the distribution for spa/spa does not exceed 100 pA. The reduction in mIPSC amplitude is highlighted in the inset in Figure 2C, which compares averaged mIPSCs for control and spa/spa aligned at mIPSC onset. Group data comparing mIPSC amplitude in controls and spa/spa animals indicate that mIPSC amplitude is reduced to ∼30% of control values in spa/spa mice (21.0 ± 2.1 vs 65.0 ± 4.5 pA; n = 19 and 20 cells, respectively; p < 0.05). mIPSC frequency is also significantly reduced in spa/spa animals (0.5 ± 0.1 vs 1.1 ± 0.2 Hz; n = 19 and 20 cells, respectively; p < 0.05). Although the reduction in mIPSC amplitude is clear, it is conceivable that failure to detect small mIPSCs may have in fact over predicted mIPSC amplitude and contributed somewhat to the reduced mIPSC frequency in spa/spa.
Both rise and decay times were similar for controls and spa/spa mice. This is illustrated in Figure 2D, which shows averaged mIPSCs from the two genotypes normalized to the same amplitude. Group data comparing decay times of mIPSCs indicate that decay times were not altered (4.5 ± 0.3 vs 4.7 ± 0.2 ms; n = 19 and 20 cells, respectively). Rise times were also similar in spa/spa and controls (1.1 ± 0.1 vs 1.0 ± 0.1 ms; n = 19 and 20 cells, respectively). In summary, the spastic mutation causes a dramatic reduction in mIPSC amplitude and frequency with no change in mIPSC kinetics.
Spasmodic
Figure 3compares the properties of mIPSCs from spd/+ (heterozygote control) and spd/spd mice recorded under identical conditions to those in Figure 2. In both genotypes, mIPSCs were completely abolished by the addition of strychnine (1 μm) (data not shown) (n = 5 and 5 cells, respectively), confirming that the recorded mIPSCs were GlyR-mediated. mIPSC amplitude and frequency in spd/spd are reduced compared with controls (Fig. 3, compare A, B). Amplitude histograms for mIPSC in the twogenotypes show that, as for spa/+ animals, the distribution is highly skewed for controls with some mIPSCs exceeding 250 pA, whereas the largest mIPSC for spd/spd does not exceed 100 pA (Fig. 3C). This reduction in mIPSC amplitude is highlighted in the inset in Figure 3C. Group data comparing mIPSC amplitude in control and spd/spd animals shows that amplitude is reduced by ∼50% (29.0 ± 3.0 vs 56.6 ± 2.7 pA; n = 20 and 23 cells, respectively; p < 0.05). mIPSC frequency is also significantly reduced in spd/spd animals (1.0 ± 0.3 vs 1.6 ± 0.2 Hz; n = 20 and 23 cells, respectively; p < 0.05).

Properties of glycinergic mIPSCs in control (spd/+) and spd/spd mice. A, Three consecutive 5 s traces showing glycinergic mIPSCs recorded in a control mouse. Recordings were made in the presence of TTX (1 μm), CNQX (10 μm), and bicuculline (10 μm) at a holding potential of –70 mV. B, Glycinergic mIPSCs recorded in a spd/spd mouse under identical conditions to A. Note the reduction in mIPSC amplitude and frequency. C, Overlapping amplitude histograms for control (thin outline) and spd/spd (thick lines) constructed from 893 and 228 events, respectively. The inset shows aligned average mIPSCs for control (thin trace) and spd/spd (thick trace). D, Averaged mIPSCs from control and spd/spd mice (inset in C) scaled to the same peak amplitude. The mIPSC from spd/spd (heavy trace) has a significantly faster decay than the control mIPSC.
When averaged mIPSCs are scaled to the same amplitude, the decay time was faster for spd/spd (Fig. 3D) (2.7 ± 0.2 vs 4.7 ± 0.2 ms; n = 20 and 23 cells, respectively; p < 0.05). The faster decay times in spd/spd were also accompanied by faster mIPSC rise times (0.7 ± 0.1 vs 1.0 ± 0.1 ms; n = 20 and 23 cells, respectively; p < 0.05). In summary, as with the spastic mutation, the spasmodic mutation reduces mIPSC amplitude and frequency. However, the spasmodic mutation also produces more rapid mIPSC kinetics. These data are similar to those previously published in a brief conference report from our laboratory (Callister et al., 1999).
Oscillator
The effect of the oscillator mutation on glycinergic mIPSCs is shown in Figure 4. Both mIPSC amplitude and frequency in ot/ot are dramatically reduced compared with controls (Fig. 4, compare A, B). Although oscillator is considered a null mutation for the adult form of the GlyR, we could still record mIPSCs, albeit small and infrequent, in ot/ot animals. The glycinergic nature of these events was confirmed by their sensitivity to strychnine (data not shown) (n = 3 cells). Figure 4C compares amplitude histograms generated from the data presented in Figure 4, A and B. The distribution is highly skewed for controls with some mIPSCs exceeding 150 pA. In contrast, the largest mIPSC amplitude we recorded in ot/ot was 46 pA. This reduction in mIPSC amplitude is highlighted in the inset in Figure 4C. Group data comparing mIPSC amplitude in controls and ot/ot animals show that amplitude is more than halved in ot/ot mice (19.4 ± 1.8 vs 49.1 ± 4.1 pA; n = 15 and 13 cells, respectively; p < 0.05). In addition, mIPSC frequency is massively reduced in ot/ot animals (0.2 ± 0.1 vs 1.5 ± 0.3 Hz; n = 15 and 13 cells, respectively; p < 0.05).

Properties of glycinergic mIPSCs in control (ot/+) and ot/ot mice. A, Consecutive 5 s traces showing glycinergic mIPSCs recorded from a control mouse. Recordings were made in the presence of TTX (1 μm), CNQX (10 μm), and bicuculline (10 μm) at a holding potential of –70 mV. B, Glycinergic mIPSCs recorded in an ot/ot mouse under identical conditions to A. Note the dramatic decrease in mIPSC amplitude and frequency. Some small strychnine-sensitive mIPSCs can, however, still be resolved (asterisks). C, Overlapping mIPSC amplitude histograms for a control (thin outline) and ot/ot (thick lines) mouse constructed from 992 and 185 events, respectively. The inset shows aligned average mIPSCs for control (thin trace) and ot/ot (thick trace). D, Averaged mIPSCs from control and ot/ot mice (inset in C), overlapped and scaled to the same peak amplitude. The mIPSC from ot/ot (heavy trace) has a significantly slower decay than the control mIPSC.
The decay times for mIPSCs in control and ot/ot mice are compared in Figure 4D. When averaged mIPSCs are scaled to the same amplitude, the decay time is slower for ot/ot (12.3 ± 1.2 vs 4.8 ± 0.2 ms; n = 15 and 13, respectively; p < 0.05). Rise times for mIPSCs were also significantly slower in ot/ot (1.7 ± 0.1 vs 0.8 ± 0.1 ms; n = 15 and 13, respectively; p < 0.05). In summary, as with the spastic and spasmodic mice, the oscillator mutation dramatically reduces mIPSC amplitude and frequency. However, in contrast to spasmodic, the oscillator mutation slows mIPSC kinetics.
GlyR affinity and density in mutant mice
One interpretation of the reduced mIPSC amplitude and frequency data (Figs. 2⇑–4) is that the mutations alter overall GlyR number. To examine this possibility, we used radioligand binding assays with [3H]strychnine on brainstem and spinal cord membrane preparations to determine receptor affinity and density in wild-type and mutant mice. The affinity for strychnine binding was not significantly different between wild-type, spa/spa, and spd/spd animals (supplemental Table 1, available at www.jneurosci.org as supplemental material). Strychnine-binding GlyRs were not detectable in ot/ot preparations. Receptor numbers, however, were significantly reduced to <10% of wild-type levels in the spastic and to ∼60% of wild-type levels in the spasmodic mouse. Overall, these radioligand binding data were consistent with changes in receptor number predicted by mIPSCs recorded from the mutant mouse lines.
Conductance of GlyRs in excised patches from spastic and spasmodic
In spastic mice, there is a large reduction in β subunit protein; however, there is no evidence for a change in α subunit expression (White and Heller, 1982; Becker, 1990). Because adult GlyRs coassemble as heteromultimers of α1 and β subunits, we suspected there might be an overabundance of α1 subunits in spa/spa animals and that these subunits could form α1 homomeric GlyR channels in these animals. Such homomeric α1 GlyRs can be differentiated from α1/β heteromers in two ways: by their single-channel conductance and by their picrotoxin sensitivity. Homomeric GlyRs containing α1 subunits have larger single-channel conductances than the heteromeric (α1/β) adult or native form of the receptor (for review, see Rajendra et al., 1997) and are more sensitive to picrotoxin (Pribilla et al., 1992; Handford et al., 1996). To test for the presence of homomeric receptors, we determined mean single-channel conductance of GlyRs in the spastic and spasmodic mutants by noise analysis of the membrane current induced by bath application of low concentrations of glycine (25–100 μm) to outside-out patches excised from the somas of hypoglossal motoneurons. For each experiment, the applied glycine concentration was adjusted to generate an inward current that did not exceed −50 pA from a holding potential of –50 mV.
Application of glycine to outside-out patches excised from either control (spa/+) or spa/spa animals evoked robust currents. Example responses to bath-applied glycine from a control (spa/+) and spa/spa animal are shown in Figure 5, A and B, respectively. Comparison of the top (ACSF) and bottom current traces (ACSF plus glycine) show that glycine application increased membrane noise in patches from both control and spa/spa animals. The fluctuation in membrane noise is, however, clearly greater in the excised patch from the spa/spa animal (Fig. 5B, bottom trace). Linear fits to plots of current variance versus mean current (Fig. 5C) show that the slope of this relationship, which predicts mean single-channel conductance (Hille, 1992), clearly differs for spa/spa versus control (multiple regression analysis comparing slopes; p < 0.05). Mean single-channel conductance was significantly greater in spa/spa (64.2 ± 5.0 pS; n = 14 patches) compared with spa/+ (36.1 ± 1.4 pS; n = 10 patches; ANOVA, p < 0.05). Similar experiments were also performed on patches from spasmodic mutants (data not shown). In contrast to patches from spa/spa, the slope of the current variance versus mean current plot for the spd/spd mutant is similar to control (Fig. 5D). No difference was detected in the mean single-channel conductance of spd/+ and spd/spd (32.5 ± 2.1 vs 35.3 ± 2.2 pS; n = 9 and 11 patches, respectively; multiple-comparison Student’s t test, p > 0.4). Together, these data show that glycine receptor channels with larger single-channel conductance are present in neurons from spastic mice. In contrast, mean single-channel conductance is unaltered in mice carrying the spasmodic mutation.
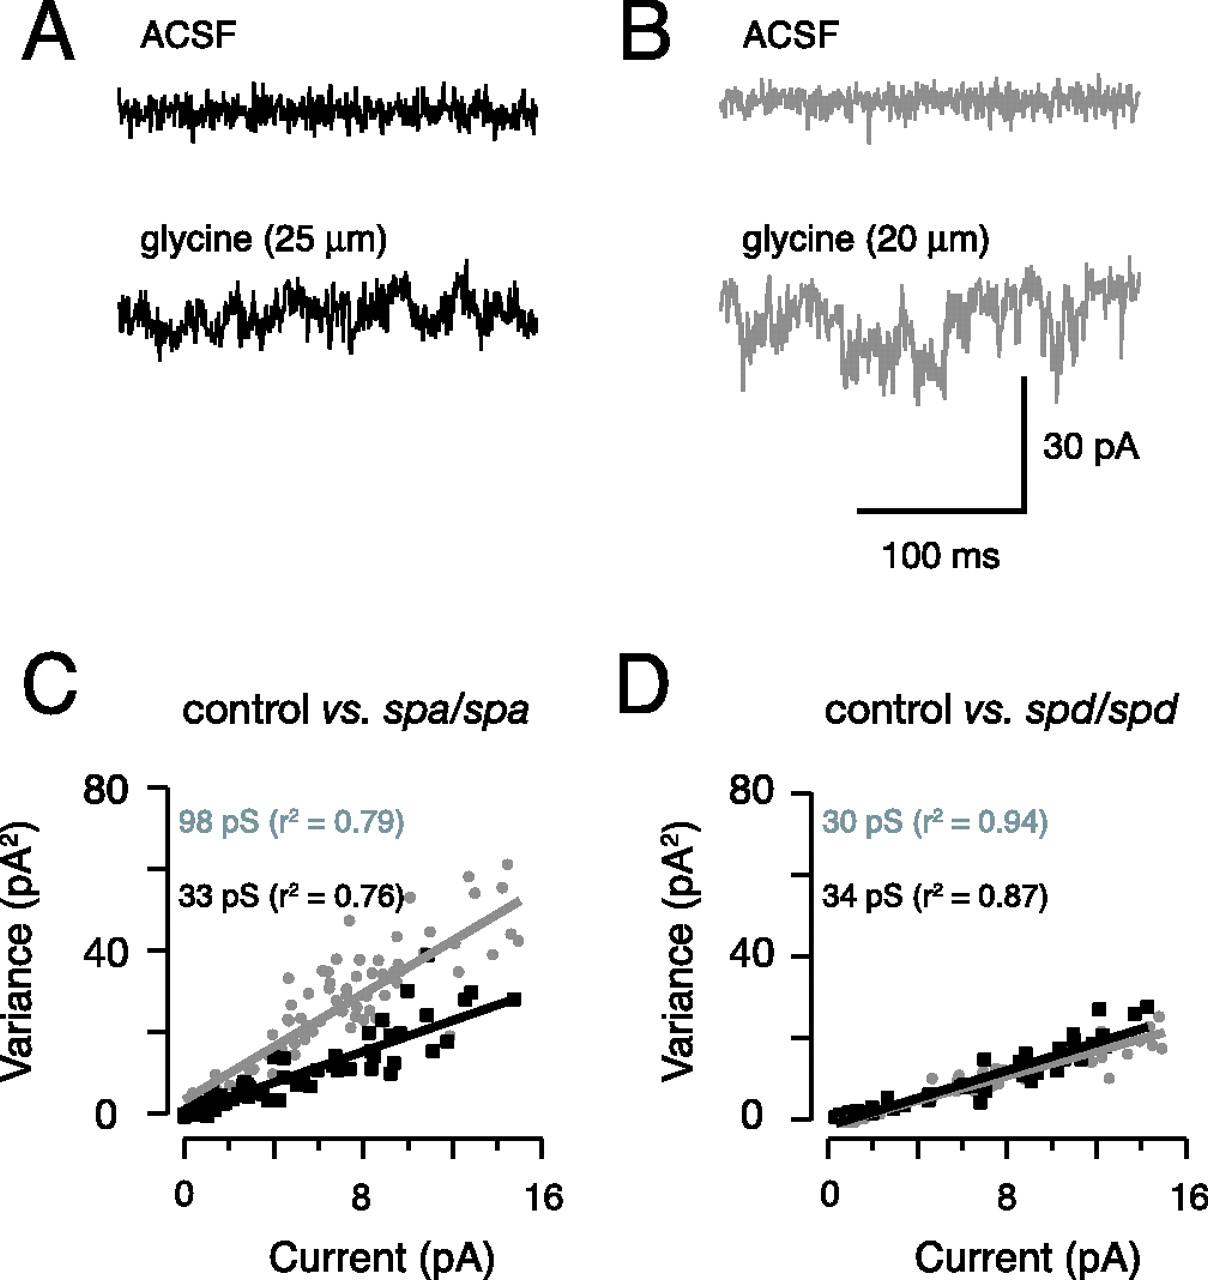
Noise analysis on excised patches from neurons in spastic and spasmodic mice. A, Membrane current recordings (256 ms epochs) obtained in outside-out patches excised from the somata of hypoglossal motoneurons in a control (spa/+) animal (holding potential, –50 mV). Note the clear increase in membrane noise (bottom vs top trace) after the addition of 25 μm glycine to the perfusate. B, Membrane current recorded in a patch from a spa/spa animal in ACSF and after the addition of glycine. Membrane noise increases after the addition of glycine. C, Current variance analysis for membrane currents recorded in patches from a spa/+ (gray circles) and spa/spa (black squares) animal. Variance was calculated over 256 ms epochs during the rising phase of the glycine-activated current as described in Materials and Methods. The solid lines are linear fits to the current variance data, and the slope of this relationship predicts mean single-channel conductance, which is greater in the spastic animal (96 vs 33 pS). D, Identical analysis to C for the spasmodic mutation. The slope of linear fits to the initial part of the current variance plot is similar in patches from spd/+ (gray circles) and spd/spd animals (black squares).
Properties of extrasynaptic and synaptic GlyRs in spastic mice
The presence of large conductance GlyRs in spa/spa suggests that the spastic mutant is assembling α1 subunit homomeric receptors. To further test for the presence of such receptors, we compared the picrotoxin sensitivity of whole-cell GlyR currents in control and spa/spa mice. Because a significant difference in GlyR density exists between control (spa/+) and spa/spa animals (White and Heller, 1982) (Fig. 2; supplemental Table 1, available at www.jneurosci.org as supplemental material), preliminary experiments were performed to determine an optimal glycine concentration that could be applied to control and spa/spa neurons (i.e., a concentration that would not produce excessively large currents in control neurons and cause channel rundown, yet still produce sufficiently large currents in spa/spa to reliably assess picrotoxin sensitivity). A concentration of 50 μm glycine satisfied these two criteria with whole-cell currents being approximately twice as large in control versus spa/spa animals (peak amplitude, 638 ± 148 vs 307 ± 54 pA; n = 18 and 13 cells, respectively).
Figure 6shows the inhibition of glycine-mediated whole-cell currents by two concentrations of picrotoxin (50 μm in Fig. 6A and 100 μm in Fig. 6B) in control and spa/spa animals. These picrotoxin concentrations are based on our previous work on recombinant GlyRs (Handford et al., 1996; Rees et al., 2002), which showed that the IC50 values for picrotoxin were 25 ± 6 and 420 ± 92 μm for homomeric and heteromeric GlyRs, respectively. The dark traces in the left of Figure 6 show responses from a control animal to 3 s sequential applications (30 s apart) of glycine, glycine plus picrotoxin, and glycine. The gray traces to the right show responses from spa/spa collected under the same experimental protocol. The amplitude of the glycine-mediated whole-cell currents in both control and spa/spa was clearly reduced by coapplication of picrotoxin (middle black and gray traces). This picrotoxin sensitivity is clearly greater in spa/spa neurons at both 50 μm (Fig. 6A) (24 vs 51% block; p < 0.05) and 100 μm (Fig. 6B) (27 vs 71% block; p < 0.05) picrotoxin concentrations (two-sample Student’s t tests for both concentrations). This increased sensitivity is consistent with the proposal that a greater proportion of GlyR channels in the spastic mutant are α1 homomers, and supports the hypothesis that the large conductance GlyR channels in excised membrane patches from spa/spa (Fig. 5E) are α1 subunit homomeric receptors.

Picrotoxin sensitivity of glycine-mediated whole-cell currents in the spastic mutant. A, Picrotoxin sensitivity (50 μm) of glycine-mediated whole-cell currents. Left three traces (black lines) show whole-cell currents recorded in a hypoglossal motoneuron (holding potential, –70 mV) from a control (spa/+) animal in the presence of TTX (1 μm), CNQX (10 μm), and bicuculline (10 μm). The traces show sequential responses (30 s intervals) to 3 s applications of glycine, glycine plus 50 μm picrotoxin, and then glycine. Results for a similar experiment to A in a spa/spa motoneuron are shown in next sequence of three traces (gray lines). Glycine-mediated whole-cell currents in spa/spa neurons are more sensitive to 50 μm picrotoxin. B, Sensitivity of glycine-mediated whole-cell currents to 100 μm picrotoxin. Experiments are presented in the same manner as in A. The picrotoxin sensitivity of glycine-mediated currents is again much greater in spa/spa versus control neurons.
Adult glycine receptors at synapses are thought to be α1/β heteromers (Legendre, 2001; Lynch, 2004; Grudzinska et al., 2005). Indeed, the gephyrin binding site is on the β subunit and is necessary for synaptic anchoring of these receptors (Kirsch and Betz, 1995; Feng et al., 1998). Because our data provide direct evidence for the assembly of homomeric α1 GlyRs in spa/spa, we tested whether α1 subunit homomeric receptors are present at functional synapses. First, we compared the picrotoxin sensitivity of evoked glycinergic synaptic currents in control and spa/spa animals. Figure 7A shows an experiment from a control animal in which picrotoxin sensitivity of evoked glycinergic synaptic currents was examined. The addition of picrotoxin (50 μm; middle trace) caused a modest and reversible reduction in the amplitude of the evoked synaptic current. The results of similar experiments in controls and spa/spa are summarized in Figure 7B. GlyR-mediated evoked IPSCs from both genotypes have similar picrotoxin sensitivities (22 ± 6 vs 13 ± 5% block; n = 5 and 4 cells, respectively; two-sample Student’s t tests, p > 0.3), unlike whole-cell currents (Fig. 6). These data indicate that homomeric GlyRs are excluded from postsynaptic membranes in both control and spa/spa animals.

Picrotoxin sensitivity of evoked IPSCs in the spastic mutant. A, Evoked IPSCs (average of 10 records) recorded in ACSF, ACSF plus picrotoxin (50 μm), and after wash back to ACSF. Data are from a control (spa/+) mouse. B, Summary of the effect of picrotoxin (50 μm) on the normalized amplitude of evoked IPSCs in control and spa/spa neurons (n = 5 and 4, respectively). Neurons in control and spa/spa animals showed identical picrotoxin sensitivity. Error bars indicate SE. C, Mean current variance plots for mIPSCs from a control and spa/spa neuron. The mean single-channel currents for these neurons were calculated as 3.1 and 3.4 pA, respectively (for details, see Materials and Methods and Results). Mean single-channel current/conductance was not significantly different for controls versus spa/spa animals.
To further confirm that α1 homomers are not present at synapses, we estimated the single-channel conductance of synaptic GlyRs using peak-scaled nonstationary noise analysis on mIPSCs (see Materials and Methods) in control and spa/spa animals. Figure 7C shows mean current variance plots for mIPSCs from control and spa/spa animals. Overall, the mean single-channel current for controls and spa/spa were similar (2.8 ± 0.2 vs 2.5 ± 0.2 pA; n = 13; two-sample Student’s t tests, p > 0.3). These results correspond to mean single-channel conductances of 40 ± 3 vs 36 ± 3 pS for synaptic GlyRs in control and spa/spa animals. Consistent with the large differences in mIPSC amplitudes (Fig. 2), the average number of channels contributing to the peak of the mIPSC was greater for control versus spa/spa animals (NP = 30 ± 2.7 vs NP = 14 ± 1.5, respectively) (p < 0.05).
Discussion
This study compared the consequences of three naturally occurring GlyR mutations on adult GlyR function. Each mutation reduced glycinergic mIPSC amplitude and frequency: most in ot/ot and least in spd/spd. The effect on GlyR kinetics varied, with mIPSC decay time being unaltered in spa/spa, decreased in spd/spd, and increased in ot/ot. We also provide evidence for high-conductance α1 homomeric GlyR channels in the spastic mutant at extrasynaptic loci.
The effect of GlyR mutations on synaptic transmission
Based on strychnine binding, the spastic mutation reduces GlyR numbers without altering affinity (supplemental Table 1, available at www.jneurosci.org as supplemental material) (White and Heller, 1982; Becker et al., 1986). Consistent with these binding data and previous physiological studies (Biscoe and Duchen, 1986; Callister et al., 1999; Graham et al., 2003; von Wegerer et al., 2003), our recordings in spa/spa show that GlyR-mediated mIPSC amplitude and frequency are decreased but decay time is unchanged (Fig. 2). These findings, coupled with a decrease in the average number of channels contributing to the peak of the mIPSC (Fig. 7C), are consistent with decreased GlyR density at individual release sites. The reduced mIPSC frequency in spa/spa also provides evidence for a decrease in the number of connections/release sites (Turrigiano, 1999; Kilman et al., 2002). An alternative to reduced GlyR density is a preferential redistribution of GlyRs to distal dendritic loci. This would lead to greater electrotonic filtering of mIPSCs in spa/spa, reduced mIPSC amplitude, and slowed mIPSC time course. The similar mIPSC rise and decay times in spa/spa and controls, however, argues against changes in GlyR distribution. Thus, although the spastic mutation decreases β subunit protein production (Kingsmore et al., 1994; Mülhardt et al., 1994), the transcribed β subunit is still able to combine effectively with α1 subunits, form normal receptors, and be targeted to postsynaptic densities.
In spd/spd, strychnine binding (supplemental Table 1, available at www.jneurosci.org as supplemental material), mIPSC amplitude, and frequency are decreased. mIPSC time course is substantially faster (Fig. 3), whereas noise analysis on excised patches (Fig. 5) shows that mean single-channel conductance is unaffected. As for spa/spa, somatodendritic redistribution of mutant GlyRs could partly account for these observations. For instance, distally located GlyRs would reduce mIPSC amplitude and slow the mIPSC time course. The reduced mIPSC amplitude and faster time course we observed in spd/spd argues against this, and favors an explanation based on altered channel properties.
Previous studies have measured a sixfold reduction in glycine sensitivity in recombinant α1 homomeric receptors carrying the spasmodic mutation (Ryan et al., 1994; Saul et al., 1994). The 50% reduction in mIPSC amplitude we observed in spd/spd is consistent with these data. Likewise, the reduced strychnine binding (supplemental Table 1, available at www.jneurosci.org as supplemental material) suggests GlyR density might also contribute to reduced mIPSC amplitude. The faster mIPSC rise and decay times we observed suggests the main effect of the spasmodic mutation is to increase the rate of glycine unbinding and shorten the time the receptor remains activated (Legendre, 2001). Thus, the faster mIPSC decay rate is likely to be attributable to a concomitant reduction in channel mean open time. Detailed single-channel analysis is needed to test this issue directly. Functionally, the faster mIPSC time course in spd/spd mice results in substantially lower charge transfer for mIPSCs of similar amplitude. This could account for the very similar phenotypes for spd/spd and spa/spa animals despite differences in mean mIPSC amplitude.
In ot/ot, glycinergic mIPSC amplitude, frequency, and strychnine binding (supplemental Table 1, available at www.jneurosci.org as supplemental material) are reduced to levels approaching zero (Fig. 4). However, we could still resolve small amplitude strychnine-sensitive mIPSCs in ot/ot animals that had slow kinetics compared with controls (Fig. 4). The presence of any glycinergic mIPSCs in ot/ot animals is surprising, because the mutation is considered functionally null for the adult form (α1/β) of the GlyR (Kling et al., 1997). One explanation is that GlyRs in oscillator mice contain other α subunit isoforms (α2, α3, or α4 subunits) (Malosio et al., 1991; Harvey et al., 2004). For example, α3 and α4 subunits are expressed in spinal cord and cerebellum, respectively. In the hypoglossal nucleus, the α2 subunit is heavily expressed in neonates but levels decline by approximately postnatal day 14 (Becker et al., 1992; Singer et al., 1998). However, unlike the other mutants, our findings in ot/ot (low amplitude and slowed mIPSCs) are consistent with a distal dendritic location for these remaining GlyR clusters. Regardless of their somatodendritic location, these compensatory GlyRs can still cluster postsynaptically in ot/ot. The level of glycinergic inhibition they provide, however, is not sufficient to sustain life.
The spastic mutation alters GlyR subunit assembly and expression
Adult GlyRs are α1/β heteromers and, in expression systems, have a substantially lower mean channel conductance than α1 homomers (∼40 vs ∼85 pS) (Bormann et al., 1993; Rajendra et al., 1997). In agreement, the major in vivo adult form of the GlyR (α1/β heteromer) also has a low single-channel conductance of 30–40 pS (Singer et al., 1998), suggesting either α1 homomers are not present in the adult or are present in very low densities.
Our data showing a single-channel conductance of 36 pS in patches and 40 pS in mIPSCs from control mice are comparable with the above literature. Noise analysis on patches from spa/spa revealed the presence of high conductance GlyRs that were not evident in controls or the other mutants (Fig. 5). The 64 ± 5 pS mean channel conductance recorded in spa/spa patches is comparable with substates of 30–88 pS measured in recombinant α1 homomeric GlyRs (Bormann et al., 1993; Rajendra et al., 1995, 1997). These results indicate that, when β subunits are dramatically reduced in spa/spa mice, the pool of available α1 subunits can assemble as homomeric GlyRs.
To further test this hypothesis, we used the different picrotoxin sensitivities (Pribilla et al., 1992; Handford et al., 1996) of heteromeric and homomeric GlyRs to conclude that the spa/spa mutant is assembling and expressing homomeric α1 GlyRs (Fig. 6). These results are consistent with a recent report by Molon et al. (2006), using real-time reverse transcription-multiplex PCR and Western blot analysis, which showed that overexpression of α1 GlyR subunits correlated with symptomatic recovery in adult spa/spa animals. Our data show that these “compensatory” homomeric GlyRs are not present at functional synapses (Fig. 7). We conclude that synaptic GlyRs in both spa/spa and controls are α1/β heteromers and that “compensatory” α1 homomeric GlyRs in spa/spa are confined to extrasynaptic loci.
Function of extrasynaptic GlyRs in spastic
There is now considerable evidence that LGICs, including GlyRs, can reside at both synaptic and extrasynaptic locations (Flint et al., 1998; Collingridge et al., 2004; Triller and Choquet, 2005). A role for extrasynaptic LGICs is well established for the GABAA receptor, with extrasynaptic receptors providing tonic inhibition (Semyanov et al., 2004; Farrant and Nusser, 2005). Could the extrasynaptic GlyRs in spa/spa play a similar role? If so, this may also explain why spa/spa mice are viable, but ot/ot mice and the bovine recessive α1 subunit myoclonus mutation (Pierce et al., 2001) are lethal.
Extrasynaptic GlyRs are present in various CNS regions (Flint et al., 1998; Delaney and Sah, 1999; Mori et al., 2002); however, unlike the GABAA receptor, their physiological role is unknown. One report suggests extrasynaptic GlyRs play a developmental role (Flint et al., 1998). In cortical and hippocampal neurons, extrasynaptic GlyRs are sensitive to locally released taurine and β-alanine (Mori et al., 2002), suggesting these GlyRs can modulate cell excitability. Future experiments in the spastic mouse addressing the function of extrasynaptic α1 homomeric receptors may help determine the role of GlyRs in CNS regions rostral to the brainstem.
The absence of homomeric GlyRs at synaptic locations in spa/spa has implications for our understanding of GlyR development, because the exact composition of fetal synaptic GlyRs has been controversial (Legendre, 2001). Single-channel analysis and immunolabeling suggest fetal GlyRs have an α2 homomeric stochiometry (Takahashi et al., 1992). This observation is at odds with the notion that the GlyR β subunit stabilizes or clusters GlyRs at postsynaptic densities (Meyer et al., 1995). Our data show that α1 homomeric GlyRs are not targeted to synapses in spa/spa and further confirms that the β subunit is essential for targeting fetal or adult GlyRs to synapses, arguing against an α2 homomeric stoichiometry for synaptic fetal GlyRs.
In summary, our analysis of GlyR mutants reveals that different genetic mutations, although producing similar behavioral phenotypes, alter GlyR properties and composition and result in distinct alterations in glycinergic transmission. The mechanisms underlying the effect of each mutation on GlyR assembly and expression are summarized in supplemental Figure 1 (available at www.jneurosci.org as supplemental material). These distinct alterations in the efficacy of glycinergic transmission in motoneurons seem likely to underlie the severe motor phenotype observed in a number of species and clinical conditions.
Footnotes
-
This work was supported by the National Health and Medical Research Council of Australia (Grants 993050, 157209, 276403, and 980382), the Hunter Medical Research Institute, and the University of Newcastle. We thank Sarah Walker and Anna Scimone for providing the ligand binding data (supplemental Table 1, available at www.jneurosci.org as supplemental material) and genotyping, respectively.
- Correspondence should be addressed to Dr. Robert J. Callister, School of Biomedical Sciences, Faculty of Health, The University of Newcastle, Callaghan, New South Wales 2308, Australia. Email: robert.callister{at}newcastle.edu.au


