

Abstract
Fusion of a single vesicle induces a quantal response, which is critical in determining synaptic strength. Quantal size varies at most synapses. Its underlying mechanisms are not well understood. Here, we examined five sources of variation: vesicular glutamate concentration ([Glu]v), vesicle volume, ultrafast fusion pore closure, the postsynaptic receptor, and the location between release and the postsynaptic receptor cluster at glutamatergic, calyx of Held synapses. By averaging 2.66 million fusion events from 459 synapses, we resolved the capacitance jump evoked by single vesicle fusion. This capacitance jump, an indicator of vesicle volume, was independent of the amplitude of the miniature EPSC (mEPSC) recorded simultaneously at the same synapses. Thus, vesicle volume is not the main source of mEPSC variation. The capacitance jump was not followed by submillisecond endocytosis, excluding ultrafast endocytosis as a source of variation. Larger mEPSCs were increased to a lesser extent by presynaptic glutamate dialysis, and reduced to a lesser extent by γ-DGG (γ-d-glutamylglycine), a competitive AMPA receptor blocker, suggesting that a higher glutamate concentration in the synaptic cleft contributes to the large size of mEPSCs. Larger mEPSCs were not accompanied by briefer rise times, inconsistent with the prediction by, and thus arguing against, the scenario that larger mEPSCs are caused by a shorter distance between the release site and the postsynaptic receptor cluster. In summary, the different amplitudes of mEPSCs were mainly attributable to release of vesicles having similar volumes, but different glutamate amounts, suggesting that [Glu]v is a main source of quantal size variation.
Introduction
Fusion of a single vesicle induces a quantal postsynaptic current, the size of which is a basic determinant of synaptic strength. Regulation of quantal size may underlie various forms of synaptic plasticity (Malinow and Malenka, 2002; Liu, 2003; Turrigiano and Nelson, 2004). A ubiquitous feature of quantal response is variation of its amplitude. The origin of quantal size variation remains not well understood (Liu, 2003). Both presynaptic and postsynaptic mechanisms have been considered. Accumulated evidence suggests that single quantal release is insufficient to saturate postsynaptic receptors, and the dominant source of variability is presynaptic, at least at hippocampal excitatory synapses (Liu, 2003). Here, we consider five potential sources of variation.
The first possibility is vesicle volume. Two sets of evidence support this possibility. First, the quantal size distribution at hippocampal synapses and leech Retzius neurons is similar to the vesicle volume distribution (Bekkers et al., 1990; Bruns et al., 2000). Second, in leech Retzius neurons, the mean serotonin concentration in large dense-core vesicles and small clear-core vesicles are similar (Bruns et al., 2000). In Drosophila mutants, the mean vesicle volume and the mean quantal size are changed in parallel (Zhang et al., 1998; Karunanithi et al., 2002; Daniels et al., 2004). In endocrine cells, dense-core vesicles are larger after drug treatments or transporter overexpression that increases quantal size (Colliver et al., 2000; Pothos et al., 2000). These results lead to the hypothesis that transmitter concentration is maintained at a predetermined level in each vesicle (Sulzer and Edwards, 2000). Accordingly, variation in vesicle volume may cause quantal size variation.
The second possibility is vesicular transmitter concentration, as implied by two pieces of evidence. First, overexpression of vesicular transporter for transmitters like acetylcholine and glutamate increases the quantal size (Song et al., 1997; Wojcik et al., 2004; Wilson et al., 2005). Second, increasing the cytosolic glutamate concentration elevates the vesicular glutamate concentration at calyx-type synapses (Ishikawa et al., 2002). The third possibility is fusion pore closure. In endocrine cells, rapid fusion pore closure allows for partial transmitter release (Lindau and Alvarez de Toledo, 2003). Regulation of the pore closure time may therefore control transmitter release. Because transmitter discharge from clear-core vesicles is usually less than a few milliseconds (Stiles et al., 1996; Klyachko and Jackson, 2002; He et al., 2006), the fusion pore must close within a few milliseconds after fusion to control transmitter release. It remains unclear whether such a rapid closure occurs at synapses.
The fourth possibility is the relative position between release and the postsynaptic receptor cluster, referred to as the release-location mechanism. This possibility was raised by simulations and the finding of transmitter spillover from neighboring synapses (Franks et al., 2003; Nielsen et al., 2004; Cathala et al., 2005). The fifth candidate is the postsynaptic receptor cluster size or density (Nusser et al., 1997; Lim et al., 1999; Oleskevich et al., 1999). By examining these five possibilities, we found that [Glu]v is a main source of quantal size variation at glutamatergic calyx-type synapses.
Materials and Methods
For simultaneous capacitance and miniature EPSC (mEPSC) recordings (see Figs. 1⇓–3), parasigittal brainstem slices (200 μm thick) containing the medial nucleus of the trapezoid body were prepared from 7- to 10-d-old Wistar rats using a vibratome (Borst et al., 1995). Recordings were made in solutions that pharmacologically isolated presynaptic Ca2+ currents (Borst et al., 1995) and postsynaptic AMPA receptor-mediated mEPSCs (Sun et al., 2002). Bath solution contained the following (in mm): 105 NaCl, 20 tetraethylammonium (TEA)-Cl, 2.5 KCl, 1 MgCl2, 2 CaCl2, 25 NaHCO3, 1.25 NaH2PO4, 25 dextrose, 0.4 ascorbic acid, 3 myo-inositol, 2 sodium pyruvate, 0.001 tetrodotoxin (TTX), 0.1 3,4-diaminopyridine, 0.05 d-APV, 0.01 bicuculline, 0.01 strychnine, pH 7.4 when bubbled with 95% O2 and 5% CO2. The presynaptic pipette (2.5–4.5 MΩ) solution contained the following (in mm): 105 Cs-gluconate, 20 CsCl, 4 MgATP, 10 Na2-phosphocreatine, 0.3 GTP, 10 HEPES, 10 EGTA, and 7.5 CaCl2, pH 7.2, adjusted with CsOH (osmolarity was 310–320 Osm). This presynaptic solution (10 mm EGTA and 7.5 mm CaCl2) increased the intracellular calcium concentration ([Ca2+]i) to 482 ± 29 nm (n = 3) (Sun et al., 2002), and thus increased the mEPSC frequency to 12.5 ± 0.5 Hz (n = 459). Postsynaptic pipette (2–3 MΩ) solution contained the following (in mm): 125 K-gluconate, 20 KCl, 4 MgATP, 10 Na2-phosphocreatine, 0.3 GTP, 10 HEPES, and 0.5 EGTA, pH 7.2, adjusted with KOH (osmolarity was 310–320 Osm). If not mentioned, the postsynaptic series resistance was not compensated. The holding potential for both presynaptic and postsynaptic recordings was –80 mV.
For experiments shown in Figures 4⇓⇓–7, horizontal brainstem slices (200 μm thick) containing the medial nucleus of the trapezoid body were prepared from 7- to 10-d-old Wistar rats. Recordings were made in solutions that pharmacologically blocked Na+ currents and isolated postsynaptic AMPA receptor-mediated mEPSCs (Sun et al., 2002). Bath solution contained the following (in mm): 105 NaCl, 20 TEA-Cl, 2.5 KCl, 1 MgCl2, 2 CaCl2, 25 NaHCO3, 1.25 NaH2PO4, 25 dextrose, 0.4 ascorbic acid, 3 myo-inositol, 2 sodium pyruvate, 0.001 TTX, 0.1 3,4-diaminopyridine, 0.05 d-APV, 0.01 bicuculline, 0.01 strychnine, pH 7.4 when bubbled with 95% O2 and 5% CO2. The presynaptic pipette (2.5–4.5 MΩ) solution contained the following (in mm): 25 Cs-gluconate, 20 CsCl, 4 MgATP, 10 Na2-phosphocreatine, 0.3 GTP, 10 HEPES, 0.05 BAPTA, 100 l-glutamic acid, pH 7.2, adjusted with CsOH (osmolarity was 310–320 Osm). Data were expressed as mean ± SEM. Unless otherwise mentioned, a t test was used for statistical analysis.
Measurements of membrane capacitance, membrane conductance, and series conductance.
For presynaptic measurements of the whole-cell capacitance, membrane conductance, and series conductance, we used the EPC-9 amplifier and the software lock-in amplifier (PULSE; HEKA, Lambrecht, Germany) that implements Lindau-Neher's technique. The frequency of the sinusoidal stimulus was 1000 Hz and the peak-to-peak voltage of the sine wave was ≤60 mV. We previously selected calyces showing a single exponential decay of their passive current transients (Sun and Wu, 2001; Sun et al., 2002). In this study, however, we did not perform any preselection. This is because the capacitance jump, the rate of endocytosis, and the capacitance artifact are similar for calyces showing a monoexponential or a biexponential decay in their passive current transients (Taschenberger et al., 2002; Sun et al., 2004).
Subtraction of the sine wave interference noise.
During capacitance recording, a sine wave voltage command at 1000 Hz was applied to the calyx. Thus, the presynaptic current (Ipre) showed a sine wave current at 1000 Hz (data not shown). Via the capacitance coupling, the postsynaptic current also showed a small sine wave current at the same frequency. This sine wave noise, detected as the difference between the noise obtained with and without the presynaptic sinusoidal command in the frequency domain, were subtracted. Currents in the time domain were converted to the frequency domain using the Fourier Transform function built in the Igor software (WaveMetrics, Lake Oswego, OR). After subtracting the noise at 1000 Hz, the current in the frequency domain was converted to the time domain using the inverse Fourier transform function built in the Igor software. As a result, most sine wave interference noise at 1000 Hz was removed (see Fig. 1A).
Detection of mEPSCs, and average of mEPSCs and presynaptic capacitance.
The original postsynaptic recording trace was acquired with a low-pass filter at 5 kHz and sampled at 20 kHz. To reduce the noise, the original postsynaptic trace was further low-pass filtered at 1 kHz using a digital filter implemented in the Igor program. The low-pass-filtered trace was differentiated. A homemade program written in the Igor software was used to search for peaks that were less than −20 pA/ms by analyzing the smoothed first and second derivatives of the trace (the differentiated trace). The information about the peak position (x ms) was recorded and used to measure the peak amplitude (y) of the candidate mEPSC in the low-pass postsynaptic mEPSC trace. The y-value was calculated as the difference between the peak value, which was the minimum value within time x and (x + 0.8) ms, and the baseline value, which was the mean between (x − 0.5) and (x − 1) ms. If y ≤ (−10 pA), the mEPSC was accepted. If the mEPSC was accepted, the original postsynaptic trace (without low-pass filter at 1 kHz) between time (x − 150) and (x + 250) ms was collected for averaging. The traces for Cm, Gm, Gs, and Ipre were also collected between time (x − 150) and (x + 250) ms for averaging.
The mEPSC and the Ipre were sampled at 20 kHz, whereas Cm, Gm, and Gs were sampled at 1 kHz because the sine wave command was 1 kHz. Thus, the x position obtained from the mEPSC trace was in between the two neighboring sampled Cm (or Gm, Gs) points. The sampled Cm (or Gm, Gs) data point to the right of x was aligned with x. As a result, the capacitance jump was aligned 0–1 ms ahead of the true signal. Thus, our resolution to the difference between the onset of the capacitance jump and the mEPSC was limited to 1 ms. It was interesting to note that such an alignment method could average out a capacitance noise produced by a very brief outward current (for detail, see supplemental material 1.3, available at www.jneurosci.org).
For every paired recording, we first detected at least 100 mEPSCs at the beginning and the end of recordings using the homemade program described above. We then confirmed these events by eye. If >95% of events were confirmed by eye, all of the rest of the mEPSCs were accepted. Otherwise, the postsynaptic recordings were too noisy and thus were discarded.
For every synapse recorded, the noise of the membrane capacitance recording was measured as the SD of a single capacitance trace over a period of time. If SD was >25 fF, data were discarded. The SD of individual capacitance traces was 13.3 ± 0.2 fF (n = 459 synapses). If 2.66 million capacitance traces with a mean SD of 13.3 fF are averaged, the SD of the averaged trace would be 8.2 aF (=13.3 fF/2,660,0000.5). This predicted value was close to the SD (10.6 aF) (see Fig. 1D) of the experimentally obtained mean capacitance trace.
The spontaneous release (mEPSC) frequency was 12.5 ± 0.5 Hz (n = 459 synapses). Assuming that each vesicle fusion is independent, the chance of getting multiple vesicle release at the same time is negligible. When we identified an mEPSC, the recording period between 150 ms before and 250 ms after the mEPSC was collected for averaging. During this recording period, multiple vesicle fusion occurred. This does not affect the averaged capacitance jump as demonstrated with simulation (for detail, see supplemental material 9, available at www.jneurosci.org).
Simulation on how the release-location mechanism influences the mEPSC.
We performed Monte Carlo simulations of quantal events with MCell 2.50, a program modeling the three-dimensional random walk diffusion and reaction kinetics in complex spatial environments reflecting realistic cellular ultrastructure (Stiles et al., 2000). We ran MCell 2.50 on the National Institutes of Health Biowulf cluster, a Beowulf parallel processing system (http://biowulf.nih.gov). Consisting of 2440 processors running on the Linux operating system, the system provides high-performance computational capabilities.
The results shown in Figure 7, A–C, were based on the following parameters commonly used to model a synapse (Stiles et al., 1996; Choi et al., 2003; Pawlu et al., 2004). The diffusion coefficient for glutamate was 1.5 × 10⁻⁶ cm2/s (Choi et al., 2003). The presynaptic and postsynaptic sites of the synaptic cleft were modeled as planar sheets, 0.2 × 0.2 μm on each side, separated by a 20 nm cleft from the postsynaptic membrane. A vesicle was aligned at the center of the presynaptic membrane sheet. The vesicle was modeled as a cube (Stiles et al., 1996) with an inner edge length of 37 nm. The volume of this cube is about the same as a round vesicle with a diameter of 46 nm, as reported in the calyx (Sätzler et al., 2002). The cube contained 10,000 glutamate molecules. The postsynaptic receptor cluster was composed of 50 AMPA receptors arranged in a square with an area of 0.01 μm2. The center of the square was positioned at the center or various distances from the center of the postsynaptic membrane sheet. This square was surrounded by the square-shaped presynaptic and postsynaptic barriers, each occupying 10% of the cleft width. The reaction scheme for AMPA receptors was taken from Hausser and Roth (1997). Fusion occurred at the center of the presynaptic membrane sheet with a pore length of 15 nm, similar to the length of a gap junction (Spruce et al., 1990). Fusion is assumed to open a large fusion pore (>5–10 nm), which allows for near instant transmitter diffusion out of the vesicle. Each simulated trace in Figure 7, A and B, was the average of 100 runs of simulation.
The above parameters were chosen because the simulated mEPSC with the fusion site aligned with the center of the postsynaptic receptor cluster (see Fig. 7A, black) was approximately similar to the measured mean mEPSC at the calyx-type synapse (see Fig. 7D, black). For example, for the simulated mEPSC (see Fig. 7A, black), the 10–90% rise time was 0.16 ms, the 20–80% decay time was 1.69 ± 0.05 ms, and the peak number of open AMPA receptors was 30.2. For the mean mEPSC measured with the series resistance compensation, the 10–90% rise time was 0.21 ± 0.01 ms (n = 8 synapses, 2015 mEPSCs), the 20–80% decay time was 1.61 ± 0.30 (n = 8 synapses), and the experimentally estimated peak number of AMPA receptors being activated by release of a vesicle is ∼22 (Sahara and Takahashi, 2001). Furthermore, the time constants of AMPA receptor desensitization and deactivation are ∼1–3 and ∼1–1.5 ms, respectively, in the postsynaptic neurons of the calyx-type synapse at 7- to 11-d-old rats (Geiger et al., 1995; Koike-Tani et al., 2005). These time constants are similar to those (desensitization, 4.9 ms; deactivation, 1.1 ms) (data not shown) obtained by simulation using the AMPA receptor reaction scheme of Hausser and Roth (1997). Thus, the reaction scheme proposed by Hausser and Roth (1997) was approximately similar to AMPA receptors at the calyx-type synapse, but with a slightly slower rate of desensitization.
To determine whether the slightly slower rate of desensitization affects simulation results shown in Figure 7A–C, we modified a parameter in the reaction scheme (Hausser and Roth, 1997), Koc7, from 113.1/s to 413.1/s. This modification reduced the time constant of desensitization during prolonged application of 10 mm glutamate to 1.9 ms (from 4.0 ms) in simulation (data not shown), which was similar to the experimentally measured value at calyces (Geiger et al., 1995; Koike-Tani et al., 2005). With this modified scheme, we repeated simulation as shown in Figure 7A–C. We found that the rise time decreased as the simulated mEPSC amplitude increased, which was almost identical to the results shown in Figure 7A–C (data not shown). Thus, for the simulation results shown in Figure 7A–C, we used the reaction scheme of Hausser and Roth (1997) without any modification.
With the parameters listed above, our simulation shows that, when distancefusion_receptor is increased, the mEPSC rise time is increased, whereas the mEPSC amplitude is decreased (see Fig. 7A–C). Similar results were obtained when we varied each parameter within a range once at a time. The parameter and the range we varied include the diffusion coefficient (1.5 − 3.3 × 10⁻⁶ cm2/s), the width of the synaptic cleft (20–28 nm), the number of glutamate molecules in the vesicle (3000–20,000), the number (50–400) and area (0.005–0.02 μm2) of the AMPA receptor cluster, and the reaction scheme for AMPA receptors (either from Jonas et al., 1993; or Hausser and Roth, 1997). Thus, the results shown in Figure 7, A–C, were robust simulation results.
Results
The capacitance jump induced by fusion of a single vesicle
If variation in the vesicle volume is responsible for the mEPSC variation, vesicles with a smaller volume should give rise to smaller mEPSCs. To test this prediction, we simultaneously recorded at the same synapse the mEPSC and the presynaptic membrane capacitance (Cm) (Fig. 1A), the latter of which can be converted to the vesicle volume (see Eqs. 22–27 in supplemental material 5, available at www.jneurosci.org).

The capacitance jump induced by single vesicle fusion. A, Sampled mEPSCs, Ipre, presynaptic Cm, Gm, and Gs from a synapse. B, Left, The mean mEPSC, Ipre, Cm, Gm, and Gs (from top to bottom) averaged from 2.66 million fusion events obtained from 459 paired recordings. Baselines were fit with linear regression lines (red). All traces are shown without filtering. Middle, Traces from left, at higher resolution, showing data within 20 ms before and after the onset of the mEPSC. The arrow indicates a brief outward current. Right, The mEPSC (top) and Ipre (bottom) shown in a higher time resolution, indicating the coincidence of Ipre deflection with the mEPSC rising phase. For detailed discussion on how Ipre deflection may affect capacitance measurements, see supplemental material 1 (available at www.jneurosci.org). C, Cm values within 20 ms before and after the onset of the mEPSC (middle of B) were not correlated with the corresponding Gm (top) and Gs (bottom) values, indicating that the capacitance jump was not a result of changes in Gm or Gs. These values were expressed as the difference between the values of Cm, Gm, or Gs at each time point (every circle in the middle of B) and the values at 20 ms before the onset of the mEPSC (the first time point in the middle of B). For more detailed description of these data, see supplemental material 1 (available at www.jneurosci.org). D, Same data as in B, but with a baseline correction made by subtracting the linear regression line shown in B from corresponding traces. Ipre is also low-pass filtered at 0.2 kHz and shown in gray, indicating a small outward current coincident with the decrease of Gm after the mEPSC onset. Because Ipre is shown in a larger scale, the outward deflection shown in B is truncated here.
In addition to Cm, the membrane conductance (Gm), series conductance (Gs), and the current (Ipre) (for resolving Ipre, see Materials and Methods) were recorded from the calyx (Fig. 1A). Because the Cm of a vesicle was much lower than the capacitance noise, averaging was needed to resolve single vesicle fusion (Sun et al., 2002). Using a pipette solution with elevated calcium (see Materials and Methods), we increased the rate of mEPSCs to 12.5 ± 0.5 Hz, and collected 2.66 million mEPSCs from 459 paired recordings with low capacitance noise. The amplitude of the averaged mEPSC was 22.4 ± 0.008 pA (n = 2.66 million mEPSCs) (Fig. 1B) (for additional discussion, see supplemental material 4, available at www.jneurosci.org). The resulting mean capacitance jump (ΔCm) occurred at <1 ms before the onset of the averaged mEPSC (Fig. 1B,D). Our time resolution was 1 ms because the sinusoidal frequency for capacitance measurements was 1000 Hz.
The ΔCm was not caused by a change in Gm or Gs, because the capacitance change within 20 ms before and after the mEPSC onset (Fig. 1B, middle) was not correlated with changes in Gm or Gs (Fig. 1C) (for more detail, see supplemental material 1.1, available at www.jneurosci.org). The averaged presynaptic current (Ipre) showed a brief deflection at the onset of the mEPSC (Fig. 1B, arrow), which was caused by the postsynaptic mEPSC likely via a capacitance coupling (supplemental Figs. S1, S2B; for detail, see supplemental material 1.2, available at www.jneurosci.org). This brief presynaptic current deflection induced a negligible capacitance increase compared with the amplitude (61 aF) (see below for measurements) of ΔCm (supplemental Figs. S1, S2; for detail, see supplemental material 1.2 and 1.3, available at www.jneurosci.org). When the baseline drift of Cm, Gm, Gs, and Ipre were corrected by fitting the baseline drift with a linear regression line (Fig. 1B, red) and subtracting it from the data (Fig. 1D), a small, but relatively prolonged decrease in Gm was observed (Fig. 1D). This relatively prolonged decrease in Gm was attributable to a relatively prolonged, but very small increase in Ipre (Fig. 1D, gray) (for calculations, see supplemental material 1.2, available at www.jneurosci.org). Simulation suggests that such a small increase in Ipre would cause a negligible capacitance change compared with the amplitude (61 aF) of ΔCm. In summary, extensive analysis, experiments, and simulations indicate that the mean ΔCm (Fig. 1B,D) was not correlated with, and thus not caused by changes in Gm, Gs, Ipre, and postsynaptic currents (for detail, see supplemental material 1 and 2, available at www.jneurosci.org).
The mean capacitance trace averaged from 2.66 million fusion events aligned at the mEPSC onset (Fig. 1B) showed a baseline increase. This baseline increase (within 150 ms before the capacitance jump) was fit with a linear regression line (Fig. 1B, red). Subtracting this fitted line from the mean capacitance trace yielded a baseline-corrected Cm trace (Fig. 1D). The capacitance jump of this trace, measured as the difference between the mean of the capacitance within 50 ms after and before the mEPSC onset, was 61 aF.
Our measurement of the capacitance jump was not affected by endocytosis, because significant endocytosis did not occur during the first 50 ms of the capacitance jump (Fig. 1D). This was apparently different from our previous report that the capacitance jump after a single vesicle fusion decays with a time constant of ∼56 ms (Sun et al., 2002). The present result was more reliable, because approximately eight times more data were used for averaging. Because the current study does not focus on endocytosis, we explain the apparent difference in detail in supplemental material 3 (available at www.jneurosci.org).
Vesicle volume is not the main source of the mEPSC variation
To determine whether the mEPSC amplitude depends on the vesicle volume, the number of mEPSCs (Fig. 2C) and the cumulative probability (Fig. 2D) were plotted as a function of the mEPSC amplitude for each recorded synapse. At each recorded synapse, the cumulative probability curve was used to divide mEPSCs and the corresponding capacitance trace into three groups corresponding to 0–40, 40–70, and 70–100% in the curve (Fig. 2D, dotted lines). Within each group, the mEPSC and the corresponding capacitance trace were averaged. We divided mEPSCs based on the mEPSC amplitude cumulative probability curve instead of the absolute mEPSC amplitude. This may minimize the effect of different vesicle sizes or postsynaptic receptor cluster sizes on averaging among different synapses.

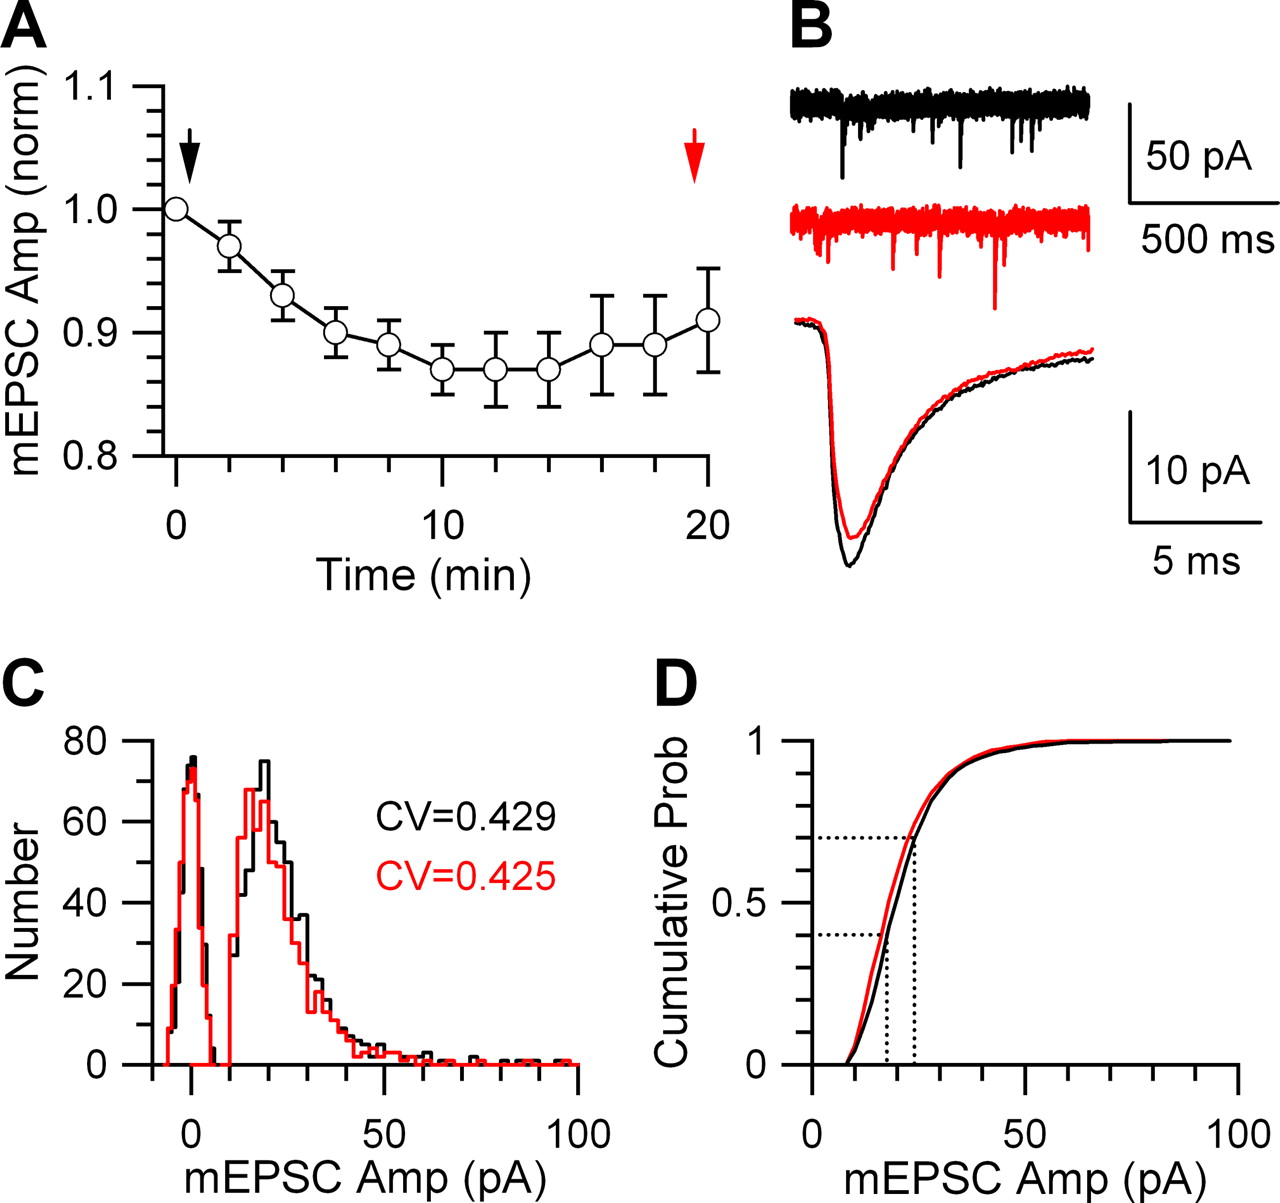
The mEPSC rundown is minimal within 20 min of paired recording. A, The normalized (norm) mean mEPSC amplitude recorded as a function of time after the presynaptic whole-cell recording was established (n = 15 synapses). The arrows indicate the time at which mEPSCs showed in B were recorded. Error bars indicate SEM. B, Sampled mEPSCs (top) and the mean mEPSC (bottom) at 0–1 min (black) and 19–20 min (red) after presynaptic whole-cell recording was established. The mean EPSC amplitude was 21.0 ± 0.1 pA (n = 625 mEPSCs) at 1 min after break-in (black), and 19.0 ± 0.1 pA (n = 653 mEPSCs) at 20 min after break-in (red). C, D, The mEPSC amplitude distribution (C) and the cumulative probability (prob) (D) as a function of the mEPSC amplitude obtained in 0–1 min (black) and 19–20 min (red) after the presynaptic whole-cell recording was established. The coefficient of variation (CV) was labeled in C. The dotted lines in D divided mEPSCs obtained in 0–1 min after presynaptic break-in (black) into three groups corresponding to 0–40, 40–70, and 70–100% in the cumulative probability curve. This method of grouping mEPSCs was used for analysis in Figure 3.

The capacitance jump is independent of the mEPSC amplitude. A, The mEPSC (top) and the corresponding capacitance signal (bottom) were divided into three groups based on the cumulative probability curve (0–40, 40–70, and 70–100%) of the mEPSC amplitude obtained from every recorded synapse (Fig. 2D). The averaged signals of each of these three groups (0–40% group, 1.06 million events; 40–70% group, 0.80 million events; 70–100% group, 0.80 million events) are shown. The baseline drift of the capacitance trace was corrected by subtraction of a linear regression fit of the baseline (for an example, see supplemental Fig. S3 in supplemental material 3, available at www.jneurosci.org). The dotted red lines indicate the mean of the baseline and the capacitance jump within 50 ms before and after the mEPSC onset. B, The capacitance jump of the three traces shown in A is plotted versus their corresponding mEPSC amplitude measured from traces shown in A (solid circles). Under the assumption that the mEPSC amplitude is linearly proportional to the vesicle volume, the expected capacitance jumps are also plotted for the 40–70 and the 70–100% group (open circles; see Eq. 1 for calculations).
The mEPSC was recorded while using a presynaptic pipette solution lacking glutamate. In 20 min of such paired recordings, the mEPSC amplitude ran down by a maximum of 13 ± 2% (n = 15) (Fig. 2A,B), and the coefficient of variation changed from 0.419 ± 0.016 (n = 15) to 0.421 ± 0.022 (n = 15), which was not significantly different (p = 0.47, t test). The rate of rundown was similar to that of a previous report (Ishikawa et al., 2002). Thus, our recording time was limited to 20 min with a mean of 7.9 ± 0.3 min (n = 459 paired recordings). To further avoid rundown, the cumulative probability curve was generated from every 5 min or less of recording.
For the three groups of mEPSCs divided based on the cumulative probability curve, their mean amplitudes were mEPSC0–40% = 14.6 ± 0.002 (1.06 million events), mEPSC40–70% = 20.9 ± 0.003 (0.80 million events), and mEPSC70–100% = 33.7 ± 0.014 pA (0.80 million events), respectively (Fig. 3A,B). The amplitudes of the corresponding capacitance jumps (ΔCm), measured as the difference between the mean capacitance values within 50 ms before and after the mEPSC onset, were ΔCm0–40% = 61 aF, ΔCm40–70% = 62 aF, and ΔCm70–100% = 58 aF, respectively (Fig. 3A,B). Thus, capacitance jumps were similar, whereas the mean mEPSC amplitude differed by 2.3 (33.7/14.6) times (Fig. 3B).
If the 2.3-fold difference in the mEPSC amplitude was attributable to variation in the vesicle volume, were our capacitance measurements sensitive enough to detect the difference? We addressed this question in the following. Because the vesicle in the calyx can be treated as a sphere (Sätzler et al., 2002) and the membrane capacitance of a vesicle is proportional to the surface area of a vesicle, the vesicle volume is proportional to the membrane capacitance of a vesicle raised to a power of 1.5 (see Eq. 25 in supplemental material 5, available at www.jneurosci.org). If variation in the mEPSC amplitude is attributable to variation in the vesicle volume, the membrane capacitance (ΔCmy) of a vesicle, vesicle y, could be predicted on the basis of the following:
 where ΔCmx is the membrane capacitance of another vesicle, vesicle x, and mEPSCy and mEPSCx are the amplitude of the mEPSC caused by release of vesicle y and x, respectively (for derivation of Eq. 1, see supplemental material 5, available at www.jneurosci.org). Let the 0–40% group in the cumulative probability curve be group x, and the other two groups (40–70 and 70–100%) be group y. With the measured values of mEPSC0–40%, mEPSC40–70%, mEPSC70–100%, and ΔCm0–40%, Equation 1 predicts that ΔCm40–70% = 78 aF and ΔCm70–100% = 107 aF. As described in detail in supplemental material 6 (available at www.jneurosci.org), these two predicted values (Fig. 3B, open circles) were significantly larger than the measured values (62 and 58 aF) (Fig. 3B, solid circles) (χ2 test, p < 0.001). The statistical significance (p < 0.005) holds even when the capacitance noise is fully taken into account (for detail, see supplemental material 6, available at www.jneurosci.org). Thus, the assumption that the mEPSC variation is attributable to variation in the vesicle volume is incorrect. Furthermore, at 95% confidence level, the contribution of the vesicle volume to the mEPSC variation was <20% (for detail, see supplemental material 6, available at www.jneurosci.org). The same conclusion was reached regardless of which group was taken as group x. We concluded that vesicle volume variation is not the main source of quantal size variation.
The mEPSC amplitude is independent of the time between fusion and retrieval
Could small mEPSCs be caused by partial release of transmitter because of endocytosis that is too fast to detect? This possibility is highly unlikely for three reasons. First, it predicts smaller ΔCm for smaller mEPSCs. In contrast to this prediction, ΔCm did not change significantly, whereas the mEPSC amplitude varied by 2.3 times (Fig. 3). Second, our detection limit was 1 ms, and there have been no reports of rapid endocytosis, which takes <1 ms. Third, if a significant fraction of vesicles are retrieved faster than our detection limit of 1 ms, the detected mean ΔCm of single vesicle fusion should be less than the vesicle capacitance estimated from electron microscopy. The mean diameter of vesicles in the calyx, as measured with electron microscopy, was 46 nm (Sätzler et al., 2002). Considering that the specific membrane capacitance is 9 fF/μm2 (Gentet et al., 2000), a spherical vesicle with a diameter of 46 nm corresponds to a membrane capacitance of 60 aF. This value matched well with the experimentally measured ΔCm of 61 (Fig. 1D) or 68 aF (supplemental Fig. S3E in supplemental material 3, available at www.jneurosci.org), suggesting that rapid fusion and retrieval contributes minimally to quantal size variability.
Postsynaptic receptor number (or density) is not the main source of quantal size variation
To determine whether variation in the postsynaptic receptor cluster size (or density) (Nusser et al., 1997; Lim et al., 1999; Oleskevich et al., 1999) causes quantal size variation, we used two approaches. First, we dialyzed glutamate into the calyx, which increases the mEPSC amplitude by increasing the amount of glutamate in the vesicle (Ishikawa et al., 2002). The mEPSCs were first collected for ∼5–10 min from the postsynaptic neuron (Fig. 4A), which served as control. Next, another pipette containing 100 mm glutamate was positioned at the corresponding calyx to form a whole-cell configuration, which took ∼1–2 min. Within 2–3 min after establishing the presynaptic whole-cell configuration (Fig. 4A, arrow), the mEPSC amplitude increased to a plateau level, which was 53 ± 6% higher than control (n = 16 synapses) (Fig. 4A) (Ishikawa et al., 2002). The mEPSC frequency before (1.7 ± 0.3; n = 16) and after (2.1 ± 0.4; n = 16) glutamate dialysis did not change significantly (t test, p > 0.2). Glutamate dialysis shifted the mEPSC amplitude distribution (Fig. 4B) and the cumulative probability curve (Fig. 4C) to the right (Ishikawa et al., 2002).

Glutamate dialysis increases larger mEPSCs to a smaller extent. A, Left, The mean mEPSC, averaged over every 60 s, was increased after a presynaptic pipette containing 100 mm glutamate broke into a calyx (arrow). Right, Sample mEPSCs (top) and the mean mEPSC (bottom) collected before (Ctrl) (black) and after glutamate (Glu) (red) dialysis. The mean EPSC amplitude was 26.5 ± 0.7 pA (n = 421 mEPSCs) (black) for control and 39.3 ± 0.8 pA (n = 452 mEPSCs) (red) after glutamate dialysis. Data in A–D were from the same synapse. B, The mEPSC amplitude distribution before (Ctrl) (black) and after glutamate dialysis (Glu) (red). Background noise distribution (peaks centered at ∼0 pA) was obtained from ∼10–20 ms of recordings in which no mEPSCs were evident (also applies to Figs. 5B, 6A,D). C, The cumulative probability plotted versus the mEPSC amplitude before (Ctrl) (black) and 2 min after presynaptic break-in with a pipette containing 100 mm glutamate (Glu) (red). The dotted lines indicate that, at a given cumulative probability level, Y, the corresponding mEPSC amplitude in control (ACtrl) and that after glutamate dialysis (AGlu) can be found. The ratio between AGlu and ACtrl is RGlu/Ctrl. D, RGlu/Ctrl decreased as ACtrl increased. RGlu/Ctrl was calculated for every 5% increase in the cumulative probability level and every 1% increase between 95 and 99% of the cumulative probability level. Thus, for every paired recording such as the one shown in C, 23 RGlu/Ctrl values were obtained with corresponding ACtrl values. E, Pooled data from 16 recorded synapses showing that RGlu/Ctrl decreased as ACtrl increased. RGlu/Ctrl (23 values) and the corresponding ACtrl from each of 16 paired recordings were pooled and then sorted such that ACtrl ascended monotonically and binned for every 16 values. The binned RGlu/Ctrl values were plotted as a function of the corresponding binned ACtrl values. Error bars indicate SEM.

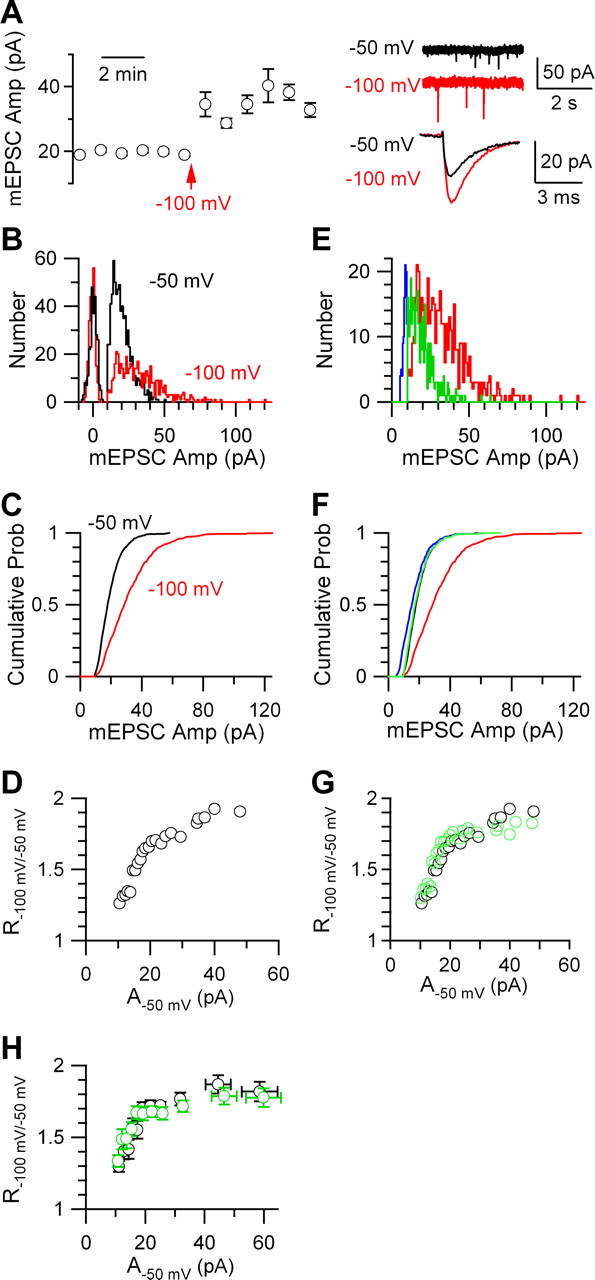
The mEPSC at different holding potentials. A, Left, The mean mEPSC, averaged over every 60 s, was increased after the postsynaptic holding potential was changed from −50 to −100 mV (arrow). Right, Sample mEPSCs (top) and the mean mEPSC (bottom) collected at −50 mV (black) and at −100 mV (red). The mean EPSC amplitude was 20.4 ± 0.3 pA (n = 740 mEPSCs) (black) at −50 mV and 33.0 ± 0.8 pA (n = 496 mEPSCs) (red) at −100 mV. Data in A–G were from the same synapse. B, The mEPSC amplitude distribution at the holding potential of −50 mV (black) and −100 mV (red). C, The cumulative probability plotted versus the mEPSC amplitude at −50 mV (black) and −100 mV (red). D, R−100 mV/−50 mV plotted versus A−50 mV. For methods of calculation, see Figure 4D. E, To mimic recordings at −50 mV, the mEPSC amplitude distribution at −100 mV (red; same as the red trace in B) was manually modified such that the amplitude was divided by the maximum of R−100 mV/−50 mV, 1.93 (blue). The resulting distribution (blue) was further modified such that the number of mEPSCs <10 pA (detection threshold) was 0 (green). F, The cumulative probability curves calculated from mEPSC amplitude distributions in E (same color codes as E). The cumulative probability curve at −50 mV (black) was also plotted, which matched closely with that (green) predicted from results obtained at −100 mV. G, Predicted R−100 mV/−50 mV (green), calculated from the red and green curve in F, matched well with the measured R−100 mV/−50 mV (black; same as in D). H, Pooled data from three recorded synapses showing R−100 mV/−50 mV (black) and the predicted R−100 mV/−50 mV (green) as a function of A−50 mV. The method of binning (6 values for one bin) is similar to that described in Figure 4E. Error bars indicate SEM.

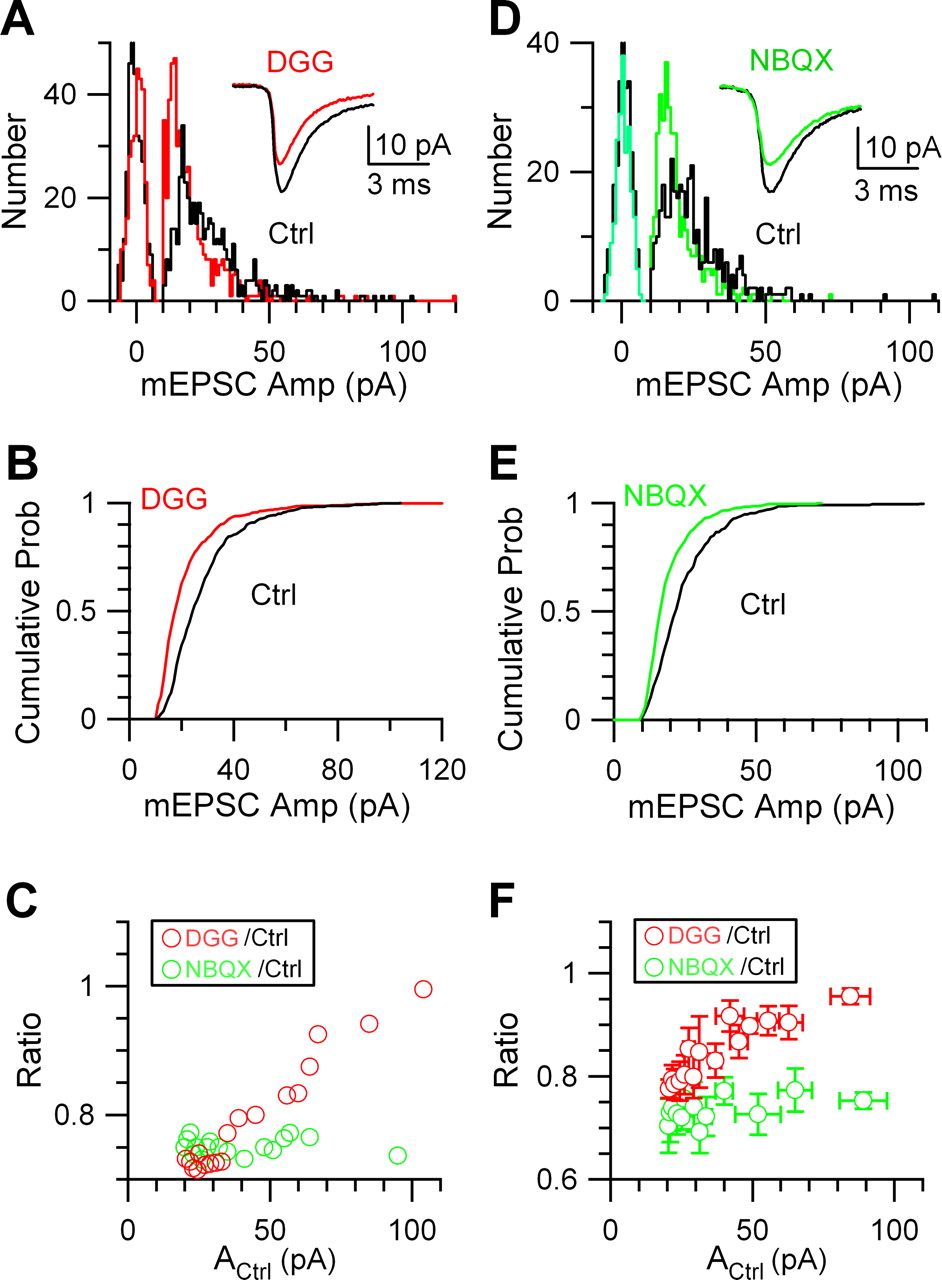
Application of γ-DGG decreases larger mEPSCs to lesser extents. A, B, The mEPSC amplitude distribution and cumulative probability curve before (Ctrl) (black) and during application of γ-DGG (red) (300 μm). The inset in A shows the mean mEPSC in control (n = 545 mEPSCs; mean amplitude, 27.9 ± 0.6 pA) (black) and in the presence of γ-DGG (n = 510 mEPSCs; mean amplitude, 21.3 ± 0.6 pA) (red). C, RDGG/Ctrl (red), calculated from B, is plotted as a function of the control mEPSC amplitude (ACtrl). For methods of calculation, see Figure 4D. To avoid the apparent changes in R attributable to mEPSCs that were above detection threshold (10 pA) in control but became subthreshold of detection in the presence of blockers (Fig. 5H), data with ACtrl < 20 pA were not included (applies to F). For comparison, RNBQX/Ctrl as calculated from E is also plotted. D, E, Similar to A and B, except that γ-DGG is replaced with NBQX (40 nm) (green). The inset in D shows the mean mEPSC in control (n = 361 mEPSCs; mean amplitude, 25.3 ± 0.6 pA) (black) and in the presence of NBQX (n = 363 mEPSCs; mean amplitude, 19.3 ± 0.4 pA) (green). F, Pooled data about RDGG/Ctrl (red) (5 synapses) and RNBQX/Ctrl (green) (3 synapses) as a function of the control mEPSC amplitude (ACtrl). The method of binning (5 values for one bin) is similar to that described in Figure 4E. Error bars indicate SEM.
At any given cumulative probability level (Fig. 4C, Y), the corresponding mEPSC amplitude in control (Fig. 4C, ACtrl) and that after glutamate dialysis (Fig. 4C, AGlu) could be found. RGlu/Ctrl, calculated as the ratio between AGlu and ACtrl (for methods, see Fig. 4D), decreased as ACtrl increased in 13 (Fig. 4D) of 16 synapses. When data from all 16 synapses were pooled, RGlu/Ctrl clearly decreased as ACtrl increased (for methods, see Fig. 4E), suggesting that glutamate dialysis enhanced larger mEPSCs by a smaller fraction.
As a control, we determined whether large and small mEPSCs are increased by the same fraction when the postsynaptic holding potential changed from −50 to −100 mV. Because of the increase in driving force, the mEPSC amplitude increased by 63 ± 5% (n = 3) (Fig. 5A). The mEPSC amplitude distribution (Fig. 5B) and cumulative probability curve (Fig. 5C) shifted to the right. Similar to calculation of RGlu/Ctrl, we calculated the ratio(R−100 mV/−50 mV) between the mEPSC amplitude at −100 and −50 mV. Clearly, R−100 mV/−50 mV did not decrease, but increased monotonically as the mEPSC amplitude at −50 mV (A−50 mV) increased (Fig. 5D,H).
As explained below, the apparent increase of R−100 mV/−50 mV (Fig. 5D,H) was attributable to mEPSCs that were below the threshold (10 pA) for detection at −50 mV, but became larger than the threshold at −100 mV. If this scenario is true, the maximum of R−100 mV/−50 mV should occur at the maximum of A−50 mV, at which R−100 mV/−50 mV should be minimally affected by the detection threshold. Indeed, the maximum of R−100 mV/−50 mV occurred at the maximum of A−50 mV (Fig. 5D,H). Its value was ∼1.8–1.9 (n = 3) (Fig. 5H), which was within the range (∼2) of the theoretically expected change, given that the reversal potential for AMPA receptors is in the vicinity of 0 mV (Bollmann et al., 1998). To mimic a change of the holding potential from −100 to −50 mV, we divided the mEPSC amplitude observed at −100 mV by the maximum of R−100 mV/−50 mV in each recorded neuron. Consequently, the distribution and the cumulative probability of the mEPSC amplitude (Fig. 5E,F, red) was shifted to the left (Fig. 5E,F, blue). To mimic our detection threshold of 10 pA, the left-shifted mEPSC amplitude distribution (Fig. 5E, blue) was further modified so that the number of mEPSCs <10 pA was 0 (Fig. 5E, green). With these modifications, we obtained the predicted cumulative probability curve (Fig. 5F, green) and thus the predicted R−100 mV/−50 mV (Fig. 5G, green) at various mEPSC amplitudes at −50 mV. These predictions (Fig. 5F–H, green) matched closely to the measured ones (Fig. 5F–H, black) (for a summary from three synapses, see Fig. 5H). Thus, the increase of R−100 mV/−50 mV at higher A−50 mV (Fig. 5G,H) was attributable to detection of mEPSCs at −100 mV, which were below the threshold of detection at −50 mV.
Results in Figure 5 indicate that the decrease of RGlu/Ctrl at higher ACtrl (Fig. 4E) was not caused by artifacts, such as larger voltage-clamp errors for larger mEPSCs, or detection of mEPSCs that were below the detection threshold before glutamate dialysis but above the threshold after glutamate dialysis. The decrease of RGlu/Ctrl at higher ACtrl (Fig. 4E) strongly argues against the hypothesis that larger postsynaptic receptor cluster size (or density) is the only source for larger mEPSCs, because this hypothesis predicts no change of RGlu/Ctrl at higher ACtrl. Thus, these results suggest that larger mEPSCs, or at least a significant fraction of larger mEPSCs, are caused by larger amounts of transmitter acting at postsynaptic receptors.
The above suggestion is based on an implicit assumption that glutamate dialysis increases the vesicular glutamate concentration uniformly. If larger mEPSCs are caused by larger postsynaptic receptor clusters, and if glutamate dialysis increases the vesicular glutamate concentration to a lesser extent for vesicles released to larger postsynaptic receptor clusters, RGlu/Ctrl would also decrease at higher ACtrl as shown in Figure 4. Although this possibility is unlikely because it requires cross talk between presynaptic vesicles and the postsynaptic receptor cluster, in principle we could not rule out this possibility. However, the second approach described below, which was independent of glutamate loading, could rule out this possibility.
Our second approach to determine the postsynaptic contribution to quantal size variation was to apply γ-d-glutamylglycine (γ-DGG), a competitive AMPA receptor blocker that blocks less at higher glutamate concentration (Liu et al., 1999). At 200–400 μm, γ-DGG in the bath reduced the mEPSC amplitude by 26 ± 2% (n = 5 synapses), and shifted both the mEPSC amplitude distribution and the cumulative probability curve to the left (Fig. 6A,B). Similar to glutamate dialysis, the ratio (RDGG/Ctrl) between the mEPSC amplitude in control (ACtrl) and that during γ-DGG application was calculated. RDGG/Ctrl increased as ACtrl increased (Fig. 6C) (for a summary of five synapses, see Fig. 6F). Thus, γ-DGG reduced larger mEPSCs by a smaller fraction.
As a control, we applied 1,2,3,4-tetrahydro-6-nitro-2,3-dioxo-benzo[f]quinoxaline-7-sulfonamide (NBQX) to the bath. NBQX is a noncompetitive AMPA receptor blocker, which blocks receptors at the same level regardless of the glutamate concentration (Liu et al., 1999). NBQX (20–60 nm) reduced the mEPSC amplitude by 28 ± 4% (n = 3), and shifted both the mEPSC amplitude distribution and cumulative probability curve (Fig. 6D,E) to the left. As expected, the ratio (RNBQX/Ctrl) between the mEPSC amplitude in control (ACtrl) and that during NBQX application did not increase as ACtrl increased (Fig. 6C) (for a summary of three synapses, see Fig. 6F).
The results shown in Figure 6 strongly argue against the hypothesis that the size or the density of the postsynaptic receptor cluster is the only source of quantal size variation, because this hypothesis predicts no change of RDGG/Ctrl as ACtrl increases. Together, the experiments with glutamate dialysis (Fig. 4) and γ-DGG application (Fig. 6) suggest that larger mEPSCs, or at least a significant fraction of larger mEPSCs, were caused by higher glutamate concentrations in the synaptic cleft (for additional controls, see supplemental material 7, available at www.jneurosci.org). It should be pointed out that neither glutamate dialysis (Fig. 4) nor γ-DGG application (Fig. 6) could rule out the possibility that the postsynaptic receptor cluster size (or density) partially contributes to quantal size variation.
Release-location mechanism is not the main source of quantal size variation
Higher glutamate concentrations experienced by postsynaptic receptors could be caused by either a larger amount of released transmitter or a shorter distance (distancefusion_receptor) between the fusion site and the center of the postsynaptic receptor cluster (Franks et al., 2003). We distinguished these two possibilities by performing simulations and experimentally testing the simulation results.
For simulation, we used the program MCell 2.50 (see Materials and Methods), which models the three-dimensional random walk diffusion and reaction kinetics in complex spatial environments reflecting realistic cellular ultrastructure (Stiles et al., 2000). The number of AMPA receptors being activated is plotted as a function of time after fusion (Fig. 7A), which mirrors the mEPSC time course and thus is taken as the simulated mEPSC. Simulation showed that as the distancefusion_receptor increased, the simulated mEPSC amplitude decreased, the 10–90% rise time increased, but the decay time course did not change significantly (Fig. 7A–C). For example, when the distancefusion_receptor changed from 0 (Fig. 7A,B, black) to 70 nm (Fig. 7A,B, green), the mEPSC amplitude, measured as the peak number of receptors being activated, decreased by 63%, and the 10–90% rise time increased by 50% (from 164 to 246 μs) (Fig. 7A–C). The 10–90% rise time decreased linearly as the simulated mEPSC amplitude increased (Fig. 7C). These simulation results were obtained with a specific set of parameters that produced an mEPSC similar to that observed at the calyx-type synapse (for detail, see Materials and Methods). Similar results were observed when a wide range of simulation parameters (see Materials and Methods) were varied (data not shown). In brief, if quantal size variation is caused only by variation in the distancefusion_receptor, it predicts an increase of the rise time as the mEPSC amplitude decreases (Fig. 7C).

The mEPSC amplitude variation is mainly not caused by release-location mechanism. A, The number of AMPA receptors being activated is plotted as a function of time, which mirrors the mEPSC time course. Nine traces were superimposed. Each trace was generated by simulation with a distancefusion_receptor of 0 nm (thick black), 50, 60, 65, 70 nm (thick green), 75, 80, 90, or 100 nm (thick red) (thin light blue if not specified). As the distancefusion_receptor increases, the peak amplitude decreases. B, Traces in A normalized to the same peak value, showing similar decay (left) but different rise (right) time. Color codes are the same as A. C, The 10–90% rise time plotted versus the peak amplitude from simulated traces in A (mEPSCs Amp), the latter of which was normalized to the maximum value. The data were fit with a linear regression line with a slope of −146 μs. D, The experimentally observed mean mEPSCs corresponding to 0–20% (red), 20–40, 40–60, 60–80% (green), 80–90, 90–95, 95–100% (black) in the cumulative probability curve from a synapse (light blue if not specified). Each trace was an average of 16–64 mEPSCs. The series resistance was compensated by 95%. E, Traces in D normalized to the same peak value (different time scales in left and right panels). Color codes are the same as D. F, The 10–90% rise time, measured from traces like those shown in D (n = 8 synapses), is plotted versus the mEPSC amplitude measured with (square) or without (triangle) series resistance compensation. Error bars indicate SEM.
To test this prediction, we recorded mEPSCs with or without the series resistance compensation (95%) at the same synapse (n = 8 synapses). The series resistance compensation helped to voltage clamp rapidly rising mEPSCs, but introduced large noise. As a result, mEPSCs <25 pA were more difficult to detect. Thus, we set our detection threshold at 25 pA when the series resistance was compensated by 95%. For comparison, we set the same threshold for mEPSCs recorded without series resistance compensation. The mEPSCs were divided into seven groups corresponding to 0–20, 20–40, 40–60, 60–80, 80–90, 90–95, and 95–100% in their cumulative probability curve (Fig. 7D,E). As expected, when series resistance compensation was made, the mEPSC rise time was faster (Fig. 7F) and the mean mEPSC was, on average, 26 ± 7% (n = 8) larger. Regardless of whether the series resistance was compensated or not, the 10–90% rise time did not increase as the mEPSC amplitude decreased (Fig. 7D,E) (summarized in Fig. 7F). Interestingly, the rise time decreased by ∼11 ± 4% when the mEPSC amplitude changed from the maximum (95–100% group) to 38 ± 4% of the maximum (0–20% group). The reason was unclear. Nevertheless, we did not observe an increase of the rise time as the mEPSC amplitude decreased (Fig. 7E,F). This was not attributable to an insufficient time resolution of our patch-clamp amplifier (for detail, see supplemental material 8, available at www.jneurosci.org). We concluded that the main source of mEPSC size variation was not the distancefusion_receptor, but the amount of released transmitter.
Changes in synaptic structure and surrounding neuropil may underlie developmental changes in the mEPSC time course, particularly the decay time (Cathala et al., 2005). Could such a mechanism contribute to the mEPSC size variation? It is unlikely because for mEPSCs recorded with series resistance compensation, the 20–80% decay time (∼1.51–1.66 ms) was not significantly different among seven groups of mEPSCs with different amplitudes (n = 8 synapses; ANOVA, p > 0.8) (Fig. 7D,E). Similar results were obtained for mEPSCs recorded without series resistance compensation (n = 8 synapses; ANOVA, p > 0.8).
Discussion
The origin of quantal size variation has been debated since the discovery of quantal synaptic transmission one-half of a century ago (Fatt and Katz, 1952). Today, it still remains poorly understood. The present study attempts to identify the main mechanism underlying quantal size variation at a glutamatergic calyx-type synapse in rat brainstem. Our results can be summarized by four points. First, the capacitance jump of a single vesicle fusion, which could be used to calculate the vesicle volume, was independent of the mEPSC amplitude measured simultaneously at the same synapse (Fig. 3; supplemental Fig. S4, available at www.jneurosci.org). Thus, vesicle volume is not the dominant source of mEPSC variation. Second, submillisecond endocytosis did not occur, and thus was not the dominant source of mEPSC variation. Third, larger mEPSCs were increased to a lesser extent by dialysis of glutamate into the nerve terminal (Fig. 4). Furthermore, larger mEPSCs were reduced to a lesser extent by γ-DGG, a competitive AMPA receptor blocker that blocks less at higher glutamate concentration (Fig. 6). These results suggest that larger mEPSCs, or at least a significant fraction of larger mEPSCs, are not attributable to a larger size or a higher density of postsynaptic receptor clusters, but rather result from higher glutamate concentrations experienced by postsynaptic receptors. Fourth, higher glutamate concentrations experienced by postsynaptic receptors were mainly not caused by a shorter distance between the release site and the postsynaptic receptor cluster, but by larger amounts of released transmitter (Fig. 7). In summary, different amplitudes of mEPSCs were mainly attributable to release of vesicles having similar volumes, but different glutamate amounts, suggesting that variation in [Glu]v is a main source of quantal size variation.
Although we suggest that [Glu]v is a major source of quantal size variation, we could not rule out a minor contribution from other sources, such as the variation in the postsynaptic receptor cluster size or density. Simulation suggests that a small fusion pore may release transmitter slowly (on the order of a few milliseconds), resulting in a small mEPSC with a slow rise (Klyachko and Jackson, 2002) and/or a slow decay (Pawlu et al., 2004; He et al., 2006). This mechanism is unlikely to play a significant role for two reasons. First, the 10–90% rise time of smaller mEPSCs was not slower than that of larger mEPSCs (Fig. 7D–F). Second, only ∼3% of spontaneous fusion events induced by high potassium application were found to have a small fusion pore at calyx-type synapses (He et al., 2006).
Koike-Tani et al. (2005) showed that postsynaptic receptors are composed of different subunits at different developmental stages. We could not fully exclude the possibility that some mEPSCs are mediated by different AMPA receptor subunits. However, it is unlikely that this possibility is the main mechanism underlying mEPSC variation, because it works only when each of the following three conditions holds. First, different postsynaptic receptors differ in their subunit composition even at the same developmental stage at the same postsynaptic neuron. Second, if different receptor subtypes in different receptor clusters are responsible for different amplitudes of mEPSCs, receptors that are responsible for larger mEPSCs should be more saturated than those for smaller mEPSCs. This requirement comes from results shown in Figure 4. Finally, receptors that are responsible for larger mEPSCs should be less sensitive to γ-DGG although they are more saturated by glutamate (second requirement). This requirement comes from results shown in Figure 6. Whether any of these three conditions exists at calyces is unclear.
Our suggestion that variation in [Glu]v is a main source of quantal size variation seems in conflict with the hypothesis that transmitter concentration is maintained at a predetermined level for each vesicle. However, our results were obtained at a mammalian central synapse, whereas the hypothesis that every vesicle contains the same transmitter concentration was supported by studies at nonmammalian synapses or endocrine cells (Zhang et al., 1998; Bruns et al., 2000; Colliver et al., 2000; Pothos et al., 2000; Karunanithi et al., 2002; Daniels et al., 2004). Synapse specificity and species differences may thus offer an alternative explanation to the apparent controversy.
Our results are consistent with the hypothesis that [Glu]v can be regulated to different levels. At calyces, glutamate dialysis increases the mEPSC (Ishikawa et al., 2002; Yamashita et al., 2003), suggesting that [Glu]v can be upregulated. At other nerve terminals, overexpression or knock-out of vesicular transporters increases or decreases quantal size (Song et al., 1997; Wojcik et al., 2004; Wilson et al., 2005). The change in quantal size is presumably caused by changes in the vesicular transmitter concentration, although vesicle volume was not measured to ascertain the conclusion. Vesicle volume increased in parallel with the increase of quantal size when vesicular transporters were overexpressed in glutamatergic neuromuscular junctions of Drosophila and in secretory cells containing catecholaminergic dense-core vesicles (Colliver et al., 2000; Pothos et al., 2000; Daniels et al., 2004). These results cast doubt on whether overexpression or knock-out of vesicular transporters leads to regulation of vesicular transmitter concentration (Sulzer and Edwards, 2000). Our finding that different vesicles may contain different concentrations of glutamate provides additional support to the hypothesis that vesicular glutamate concentration can be regulated in mammalian central synapses.
The present work raises the question on how different glutamate concentrations are established in different vesicles. The answer is unclear. The differences in the number of glutamate transporters and types of transporters could provide an explanation (Fremeau et al., 2004; Wojcik et al., 2004; Wilson et al., 2005). For example, assume that the number of transporter molecules in a vesicle is random (regardless of the vesicle volume) and each transporter molecule is responsible for uptake of a fixed amount of glutamate. The amount of glutamate in the vesicle would be independent of vesicle volume, and the glutamate concentration in larger vesicles would be lower than that in smaller vesicles. This scenario could explain our result that the mEPSC amplitude was independent of the vesicle volume and that different vesicles may contain different concentrations of glutamate.
Different vesicles in the readily releasable pool are suggested to have different release probability (Schneggenburger et al., 2002). The present work further extended the vesicle heterogeneity issue by showing that different vesicles may contain different concentrations of transmitter. The heterogeneity in transmitter content could be critical in determining whether postsynaptic neurons can fire an action potential when individual quantal responses are near the threshold to generate an action potential (Carter and Regehr, 2002; Otsu and Murphy, 2003). Spontaneous quantal response has been shown to be required for several physiological functions, such as maturation and stability of synaptic networks, and inhibition of local dendritic protein synthesis (McKinney et al., 1999; Verhage et al., 2000; Sutton et al., 2004; Wilson et al., 2005). These physiological functions may thus depend on an adequate vesicular transmitter concentration. If there is a mechanism to preferentially release vesicles with higher or lower glutamate concentrations, heterogeneity of vesicular glutamate concentration may provide a mechanism to regulate synaptic strength.
Footnotes
-
This work was supported by the National Institute of Neurological Disorders and Stroke Intramural Research Program. We thank Drs. Jeff Diamond, Ken A. Pelkey, and Jianhua Xu for comments on this manuscript.
- Correspondence should be addressed to Ling-Gang Wu, National Institute of Neurological Disorders and Stroke–National Institutes of Health, 35 Convent Drive, Building 35, Room 2B-1012, Bethesda, MD 20892. wul{at}ninds.nih.gov


