

Abstract
In the present study, we investigated how directional tuning of putative pyramidal cells is sharpened by inhibition from neighboring interneurons. First, different functional and electrophysiological criteria were used to identify putative pyramidal and interneuronal subtypes in a large database of motor cortical cells recorded during performance of the three-dimensional center-out task. Then we analyzed the relationship between the magnitude of inhibition and the tuning width, and a significant decrease of the latter as a function of the former was found in a population of putative pyramidal cells. In fact, the coupling of inhibition with narrow tuning was observed before and during movement execution on a cell-by-cell basis, indicating an important dynamic role of inhibition during movement control. Overall, these results suggest that local inhibition is involved in sculpting the directional specificity of a group of putative pyramidal neurons in the motor cortex.
Introduction
Numerous studies have reported that sensory, motor, and cognitive information can be represented in the CNS by neurons that are tuned to distinct behavioral parameters. This is the case for the coding of movement direction in the primary motor cortex (M1), where the cells show an orderly variation in activity as a function of the movement direction, with a peak of activity in their preferred direction (PD) (Georgopoulos et al., 1982). Despite the discussion on its corresponding reference frame (internal or external) (Kakei et al., 1999; Georgopoulos et al., 2007a), directional tuning in M1 has a columnar and short-scale organization (Amirikian and Georgopoulos, 2003; Georgopoulos et al., 2007b), as well as a large-scale organization where the complete distribution of PD is represented multiple times (Naselaris et al., 2006b). Nevertheless, little is known about how the interactions between motor cortical cells lead to directional tuning inside the columnar arrays.
It has been demonstrated that pyramidal cell tuning in the visual and auditory systems depends on a balance of thalamocortical excitatory inputs and local circuit inhibition (Wehr and Zador, 2003; Ma and Suga, 2004). For example, in the visual cortex (V1), narrow orientation tuning is generated by both an enhancement near the preferred orientation caused by specific inputs from the LGN and corticocortical amplification, and by global suppression supplied by cortical inhibition (Ferster and Miller, 2000; Shapley et al., 2003). Hence, the relevant question here is how the directional tuning in M1 depends on local inhibition and corticocortical excitation. To address this problem, we used a strategy developed recently to study how inhibition impacts cortical circuit processing in the behaving animal (Constantinidis and Goldman-Rakic, 2002). This strategy includes, the anatomical identification of recording sites using multielectrode arrays (Blanche et al., 2005; Naselaris et al., 2005), and the use of functional and extracellular features of cells to discriminate between putative pyramidal and interneuron subtypes. Although the latter is an indirect method to identify excitatory and inhibitory cell subtypes, it has been validated in many instances (Barthó et al., 2004; Krimer et al., 2005). Using this approach, we specifically tested the role of inhibition on the sharpness of directional tuning of putative pyramidal cells, as well as the possible interactions between putative pyramidal and interneuronal cells that may define the directional tuning curves in M1. These interactions were measured in time, analyzing the development of directional tuning with respect to movement initiation.
Materials and Methods
Animals
Experiments were performed in two monkeys (Macaca mulatta, one male and one female, 8 and 7 kg of body weight, respectively). Animal care conformed to the principles outlined in the National Institutes of Health Guide for Care and Use of Laboratory Animals (publication number 85-23, revised 1985). The experimental protocol was approved by the Institutional Review Board.
Mapping procedure
All recordings were obtained from the arm region of the M1. The recorded area was within a region that extended 3–4 mm along the central sulcus, and 7–12 mm in the direction perpendicular to the central sulcus. This region was centered ∼15 mm from the midline along the medial–lateral axis. Microstimulation (3 ms biphasic pulses for 30 ms at 5–20 μA) within the boundaries of this region evoked contractions of mostly proximal arm muscles.
The techniques used to construct a map of recording sites have been described in detail previously (Naselaris et al., 2005). Briefly, an array of 16 electrodes was passed through the arm region of M1 while monkeys engaged in the reaching task. Before insertion, electrodes were coated in a fluorescent dye. Once the top of the cortex was identified, electrodes were advanced at 150 μm increments until they reached white matter. Raw extracellular potentials were recorded at each site with a sampling frequency of 60 kHz, and high-pass filtered at 0.5 kHz.
After the experiment, the monkey was killed, and the recorded area of the cortex was blocked and sectioned every 50 μm. Registered digital fluorescence and Nissl-stained images of each slice were used to reconstruct the trajectories made by the electrodes passing through the cortex.
Electrode penetrations passed from the exposed surface of the precentral gyrus, through the crown, and into the anterior bank of the central sulcus (CS). Recording sites were transformed into a “flattened” coordinate system that had the effect of unfolding the cortical surface about the crown of the CS. In all of the maps to be presented, the top/bottom borders of the map are orthogonal to the CS, with the fundus of the CS located on the far left. The left/right borders of the maps are parallel to the CS, with the most medial positions at the top of the maps. In these surface maps, recording sites are projected to the surface along the line defined by neighboring anatomical columns, as revealed by inspection of Nissl-stained sections.
Neural recordings
The electrical activity of single neurons was recorded extracellularly, and spike discrimination was performed using the Plexon off-line sorting software (Plexon). This software uses clustering analysis of the first two principal components of the shapes of action potentials surpassing a threshold (>50 μv). Cells were included in the analysis if they were recorded for at least four task repetitions and had a mean firing rate larger than 0.6 impulses/s during the task. A total of 1618 neurons fulfilled these criteria.
Behavioral task
All neural data used in these studies were collected while monkeys worked on the three-dimensional (3D) center-out task developed by Schwartz et al. (1988). Monkeys reached using the left hand toward eight targets located near the corners of a cube. All movements were made from the same starting position, located at the center of the cube, which was level with the shoulder of the monkey's reaching arm. Between five and eight experimental trials in each of the movement directions were available for each cell recorded. Each trial consisted of two separate intervals: a reaction time (RT) interval, which occurred between the onset of the cue and the movement, and a movement time (MT) interval, which occurred between the onset of movement and the achievement of the target. The sum of these two intervals gives the total experimental time (TET): TET = RT + MT. In addition, the control period was defined as the last 500 ms before the onset of the target cue, when the animals held the arm in a stable posture.
Data analysis
Spike classification.
To identify a GABAergic interneuron definitively, it is necessary to record intracellularly, label the neuron, and examine its morphological and cytochemical properties. Of course, this procedure is very difficult to follow in the behaving monkey. However, if some degree of identification error can be tolerated, there is considerable evidence that one class of inhibitory interneurons, the “fast-spiking” variety, can be identified with some confidence using extracellular methods (Swadlow, 2003). The action potential duration in this type of cortical inhibitory interneurons is considerably shorter than in pyramidal cells, as revealed by intracellular recordings in the slice preparation (McCormick et al., 1985). Putative inhibitory interneurons and pyramidal cells were first described as fast- and regular-spiking neurons in the behaving monkey by Mountcastle et al. (1969). Recently, the width of the action potential and the basal firing rate have been used to discriminate reliably between interneurons and pyramidal cells in the somatosensory (Barthó et al., 2004) and prefrontal cortex (Constantinidis and Goldman-Rakic, 2002; Constantinidis et al., 2002) and the hippocampus (Csicsvari et al., 1998). Nevertheless, it has been shown that other types of GABAergic interneurons do not show the electrophysiological signatures of the fast-spiking population (i.e., short action potentials and high basal firing rates) (Kawaguchi and Kubota, 1993). Then, other functional parameters have been used to increase the discrimination power between the putative inhibitory interneurons and pyramidal subtypes, including antidromic identification, cross-correlograms, and spike-triggered average (STA) (Swadlow, 2003, Barthó et al., 2004). Consequently, in the present study, we used K-means cluster analyses to find out which measures of the action potential and the spike train would be most effective in separating the motor cortical cells into putative pyramidal and interneurons. The following variables were rank ordered with respect to their effectiveness in separating the groups based on the F test of the cluster analysis (SPSS statistical package, version 12). (1) The spike width was used as a variable concerning the shape of the action potential. We computed the spike width as the time between the two troughs from the mean action potential waveform (see Fig. 1A). In some cases, the initial trough was not present, and then we took in its place the first deflection from the baseline (Constantinidis and Goldman-Rakic, 2002). (2) The mean discharge rate during the control period, 500 ms before target presentation, was used. (3) The STA was computed as the average spike frequency histogram of the triggered cell with respect to the spikes of the triggering neuron (Fig. 1B). The average was taken 20 ms before to 20 ms after the occurrence of a spike in the triggering cell. A brief, short-latency postspike excitation or suppression in this average was taken as a monosynaptic relationship between the cells as follows: (1) a suppression occurring 1–5 ms in the STA was considered an inhibition (see Fig. 1B, top); (2) a peak in the average occurring 1–5 ms was considered an excitation (see Fig. 1B, bottom); (3) a peak in the STA at time 0 was considered a synchronization between cells with a common input. We called a peak significant if a bin in the STA during the 0–5 ms period was larger than the mean + 3 SD of the STA during the epoch of −20 to −10 ms and 10–20 ms. Accordingly, a suppression was significant if the bin in the STA was smaller than the mean − 3 SD during the same epoch. The results showed 143 neurons with excitatory and 56 neurons with inhibitory effects on the triggered cells, and were associated with putative pyramidal cells and interneurons, respectively.
Initial cluster analyses, using the above variables, revealed two important facts. First, the clustering was more effective for three [one putative interneuron (PI) and two putative pyramidal (PP) cell types] rather than two cell groups. Second, the three variables showed significant clustering effects. However, the spike width and the basal firing rate were the most important clustering variables (F test) (Table 1). The STA, which is a functional correlate for putative excitatory and inhibitory neurons, had significant but relatively small impact on the clustering analysis. This was because of the small sample of neurons with simultaneous recordings and significant effects on the STA.
ANOVA table of the cluster analysis evaluating the effectiveness of each variable in separating the groups
Table 2 shows the mean and SD values for the clustering variables of the three cell types. The PI group showed action potentials with short duration and high firing rates. In contrast, the PP1 cell type was characterized by action potentials with long widths and low firing rates. Thus, these two groups correspond to the interneurons and pyramidal cell types reported previously in the prefrontal and somatosensory cortexes as fast- and regular-spiking cortical neurons (Mountcastle et al., 1969; Constantinidis and Goldman-Rakic, 2002; Swadlow, 2003). In addition, we found another type of putative pyramidal cell (PP2) that showed very high firing rates and presented action potentials with widths ranging from 600 to 800 μs. This second type of PP cell is probably unique for M1, and it was observed more commonly in layer 5 (see Fig. 11).
Group means and SEM of the variables used for classification
In relation to the STA analysis, only eight neurons (8 of 56, 14.3%) that were identified as inhibitory in the STA also showed wide action potentials and were clustered as PP2. However, none of the excitatory cells in the STA were classified as PI. These results are in accordance with those of Barthó et al. (2004), who found a small group of PI (identified through functional connectivity) with wide action potentials. Nevertheless, the eight neurons with inhibitory STAs were reclassified as PIs.
Calculation of PDs.
A Gaussian function was used to compute the PD and the dispersion of the directional response profiles of the cells. The average firing rate during the period spanning 600 ms, 300 ms before to 300 ms after the beginning of the MT, was obtained for each reach. These rates were treated as independent variables in a nonlinear regression relating the direction of reach to the firing rate with the following Gaussian function:
 where f(s) is the average firing rate associated to a particular movement direction s, s is the direction vector of the movement in 3D, h is the parameter of maximum height, and κ the parameter of dispersion. ‖s, sp‖ is the Euclidean distance between s and sp that corresponds to the preferred direction. Therefore, in Cartesian coordinates, s = {(x,y,z)|(x,y,z) ∈ R3 and x2 + y2 + z2 = 1} and in Polar coordinates, (x,y,z) = (sinθcosφ,sinθsinφ,cosθ) with θ ∈ [0,π] and φ ∈ [0,2π].
This function was fitted using the least squares method following a gradient decent algorithm (Nocedal and Wright, 1999) implemented in Matlab (version 7.3.0.267; MathWorks). A detailed analysis of the residuals was performed (Draper and Smith, 1981) and the R2 calculated. Furthermore, the significant level of the R2 was assessed using a bootstrap technique as follows. First, the firing rate of the 40 total trials collected (5 repetitions × 8 directions) was permuted to get eight random mean firing rates. Second, a curve was fitted to these data, and the R2 was computed. This procedure was repeated 1000 times, and the distribution of R2 values saved. Finally, if the R2 of the original regression was larger than the value at 0.9 of the bootstrap R2 distribution, the regression was considered significant (see Fig. 3C).
Tuning dispersion measure.
We used the half-width dispersion, κ50, at the midpoint of the tuning magnitude as the consistent measure of tuning dispersion. The corresponding equation was as follows:

Anti-PD.
The anti-PD or direction 180° apart from the PD was computed from the Gaussian distribution as follows:

Response latency analysis.
The onset time of increase in cell activity was computed using a maximum likelihood method (Friedman and Priebe, 1998). Briefly, we derived maximum likelihood estimators for the response latency by assuming that the spontaneous activity from stimulus onset (t = 0) to the onset latency time (t = ρ) has a Poisson distribution λ1, and the response activity from latency (t = ρ) to cutoff (t = γ) has a Poisson distribution λ2. The cutoff γ is a nuisance parameter. Our goal is to estimate ρ in the presence of the nuisance parameter γ and under the assumptions that λ2 > λ1 and 0 < ρ < γ. For that purpose, first, the mean cumulative spike density function (SDF) aligned to the target onset was computed. Then, the cumulative SDF was segmented into two parts, the first section extending from the time of stimulus onset to the candidate segmentation point ρ̂′γ̂′, and a second segment from ρ̂′γ̂′ to the candidate cutoff γ̂′. Least-squares fits for each segment resulted in an estimated slope and intercept for each line segment. The estimated latency ρ̂′γ̂′ corresponded to the candidate segmentation point which maximized the difference in the slopes of the two segments across all possible combinations of ρ̂′γ̂′ and γ̂′. The range of γ̂′ tested went from 30 ms after the target onset to 500 ms after the peak of neural activation, which, in turn, was defined as the time of maximum activity during the task period that surpassed the mean (+3 SD) discharge rate of the control period.
Results
Cell types
The first step in this study was to identify different subgroups of putative pyramidal and interneuronal cells to determine not only their tuning properties, but also to investigate the role of inhibition in shaping the directional specificity of the putative pyramidal cells in M1. Accordingly, cluster analyses were used to separate a total of 1618 recorded neurons during the center-out task into putative pyramidal and interneuronal groups. For that purpose, we used the action potential width and the spontaneous discharge rate, parameters that have been used successfully before to discriminate between these neuronal subtypes (Constantinidis et al., 2002; Barthó et al., 2004), although some degree of classification error can occur with this approach (Kawaguchi and Kubota, 1993; Swadlow, 2003). Therefore, we also used the short latency (<4 ms) negative or positive deflection in the STA between pairs of cells as a functional correlate of monosynaptic inhibition or excitation (Fig. 1B) in the clustering. Overall, these analyses showed that our data set was best characterized by three neural cell types: the previously reported (Mountcastle et al., 1969) fast-spiking cell (PI) and regular-spiking pyramidal cell (PP1), and another type of pyramidal cell (PP2) with high firing rates but long action potential widths (Fig. 1A). This second type of pyramidal cell is probably unique for M1, and it was observed more commonly in layer 5 (see Fig. 11). In this way, 412 (25.5%) of the neurons were classified as PI, 928 (57.3%) as PP1, and 278 (17.2%) as PP2.

Cell type properties. A, Typical examples of the action potential shape (left), spontaneous activity (center), and normalized average discharge rate (NRA; right) for tuned neurons for the PI, PP1, and PP2 cell types. The red crosses in the panels on the left represent the times of beginning and end of the action potential. The action potential width and the discharge rate of the neurons during the control period are given at the top. In the NRA, the activity was sorted in descending order using the discharge rate during TET for each movement direction and then plotted in the order specified on the center right panel (d1, d2…, d8); the activity was aligned to movement onset (vertical line; M), and the black horizontal line represents the SD of the appearance of the target centered on the mean value. B, Examples of monosynaptic inhibition (top) and excitation (bottom) using STA analysis. STA (left) showing the number of spikes of the triggered cell as a function of the lag with respect to the triggering cell (PI, top; PP1, bottom) is shown. The mean ± SD of the action potential shape for the triggering and trigged cells are show in the center and right panels, respectively. The numbers on the top right of each panel are the widths of the action potentials.
Basic tuning and response properties
Once we had developed a robust method for discriminating between different cell types, we studied the tuning properties of the putative pyramidal and interneuronal subgroups. Figure 1A (left) shows the activation profile for the three cell types in the population of neurons significantly tuned according to the standard multiple linear regression (Georgopoulos et al., 1986). Overall, 187 (45.4%) PI, 366 (39.4%) PP1, and 144 (51.7%) PP2 neurons were tuned using this method. It is evident that the tuning properties of neurons changed over time in a different manner for the three cell types.
Conventional cosine functions do not give information about the width of the directional tuning, because they have a fixed half-width. Therefore, we fitted a Gaussian function to the discharge rate of neurons to get information not only about the PD of the cells, but also about the width or dispersion of the tuning curve across cell types (Fig. 2). Tuning dispersion is a fundamental parameter of the present study, because an inhibitory mechanism may influence cell tuning through this functional property. The results showed that the nonlinear fitting of the Gaussian function was quite successful (Fig. 3C). In addition, the distribution of PDs for the three cell types was very similar (Fig. 4). In contrast, the half-width dispersion of the tuning profile was different (Fig. 3A). The distribution of tuning dispersion in the PI and PP1 showed a gradual increase toward high dispersion values, with PP1 more skewed toward low dispersion. This result suggested, indirectly, a functional relationship between these two types of cells (Fig. 3B). Quite the opposite, the dispersion distribution of PP2 was not skewed and showed a normal profile with a mean of 80.5°. PP2 neurons, then, were uniformly broadly tuned, with responses that were less directionally specific than the other two cell types as depicted in Figure 3B.

Theoretical Gaussian tuning curves of cells that show inhibition (left) or no inhibition (right) in their anti-PD. The discharge rate in the anti-PD of the neuron on the left is lower than its spontaneous activity (SA), depicted as a black line and a gray arrow. The black dashed line illustrates the half-width dispersion.

A, Distribution of tuning dispersion for each cell type. B, Cumulative distribution of tuning dispersion. C, Cumulative distribution of the R2 value of the Gaussian function fitting for each cell type. Dotted line, PI; dashed line, PP1; black line, PP2.

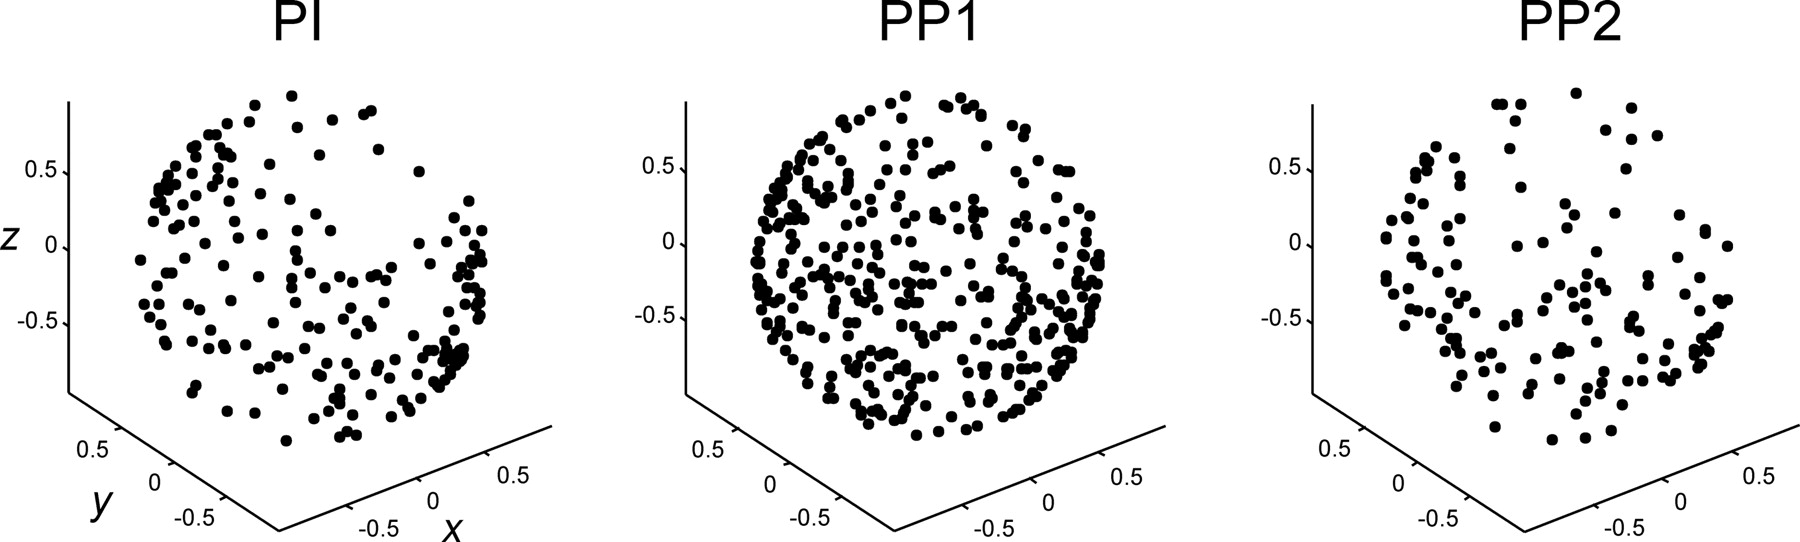
Preferred directions of neurons corresponding to the three cell types.
The functional impact of inhibition on the directional tuning of pyramidal cells should be linked in time to the activity of interneurons, with the latter preceding the inhibitory effects on pyramidal responses. Indeed, an analysis of onset response latencies showed that despite the large overlap in the onset response distributions, overall the PI activity occurred before PP1 directional responses (Fig. 5, dashed line). In contrast, the response onset of PP2 was short and very similar to the one observed for PI (Fig. 5, black line and dotted lines, respectively). The onset response analysis is an indirect measure of functional relationships between cell types. However, these results suggest a potential functional link between PI and PP1 and an independence of PP2 tuning from PI inhibition. Below we show how this interaction could sculpt the tuning profile of a group of putative pyramidal cells.

Mean onset response latency for neurons of the three types sorted in ascending order using the magnitude of discharge rate (Max Dir). Dotted line, PI; dashed line, PP1; black line, PP2.
Pyramidal cell inhibition and directional tuning
A tuning curve is characterized by a PD, a width or dispersion, and a height. Relevant to our problem is the discharge rate of the neurons in their PD and anti-PD (180° from the PD). We assumed that when the discharge rate of the neuron in the anti-PD was larger than its spontaneous activity, a net excitation for all directions occurred. On the contrary, when the anti-PD discharge rate was lower than the spontaneous activity of the cell, we assumed that inhibition was involved in sculpting the tuning curve (see Fig. 2). Interestingly, we found a group of PP1 cells that showed a decrease in discharge rate in the anti-PD with respect to the control period. The plots in Figure 6 show the spontaneous firing rate (the activity during the control period) on the vertical axis and the discharge rate at the anti-PD on the horizontal axis. The diagonal line is where cells would be plotted for which the anti-PD spike rate is the same as the spontaneous activity. Thus, cells plotted above and to the left of this line were those for which the anti-PD direction movement caused net suppression, because the anti-PD discharge rate was less than the spontaneous activity. One hundred and twenty four PP1 neurons lay in this area, suggesting that cortical inhibition in directional tuning curves was quite prevalent in PP1 cells. Importantly, the inhibition in most of these cells was accompanied by small tuning dispersion (Fig. 6, filled circles, <65°). Thus, to directly test the relationship between inhibition and tuning dispersion, we first computed an inhibition index [II = log10(discharge rate during control/anti-PD)] and then plot it against tuning dispersion.

Scatter plots of the spontaneous (control period) discharge rate against the activity in the anti-PD direction, with the tuning dispersion indicated as the size of the point depicted. Cells with dispersion tuning <65° were plotted as filled circles, whereas cells with dispersions >65° were plotted as open circles. The left and right parts of the figure are for PP1 and PP2 cells, respectively.
The results for PP1 cells, shown in Figure 7, revealed that the II falls off with tuning dispersion after a power function decent: IIPP1 = 10,990DisPP1−2.18 (R2 = 0.189, p < 10−16), where IIPP1 and DisPP1 are the II and tuning dispersion for the PP1 cells, respectively. These results suggest that there is a strong relationship between the degree of anti-PD inhibition and the sharpening of directional tuning is a subpopulation of PP1 cells, in such a way that for tuning dispersions below ∼55°, inhibition may play a major role of sculpting the directional specificity on motor cortical cells.

Inhibition index plotted as a function of tuning dispersion. The inhibition index fall with dispersion for PP1 cells but remained similar for the PP2 cells. Dotted line indicates an inhibition index = 0. The left and right parts of the figure are for PP1 and PP2 cells, respectively.
In contrast, Figure 7 (right) shows that PP2 neurons were not subjected to an inhibition in their anti-PD. Practically all PP2 neurons lay along the diagonal line (Fig. 6, right), and the II showed low values and no relationship with the tuning dispersion (Fig. 7, right). We conclude that the broad tuning curves of PP2 cells were mainly caused by excitatory inputs and, therefore, no inhibition was involved in shaping the directional tuning of this population of neurons.
Dynamics of PD shaping
To study the dynamic aspects of the PD sculpting on a cell-by-cell basis, we fitted Gaussian functions on the neural responses across a sliding window of 150 ms, every 20 ms, aligned with respect to the movement onset. Then, the II and tuning dispersion were computed on these fittings, and a clear relationship between the increase of II above ∼2 and the decrease in tuning dispersion was found over time on the 124 PP1 neurons with an overall positive II. For example, Figure 8A shows a PP1 cell with a sharp increase in II (filled circles, continuous line) that lasted from 150 to 70 ms before movement onset and that was accompanied by a decrease in tuning dispersion (open circles, dashed line). Figure 8B shows the tuning functions of the three time windows, marked with asterisks in A, and it is clear that the second function has a decrease in the half-width dispersion (dashed line ellipse) coupled with a II of 39.4. Other six cell examples are depicted in Figure 9. Thus, based on individual cell analysis, the following three main functional principles can be outlined. First, there is a tight time relationship between the increase in II and the decrease in tuning dispersion. Second, the magnitude in II is correlated with tuning specificity. Third, the tuning sharpening onset and duration varies across cells, but is most prevalent around movement onset.

A, The tuning dispersion in degrees (open circles, dashed line) and II (filled circles, continuous line) plotted as a function of the time window. The right and left ordinate scales correspond to dispersion and II, respectively. The analysis was centered on the movement onset. The transparent gray box depicts the II values between −1 and 1 as a reference. B, Tuning functions of the three time windows marked with asterisks in A. The dotted line ellipse corresponds to the half-width dispersion, the abscissa corresponds to the angle θ, the ordinate to the angle φ (Fig. 1A) (Naselaris et al., 2006a), and the firing rate is represented in a gray scale. The decrease in tuning dispersion in the intermediate tuning function is associated with an increase in the II shown in A.
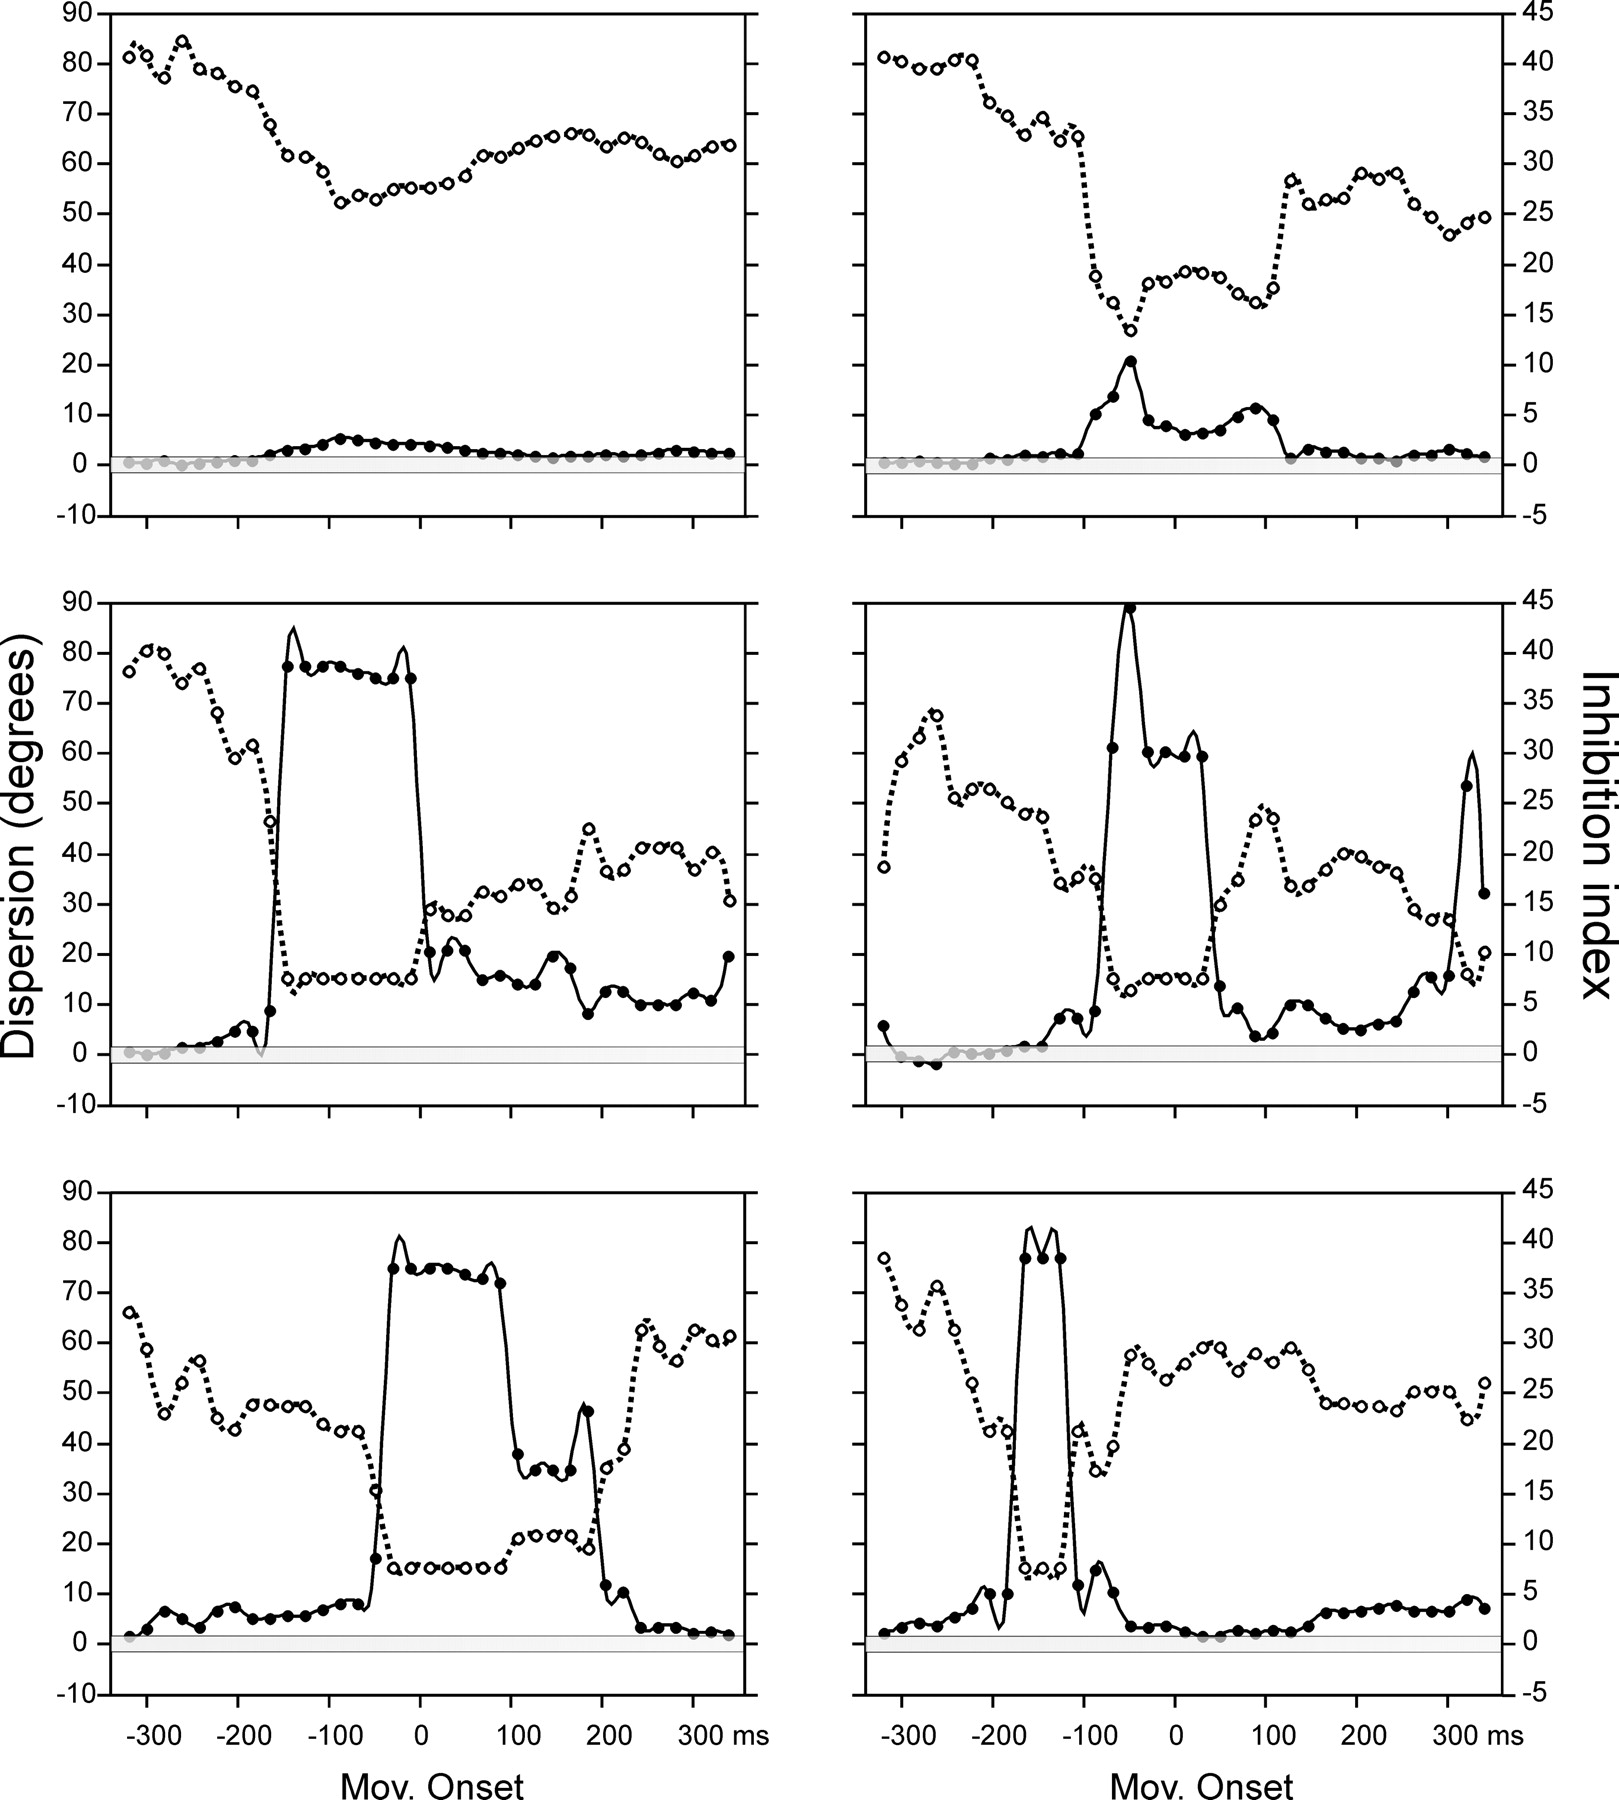
Tuning dispersion and II as a function of time window for six PP1 cells. The same conventions as in Figure 8A are used. Mov, Movement.
It could be suggested that the decrease in anti-PD activity is caused by disfacilitation instead of active inhibition. However, this alternative explanation is not very likely because the results show an organized and close temporal relationship between the increase in II and the decrease in tuning dispersion.
Finally, Figure 10 shows the interquartile box plots of the time course of II (middle) and tuning dispersion (top) for the 124 PP1 cells before and after movement onset, as well as the discharge rate (bottom) for the cell population of 187 PI cells with a significant directional tuning. It is evident that the II increased and the tuning dispersion decreased ∼160 ms before movement and that these changes were maintained after ∼120 ms of movement execution. Hence, a subpopulation of PP1 cells was subjected to a dynamic process of activity suppression and an associated reduction in tuning dispersion during the most relevant time period for movement control. Interestingly, the increase in II was also accompanied by the increase in activity of the PI cells suggesting, indirectly, that the inhibitory input from local interneurons produced a decrease in tuning dispersion on the referred PPI subpopulation.

Dynamic coupling between the decrease in tuning dispersion (top) and the increase in the inhibition index (middle) for the PP1 cells (n = 124) with an overall positive inhibition index, and the increase in discharge rate on the preferred direction (bottom) of the PI cells (n = 187) with significant directional tuning. Box plots for each sliding window where the white bar corresponds to the median of the distribution and the top and bottom of the box correspond to the 75th and 25th percentiles, respectively. The analysis was centered on the movement onset, and the two vertical lines signal the approximate beginning and end of the effects on the three measures.
Discussion
Our present results enrich our view of the anatomofunctional organization of directional tuning in M1. Overall, we found two classes of putative pyramidal cells and a group of putative interneurons. The difference between the putative pyramidal cells subgroups was in tuning dispersion: one group was broadly tuned, whereas the other showed a gradation of tuning curve widths. More importantly, the results also support the notion of dynamical sculpting of tuning curves in the second group of putative pyramidal neurons. The increase in directional specificity in these cells could be accomplished by inhibition that is probably provided by local interneurons.
The dynamics observed in PP1 cells showed an increase of inhibition coupled to a decrease in tuning dispersion. Similar dynamic effects between excitation and inhibition have been reported in simple V1 cells using inverse correlation methods (Ringach et al., 1997; Shapley et al., 2003). In fact, orientation tuning in neurons from the output layers of V1 is subjected to global (untuned) or to tuned inhibition. In the former (occurring earlier), the local inhibition suppresses all responses far from the preferred orientation, whereas in the later there is an activity decrease below the spontaneous response of the cell in orientations that are close to the preferred orientation. Thus, tuned suppression accounts for the dynamical reduction of orientation bandwidth and for the generation of “Mexican hat” tuning profiles (Ringach et al., 2003). In light of this evidence, it is conceivable that the decrease in tuning dispersion in the PP1 neurons of M1 is attributable to global and, particularly, to tuned local suppression, because the activity of neurons is below spontaneous activity in the anti-PD. Consequently, the selectivity in directional response increased as a function of the suppression strength as shown in Figure 7. It is important to emphasize that the dynamic coupling between inhibition and tuning specificity was observed on a cell-by-cell basis. The magnitude and time span of this effect varied across PP1 cells (Fig. 9), with an overall increase in II and decrease in tuning dispersion spanning from 160 ms before to 120 ms after movement onset that was accompanied by an increase in discharge rate on the neighboring putative interneurons (Fig. 10). These results suggest that tuning sculpting by inhibitory mechanisms may play an important role on directional information processing during the preparation and execution of reaching movements.
Another line of evidence in support of the local shaping of PDs in M1 comes from electrophysiological studies that described the impact of recurrent collaterals of pyramidal axons and the associated interneurons on the inhibition of motor cortical pyramidal neurons (Stefanis and Jasper, 1964a,b). Specifically, Stefanis and Jasper (1964a,b) recorded the motor cortical EPSPs and IPSPs elicited by electrical stimulation of the pyramidal tract and described the existence of strong recurrent inhibition probably mediated by local interneurons that were driven by the pyramidal collaterals. These findings strengthened the idea that the recurrent collateral inhibition plays a fundamental role in the spatial sharpening of the focus of excitation in M1 (Georgopoulos and Stefanis, 2007). Nevertheless, the present results suggest that only a subgroup of motor cortical cells were subjected to sharpening inhibition. These PP1 neurons were distributed across all cortical layers, in contrast to PP2 that were mainly localized in layers 5–6 (Fig. 11). Then, an interesting and unresolved question is why the local circuits in M1 favor sharpening in a subgroup of tuned cells distributed across layers, whereas another group of cells in the output layers may owe their directional tuning exclusively to excitatory inputs.
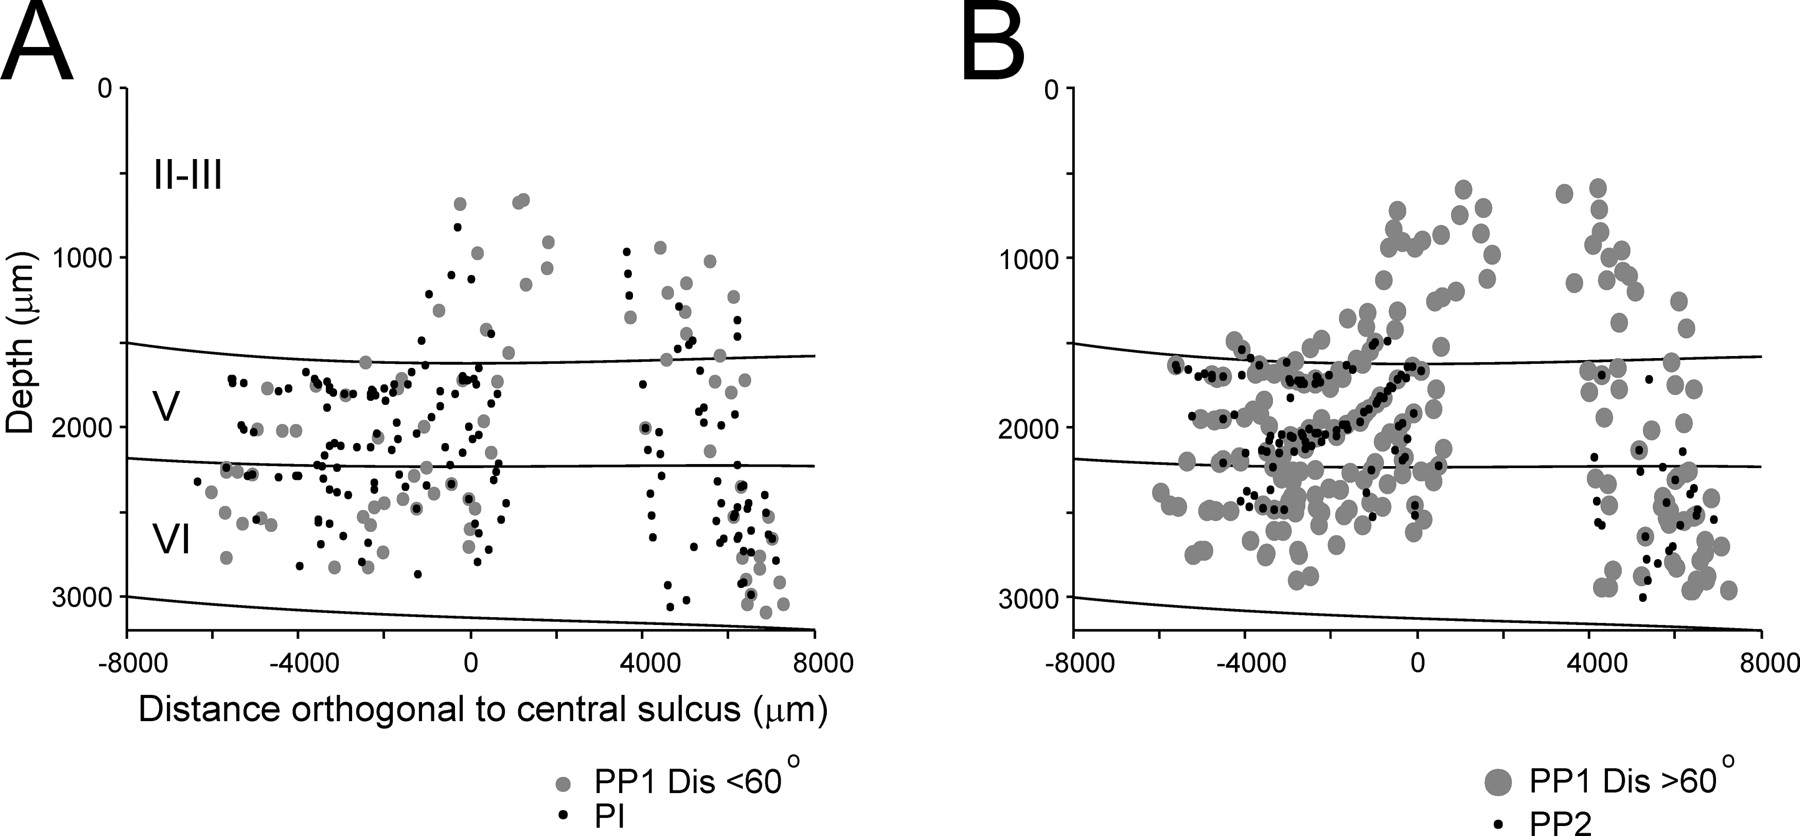
Maps of recording sites of the different cell types. A, Recording sites of PP1 neurons with a tuning dispersion <60° (small gray dots) and of PI (black dots). B, Recording sites of PP1 neurons with a tuning dispersion >60° (large gray dots) and of PP2 neurons (black dots).
Because GABAergic inhibition on PP1 cells was not measured directly in the present experiments, a causal role of interneurons and inhibition on sharpening the directional tuning of PP1 neurons could not be supported unequivocally. Needless to say, intracellular recordings, followed by neuronal labeling and the characterization of the morphological and cytochemical properties of large numbers of cells in the behaving animal, are still technically impossible. Instead, with some degree of error, extracellular methods can be used to dissociate one class of GABAergic interneurons (the thin and fast-spike variety) from pyramidal cells (Connors and Gutnick, 1990; Swadlow, 2003). In fact, important findings on the role of inhibition in the dynamical shaping of tuning have been reported in different cortical areas using these methods (Wilson et al., 1994; Rao et al., 1999; Constantinidis et al., 2002; Beloozerova et al., 2003; Povysheva et al., 2006). Taking this into consideration, our findings in M1 provide support for the idea that pyramidal cells with narrow tuning curves are subjected to local inhibition to send highly specific information to the next processing node.
Footnotes
-
This work was supported by United States Public Health Service Grant NS17413, the United States Department of Veterans Affairs, and the American Legion Brain Sciences Chair. Dr. Hugo Merchant was supported by Programa de Apoyo a Proyectos de Investigación e Innovación Tecnológica Grant IN209305, Fogarty International Research Collaboration Award TW007224-01A1, El Consejo Nacional de Ciencia y Tecnología Grant 053944.
- Correspondence should be addressed to Dr. Hugo Merchant, Instituto de Neurobiología Universidad Nacional Autónoma de México, Juriquilla, Querétaro, QRO 76230 Mexico. merch006{at}umn.edu


