

Abstract
2-Arachidonoylglycerol (2-AG) is the endocannabinoid that mediates retrograde suppression of neurotransmission in the brain. In the present study, we investigated the 2-AG signaling system at mossy cell (MC)–granule cell (GC) synapses in the mouse dentate gyrus, an excitatory recurrent circuit where endocannabinoids are thought to suppress epileptogenesis. First, we showed by electrophysiology that 2-AG produced by diacylglycerol lipase α (DGLα) mediated both depolarization-induced suppression of excitation and its enhancement by group I metabotropic glutamate receptor activation at MC–GC synapses, as they were abolished in DGLα-knock-out mice. Immunohistochemistry revealed that DGLα was enriched in the neck portion of GC spines forming synapses with MC terminals, whereas cannabinoid CB1 receptors accumulated in the terminal portion of MC axons. On the other hand, the major 2-AG-degrading enzyme, monoacylglycerol lipase (MGL), was absent at MC–GC synapses but was expressed in astrocytes and some inhibitory terminals. Serial electron microscopy clarified that a given GC spine was innervated by a single MC terminal and also contacted nonsynaptically by other MC terminals making synapses with other GC spines in the neighborhood. MGL-expressing elements, however, poorly covered GC spines, amounting to 17% of the total surface of GC spines by astrocytes and 4% by inhibitory terminals. Our findings provide a basis for 2-AG-mediated retrograde suppression of MC–GC synaptic transmission and also suggest that 2-AG released from activated GC spines is readily accessible to nearby MC–GC synapses by escaping from enzymatic degradation. This molecular–anatomical configuration will contribute to adjust network activity in the dentate gyrus after enhanced excitation.
Introduction
Endocannabinoids (eCBs) are released from postsynaptic neurons, act retrogradely on presynaptic cannabinoid CB1 receptors, and induce short- and long-term suppression of transmitter release (Hashimotodani et al., 2007b; Kano et al., 2009). This retrograde signaling is triggered by depolarization-induced intracellular Ca2+ elevation (Kreitzer and Regehr, 2001; Ohno-Shosaku et al., 2001; Wilson and Nicoll, 2001), Gαq/11-coupled receptor activation (Maejima et al., 2001), or both (Varma et al., 2001; Ohno-Shosaku et al., 2002; Hashimotodani et al., 2005), and is involved in various neural functions, such as learning and memory, analgesia, and neuroprotection (Kano et al., 2009). 2-Arachidonoylglycerol (2-AG) is the major eCB in the brain (Mechoulam et al., 1995; Sugiura et al., 1995; Stella et al., 1997) and is synthesized by sn-1 diacylglycerol lipase α (DGLα) in postsynaptic elements (Bisogno et al., 2003; Katona et al., 2006; Yoshida et al., 2006; Gao et al., 2010; Tanimura et al., 2010). 2-AG is degraded mainly by monoacylglycerol lipase (MGL) (Dinh et al., 2002; Blankman et al., 2007; Schlosburg et al., 2010), which is expressed in presynaptic terminals (Gulyas et al., 2004) and regulates the magnitude and time course of 2-AG-mediated retrograde signaling (Hashimotodani et al., 2007a; Pan et al., 2009). These molecular components are well orchestrated at individual synapses with some variations according to neuronal and synaptic organization (Kano et al., 2009).
Mossy cell (MC)–granule cell (GC) synapses in the dentate gyrus constitute an excitatory recurrent circuit in the pathway from the entorhinal cortex to the hippocampal CA3 and are considered as one of the epileptogenic circuits (Ratzliff et al., 2002). CB1 is particularly enriched at MC–GC synapses compared with other excitatory synapses in the hippocampus, and CB1 in hippocampal excitatory neurons plays a protective role against seizures (Kawamura et al., 2006; Monory et al., 2006; Katona and Freund, 2008). Experimental seizures lead to increased hippocampal levels of 2-AG and anandamide, another major eCB (Marsicano et al., 2003; Wallace et al., 2003; Wettschureck et al., 2006). Whereas DGLα is expressed at MC–GC synapses (Katona et al., 2006), anandamide is involved in non-CB1-mediated signaling in the dentate gyrus (Chávez et al., 2010). These lines of evidence suggest that 2-AG-mediated control of MC–GC synaptic activity plays a role in prevention of epileptogenesis. However, our understanding on how 2-AG-mediated signaling molecules are arranged at and around MC–GC synapses is still fragmental.
In the present study, we investigated the 2-AG-mediated signaling system at MC–GC synapses. We show that 2-AG produced by DGLα is essential for depolarization-induced suppression of excitation (DSE) and its enhancement by the group I metabotropic glutamate receptor (mGluR). DGLα and CB1 highly accumulate on GC spines and MC terminals, respectively, whereas MGL is absent in MC–GC synapses. Ultrastructural reconstruction of MC–GC synapses reveals that a given GC spine is innervated by a single MC terminal and further contacted nonsynaptically by other MC terminals making synaptic contacts with other GC spines. This configuration will be a molecular–anatomical basis for 2-AG-mediated retrograde suppression of MC–GC synaptic transmission and also predicts its 2-AG-mediated cross talk to other MC–GC synapses in the neighborhood.
Materials and Methods
Animal and tissue preparation.
All experiments were performed according to the guidelines for the care and use of laboratory animals of Hokkaido University, Niigata University, and the University of Tokyo. We used adult C57BL/6N, DGLα-knock-out (Tanimura et al., 2010), and MGL-knock-out mice. MGL-knock-out mice were produced by homologous recombination using the embryonic stem (ES) cell line RENKA, which was derived from the C57BL/6N strain (Mishina and Sakimura, 2007). Targeting vector construct contained the exon 3 of the Mgll gene including one of the residues of the putative catalytic triad Ser-122 (Karlsson et al., 1997), with the 5.3 kb upstream, 4.6 kb downstream homologous genomic DNA and diphtheria toxin gene as a negative selection (supplemental Fig. S1A, available at www.jneurosci.org as supplemental material). Mgll genomic DNA fragments were amplified by PCR and were sequenced. The DNA fragment, which carried the 34 bp loxP sequence and pgk-1 promoter-driven neomycin phosphotransferase gene (neo) flanked by two Flp recognition target (frt) sites, was inserted into the site 330 bp upstream of exon 3. The other loxP site was introduced into the site 280 bp downstream of exon 3 to eliminate exon 3 after Cre-mediated recombination. This results in a frame-shift mutation in the Mgll gene.
ES cells were cultured, and a homologous recombinant clone was used to yield chimeric mice as described previously (Fukaya et al., 2006). Homologous recombinants were identified by Southern blot analysis (supplemental Fig. 1B, available at www.jneurosci.org as supplemental material) under the following conditions: EcoRI-digested DNA hybridized with 5′ probe, 22 kb for wild-type and 8.8 kb for targeted alleles; EcoRI-digested DNA hybridized with 3′ probe, 22 kb for wild-type and 15.6 kb for targeted alleles; AflII-digested DNA hybridized with neo probe, 9.6 kb for targeted allele. Chimeric mice were mated to C57BL/6N mice, and offspring were further crossed with TLCN-Cre mice (Nakamura et al., 2001; Fuse et al., 2004) to yield heterozygous mice. TLCN-Cre mice had been backcrossed to C57BL/6N mice over 10 generations. Heterozygous (+/−) mice were bred to each other to generate homozygous knock-out mice in addition to eliminating the introduced Cre gene from the line. The first offspring was genotyped by Southern blotting (supplemental Fig. S1C, available at www.jneurosci.org as supplemental material) under the following conditions; AflII-digested DNA hybridized with 5′ probe, 7.7 kb for wild-type and 6.9 kb knock-out alleles. Genotypes for all subsequent breeding were determined by PCR analysis of digested mouse tail samples. PCR genotyping of mouse tail DNA was performed with the following primers: Mgl-forward, 5′-GTGATCTCCTAATGCTGCAG-3′; Mgl-reverse, 5′-GTTCTCAGACCTCTGCTAGC-3′ (supplemental Fig. S1A, arrows, available at www.jneurosci.org as supplemental material). PCR products were 970 and 250 bp for the wild-type or MGL-knock-out allele, respectively (supplemental Fig. S1D, available at www.jneurosci.org as supplemental material). The loss of MGL in MGL-knock-out mouse brains was confirmed by isotopic in situ hybridization (supplemental Fig. 1E) and immunoblot (supplemental Fig. 1F, available at www.jneurosci.org as supplemental material). In each analysis, data were obtained from at least two male mice. We used wild-type and knock-out littermates in the present experiments.
Under deep pentobarbital anesthesia (100 mg/kg body weight, i.p.), mice were fixed by transcardial perfusion with 4% paraformaldehyde in 0.1 m phosphate buffer (PB; pH 7.2) for light microscopy, 4% paraformaldehyde/0.1–0.5% glutaraldehyde in 0.1 m PB for immunoelectron microscopy, or 2% paraformaldehyde/2% glutaraldehyde in 0.1 m PB for electron microscopy. Thick sections (50 μm in thickness) were prepared with a microslicer (VT1000S; Leica) and subjected to the free-floating method, whereas semithin cryosections (200 nm) were prepared with an ultracryomicrotome (EM-FCS; Leica) and mounted on silane-coated glass slides. For in situ hybridization, brains were removed from the skull under deep pentobarbital anesthesia and frozen in powdered dry ice. Fresh frozen sections (20 μm) were prepared with a cryostat (CM1900; Leica).
Fluorescent in situ hybridization.
We used the following fluorescein- or digoxigenin (DIG)-labeled riboprobes: mouse DGLα (nucleotides 331–1020 and 2176–3220; National Center for Biotechnology Information (NCBI) reference sequence NM_198114), mouse MGL (nucleotides 394–1263; NCBI reference sequence NM_011844), mouse type 1 vesicular glutamate transporter (VGluT1; nucleotides 301–1680; GenBank accession number BC054462), mouse 67 kDa glutamic acid decarboxylase (GAD67; nucleotides 1036–2015; NCBI reference sequence NM_008077), and mouse glutamate/aspartate transporter (GLAST; nucleotides 1571–2473; GenBank accession number AF330257). Probe synthesis and in situ hybridization were performed as described previously (Yamasaki et al., 2010). Briefly, fresh frozen sections were treated at room temperature with the following incubations: fixation, acetylation, and prehybridization in a hybridization buffer containing 50% formamide, 50 mm Tris-HCl, pH 7.5, 0.02% Ficoll, 0.02% polyvinylpyrrolidone, 0.02% bovine serum albumin (BSA), 0.6 m NaCl, 0.25% SDS, 200 mg/ml tRNA, 1 mm EDTA, and 10% dextran sulfate. Hybridization was performed overnight at 63.5°C in the hybridization buffer with riboprobes diluted at 1:1000. After a stringent wash and blocking, fluorescein-labeled riboprobes were detected using a peroxidase-conjugated anti-fluorescein antibody (Roche Diagnostics) and the FITC-TSA plus amplification kit (PerkinElmer). After inactivation of residual peroxidase activity, DIG-labeled riboprobes were then detected using a peroxidase-conjugated anti-DIG antibody (Roche Diagnostics) and the Cy3-TSA plus kit (PerkinElmer). Nuclear counterstaining was done with TOTO3 (Invitrogen). Images were taken with a confocal laser-scanning microscope (FV1000; Olympus).
The specificity of hybridization signals was confirmed by blank labeling with use of sense riboprobes in all experiments, as reported previously (Yamasaki et al., 2010; Yamazaki et al., 2010). We also confirmed the specificity of DGLα mRNA signals by identical patterns with use of two nonoverlapping probes and that of MGL mRNA signals by significant reduction in MGL-knock-out mice (supplemental Fig. S2, available at www.jneurosci.org as supplemental material). Residual signals in MGL-knock-out mice may reflect the expression and detection of truncated MGL mRNA lacking nucleotide residues encoded by exon 3. Cells expressing given mRNAs at high or low levels were defined as those having perikarya with or without individual fluorescent puncta merging into aggregates, respectively.
Isotopic in situ hybridization.
Antisense oligonucleotide probes for MGL [5′-gcaccgcccatggagtggcccaggaggaagatggggacgtcgggg-3′ (704–752; NM_011844)] were synthesized. They were radiolabeled with [33P]dATP using terminal deoxyribonucleotidyl transferase (Invitrogen). Fresh frozen sections were hybridized with the radiolabeled probes as described previously (Uchigashima et al., 2007a,b). Hybridized sections were exposed to BioMax film (Kodak).
Antibody.
We used affinity-purified primary antibodies raised against the following molecules (species immunized): MGL (rabbit; see below), DGLα [rabbit (Yoshida et al., 2006)], mGluR5 [guinea pig and goat (Uchigashima et al., 2007a)], MAP2 [rabbit and goat (Miura et al., 2006)], synaptophysin [guinea pig (Fukaya and Watanabe, 2000)], CB1 receptor [guinea pig (Fukudome et al., 2004)], calretinin [mouse (MAB1568; Millipore Bioscience Research Reagents), rabbit (Miyazaki et al., 2011)], VGluT1 [rabbit and goat (Miyazaki et al., 2003; Miura et al., 2006)], VGluT2 [guinea pig and goat (Miyazaki et al., 2003; Miura et al., 2006)], vesicular inhibitory amino acid transporter [VIAAT; goat (Miyazaki et al., 2003; Miura et al., 2006)], vesicular acetylcholine transporter [VAChT; rabbit (Nakamura et al., 2004)], glial fibrillary acidic protein [GFAP; guinea pig (Hisano et al., 2009)], GLAST [goat (Shibata et al., 1997)], 2′,3′-cyclic nucleotide 3′ phosphodiesterase (CNPase; mouse; C5922; Sigma), and Iba1 (rabbit; Wako). For production of the MGL antibody, a cDNA fragment encoding the N-terminal 35 amino acids (NCBI reference sequence NM_011844) was subcloned into BamHI/EcoRI site of pGEX4T-2 plasmid (GE Healthcare) for expression of glutathione S-transferase fusion proteins. Immunization and affinity purification were performed as reported previously (Watanabe et al., 1998).
Immunohistochemistry.
All immunohistochemical incubations were done at room temperature. For immunofluorescence, microslicer sections and semithin cryosections were incubated successively with 10% normal donkey serum for 20 min, a mixture of primary antibodies overnight (1 μg/ml), and a mixture of Alexa488-, indocarbocyanine (Cy3)-, and indodicarbocyanine (Cy5)-labeled species-specific secondary antibodies for 2 h at a dilution of 1:200 (Invitrogen, Jackson Immunoresearch). For the detection of filamentous (F)-actin, Alexa488-conjugated phalloidin (1:500; Invitrogen) was added to a mixture of secondary antibodies. For unknown reasons, we occasionally encountered cross-reaction of the MGL antibody to other primary antibodies when used in mixture. Therefore, we adopted the two-step method for multiple immunofluorescence involving MGL, as follows. First, MGL was detected with a rabbit MGL antibody and a Cy3-labeled rabbit-specific secondary antibody. After blocking with 10% rabbit normal serum, other molecules were detected by incubation with non-rabbit primary antibodies followed by reaction with Alexa488- or Cy5-labeled species-specific secondary antibodies. Images were taken with a fluorescent microscope (AX-70; Olympus Optical) equipped with a digital camera (DP70; Olympus Optical) or with a confocal laser-scanning microscope (FV1000; Olympus Optical). To minimize sampling bias, we used 5–10 images taken randomly. To evaluate the degree of overlap between two fluorescent signals (see Fig. 3K), we calculated, using MetaMorph software (Molecular Devices), the Pearson correlation coefficient, which yields values from −1 (a perfect negative correlation) to +1 (a perfect positive correlation).
For preembedding immunogold electron microscopy, microslicer sections were blocked with 5% BSA/0.02% saponin/Tris-buffered saline (TBS; pH 7.5) for 30 min and incubated overnight with the primary antibody diluted with 1% BSA/0.004% saponin/TBS. Sections were washed with 0.004% saponin/TBS and incubated with the secondary antibody linked to 1.4 nm gold particles (Nanogold; Nanoprobes) for 2 h. After washing and postfixation with 1% glutaraldehyde for 10 min, immunogold particles were intensified with a silver enhancement kit (HQ silver; Nanoprobes). Sections were treated with 1% osmium tetroxide/0.1 m PB for 15 min, stained in block with 2% uranyl acetate for 20 min, and embedded in Epon 812. Photographs were taken with an H-7100 electron microscope (Hitachi).
Each profile of elements was identified based on the previous description with serial sections (Peters et al., 1976). To evaluate intraspine distribution of DGLα, those spines whose head portion had a synaptic contact and neck portion was connected to the dendritic shaft were collected. On electron micrographs, we measured the length of the cell membrane, the cytoplasmic area, and the number or distribution of metal particles in each profile using MetaMorph software (Molecular Devices).
Electron microscopy.
Microslicer sections were postfixed in 2% osmium tetroxide for 1 h, stained in block with 2% uranyl acetate for 20 min, dehydrated, and embedded in Epon 812. Serial ultrathin sections (90 nm) were prepared with an ultramicrotome (Ultracut UCT; Leica). Each profile of neural and synaptic elements was determined based on the previous description (Peters et al., 1976). Three-dimensional (3D) reconstructed images were constructed and analyzed with an open source software, Reconstruct (Fiala, 2005).
Electrophysiology.
Coronal hippocampal slices (400 μm) were prepared from DGLα-knock-out and wild-type mice at postnatal days 20–30, as described previously (Chiu and Castillo, 2008). Mice were decapitated under CO2 anesthesia, and the brain was quickly removed and cooled in an ice-cold, modified external solution containing (in mm) 120 choline-Cl, 2 KCl, 8 MgCl2, 28 NaHCO3, 1.25 NaH2PO4, and 20 glucose bubbling with 95% O2 and 5% CO2. Coronal hippocampal slices (400 μm) were cut with a vibroslicer (VT-1200; Leica), and the slices were immediately placed into a reservoir chamber filled with the standard external solution composed of (in mm) 125 NaCl, 2.5 KCl, 2 CaCl2, 1 MgSO4, 1.25 NaH2PO4, 26 NaHCO3, and 20 glucose, bubbled with 95% O2 and 5% CO2, pH 7.4.
For recording, a single slice was transferred to a submerged recording chamber. The slice was perfused with an external solution at 32°C that contained 2.5 mm CaCl2 and 1.3 mm MgSO4 and was supplemented with 100 μm picrotoxin (GABAA receptor antagonist) and 3 μm CGP 55845A (GABAB receptor antagonist). Whole-cell recordings were made from GCs using an upright microscope (BX50WI; Olympus) equipped with an infrared-CCD camera system (Hamamatsu Photonics) (Narushima et al., 2007). Resistance of the patch pipette was 4–5 MΩ when filled with the intracellular solution containing (in mm) 140 CsCl, 1 EGTA, 10 HEPES, 4.6 MgCl2, 0.1 CaCl2, 4 Na2ATP, 0.4 Na2GTP (pH 7.3, adjusted with CsOH). The pipette access resistance was compensated by 80%, and the holding potential was −70 mV. To stimulate MC axons, a pair of patch pipettes filled with the external solution was used as a bipolar stimulation electrode. The electrode had a tip separation of 40 μm and was placed in the supragranular layer within 40 μm from the cell body layer. A previous report (Chiu and Castillo, 2008) showed that medial perforant path inputs, but not MC inputs, were sensitive to group II mGluR agonists. Therefore, we checked whether the evoked EPSCs were suppressed by 1 μm DCG-IV (group II mGluR agonist), and only the DCG-IV-insensitive EPSCs were analyzed. EPSCs were evoked at 0.33 Hz for at least 1 min to obtain a stable baseline. Then, a depolarizing pulse (from −70 to 0 mV, for 3 s) was applied to induce DSE. To examine the enhancement of marginal DSE by group I mGluR activation, a series of short depolarizing pulses (five pulses of 100 ms duration, from −70 to 0 mV, repeated at 1 Hz) was applied to induce marginal DSE with or without the group I mGluR agonist (R,S)-3,5-dihydroxyphenylglycine (DHPG; Tocris Bioscience; 10 μm, bath applied for at least 10 min). Membrane currents were recorded with an EPC-9/2 amplifier (HEKA Elektronik). The signals were filtered at 3 kHz and digitized at 20 kHz.
Results
2-AG mediates retrograde suppression at MC–GC synapse
Because DGLα is the major enzyme responsible for 2-AG production in principal neurons of the striatum, hippocampus, and cerebellum (Gao et al., 2010; Tanimura et al., 2010), we examined whether this was also true at MC–GC synapses. We made whole-cell recordings from GCs (Chiu and Castillo, 2008) and stimulated MC axons with bipolar electrodes in the inner molecular layer (<40 μm from the GC layer) at which GCs exclusively receive excitatory MC inputs on their dendritic spines (Shepherd, 2004) (see Fig. 3A–F). In wild-type mice, transient suppression of EPSCs (i.e., DSE) was readily induced by depolarization of GCs (from −70 to 0 mV, for 3 s) (Fig. 1A). In contrast, DSE was absent in DGLα-knock-out mice (Fig. 1A), indicating that DSE at MC–GC synapses is mediated by 2-AG produced by DGLα. In wild-type mice, marginal DSE by five short depolarization pulses (from −70 to 0 mV, 100 ms duration at 1 Hz) was significantly enhanced by bath application of a low dose of group I mGluR agonist DHPG (10 μm), which by itself did not cause EPSC suppression (Fig. 1B, top). This enhancement of DSE was totally absent in GCs of DGLα-knock-out mice (Fig. 1B, bottom), indicating that retrograde suppression assisted by group I mGluR activation is also mediated by 2-AG produced by DGLα at MC–GC synapses.

Retrograde suppression of excitation is absent at MC–GC synapses in the dentate gyrus of DGLα-knock-out mice. A, Sample traces and average time courses of the amplitudes of MC–GC EPSCs of wild-type (WT; open circles) and DGLα-knock-out (KO) mice (blue diamonds) before and after depolarization (from −70 to 0 mV, for 3 s). B, Top, Retrograde suppression at MC–GC synapses after combined depolarization (5 depolarization pulses from −70 to 0 mV with 100 ms duration at 1 Hz) with bath application of DHPG (10 μm) in wild-type mice (filled circles). Note that depolarization alone failed to induce noticeable suppression (open circles). Bottom, No suppression was induced by either depolarization alone (blue diamonds) or combined depolarization with DHPG application (filled diamonds) at MC–GC synapses of DGLα-KO mice. Protocols of depolarization and DHPG application were the same as in wild-type mice. Sample EPSC traces (a–d) were obtained at the time points indicated in the graphs. Calibration: A, 100 pA, 5 ms (WT) and 50 pA, 5 ms (DGLα-KO); B, 20 pA, 5 ms (WT) and 50 pA, 5 ms (DGLα-KO). **p < 0.001 (two-factor repeated-measures ANOVA followed by post hoc Bonferroni test).
DGLα highly accumulates in the neck portion of GC spines
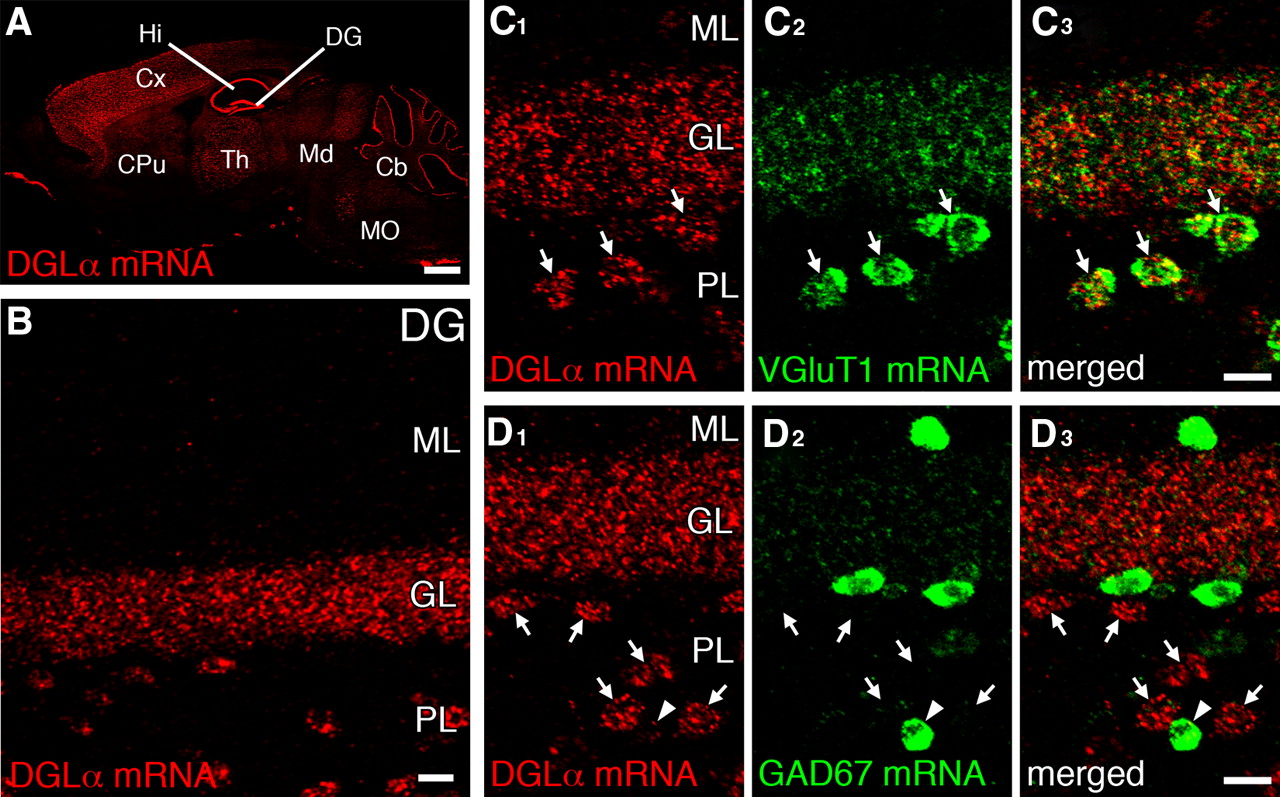
By fluorescent in situ hybridization using specific riboprobes (supplemental Fig. S2, available at www.jneurosci.org as supplemental material), DGLα mRNA was prominently expressed in GCs and hilar cells of the dentate gyrus (Fig. 2A,B), as reported previously (Katona et al., 2006). Because hilar cells consist of glutamatergic MCs and GABAergic interneurons (Blasco-Ibanez and Freund, 1997), we performed double fluorescent in situ hybridization using glutamatergic neurochemical marker VGluT1 and GABAergic marker GAD67. Most hilar cells highly expressing DGLα mRNA were judged to be MCs, because they coexpressed VGluT1 mRNA (59 of 62 cells expressing high levels of DGLα mRNA) (Fig. 2C, arrows) but not GAD67 mRNA (0 of 44 cells) (Fig. 2D, arrows). DGLα mRNA in MCs is likely consistent with depolarization-induced suppression of inhibition (DSI) in MCs (Hofmann et al., 2006). We also found low levels of DGLα mRNA in some interneurons expressing GAD67 mRNA (30 of 44 cells expressing GAD67 mRNA) (Fig. 2D, arrowhead). These results demonstrate that cells highly expressing DGLα mRNA are GCs and MCs in the dentate gyrus.

DGLα is highly expressed in GCs and MCs of the dentate gyrus. Fluorescent in situ hybridization (FISH) for DGLα mRNA is shown. A, B, Single FISH in the mouse brain (A) and dentate gyrus (DG; B). Note the strong signals in the pyramidal cell layer of the hippocampus (Hi) and the GC layer (GL) of the DG. Hilar cells also express DGLα mRNA in the polymorphic layer (PL) of the DG. C, D, Double FISH for DGLα (red) and VGluT1 (C, green) or GAD67 (D, green) mRNAs. Hilar cells expressing DGLα mRNA at high levels (C, D, arrows) coexpress VGluT1 mRNA, but not GAD67 mRNA, indicating prominent expressions of DGLα mRNA in MCs. Low levels of DGLα mRNA are detected in some cells expressing GAD67 mRNA (D, arrowheads). Cb, Cerebellum; CPu, caudate–putamen; Cx, neocortex; Md, midbrain; MO, medulla oblongata; Th, thalamus, ML, molecular layer. Scale bars: A, 1 mm; B–D, 20 μm.
To address the major site of 2-AG production at MC–GC synapses, we next investigated immunohistochemical localization of DGLα in the molecular layer of the dentate gyrus. We focused on the inner portion of the molecular layer just above the GC layer, because this portion was filled with terminals double labeled for calretinin and VGluT1, which represent MC terminals (Blasco-Ibanez and Freund, 1997; Fujise et al., 1998) (Fig. 3A, B). Compared with the MC terminals, VIAAT-positive inhibitory terminals in the inner molecular layer were apparently few in number (Fig. 3C). On the other hand, calretinin-positive interneuron terminals lacking VGluT1 immunoreactivity were mainly distributed in the hilar region but were very rare in the molecular layer; thus, most calretinin-positive terminals were the MC terminals in the inner molecular layer. Terminals double labeled for VGluT2 and VIAAT, which represent afferents from the supramammillary nucleus (Soussi et al., 2010), were distributed in the upper portion of the GC layer, but not in the MC-recipient molecular layer (Fig. 3C,D). VAChT-positive cholinergic terminals were also sparse in the MC-recipient molecular layer (Fig. 3E,F). These results suggest that the majority of synapses in the inner molecular layer is formed by MC terminals.

Distribution of MC terminals (A–F) and immunofluorescence for DGLα (G–K) in the inner molecular layer of the dentate gyrus. A, B, Double immunofluorescence for VGluT1 (red) and calretinin (green). VGluT1-positive boutons are densely distributed and exclusively colabeled for calretinin in the inner molecular layer (IML; B, arrowheads). C, D, Triple immunofluorescence for VGuT2 (red), VIAAT (blue), and calretinin (green). E, F, Double immunofluorescence for VAChT (red) and calretinin (green). Note that VGluT2/VIAAT-positive terminals from the supramammillary nucleus (C, D, arrowheads) or VAChT-positive cholinergic terminals (E, F, arrowheads) are negative for calretinin and sparsely distributed in the MC-recipient IML. G–J, Immunofluorescence for DGLα. G, Single immunofluorescence reveals dense punctate immunolabeling for DGLα all over the molecular layer (ML). H, Double immunofluorescence for DGLα (red) and somatodendritic marker MAP2 (green) in the IML. Tiny punctate labeling for DGLα is distributed along MAP2-labeled dendrites. I, Double immunofluorescence for DGLα (red) and terminal marker synaptophysin (green) in the IML. DGLα is apposed to synaptophysin-labeled nerve terminals (arrowheads). J, Triple labeling for mGluR5 (J1,3, red), DGLα (J2,4, red), and F-actin (J>3,4, green) in the IML. Note that F-actin (arrows) is overlapped well with mGluR5 but aligned side by side with DGLα. K, Summary bar graph showing the mean correlation coefficient of two fluorescent signals: between F-actin and mGluR5 (left), between F-actin and DGLα (middle), and between F-actin and MAP2 (right). The numbers and error bars indicate the mean correlation coefficient and SEM, respectively. Seven sets of images were analyzed for each pair. GL, GC layer. Scale bars: A, C, E, G, 10 μm; B, D, F, H–J, 2 μm.
In the inner molecular layer, DGLα showed a dense punctate pattern of immunofluorescence (Fig. 3G). These puncta were preferentially distributed along dendritic branches labeled for MAP2 (Fig. 3H) and apposed to nerve terminals labeled for synaptophysin (Fig. 3I, arrowheads), suggesting postsynaptic localization in spines, dendrites, or both. To confirm the spine localization, triple fluorescence was conducted for mGluR5, a major group I mGluR in the telencephalon, and F-actin, both being enriched in the head portion of spines (Lujan et al., 1996; Capani et al., 2001). Indeed, mGluR5 and F-actin were considerably overlapped with each other (Fig. 3J1,J3, arrows). Unexpectedly, DGLα was not overlapped, but rather positioned side by side, with mGluR5 (data not shown) and with F-actin (Fig. 3J4). To assess the different distribution of two fluorescent signals quantitatively, we calculated the mean correlation coefficient of F-actin with mGluR5, DGLα, or MAP2, the latter used as a marker molecule distributed in dendritic shafts but not in dendritic spines. The mean correlation coefficient of F-actin and DGLα was lower value than that of F-actin and mGluR5 but higher than that of F-actin and MAP2 (Fig. 3K), suggesting the accumulation of DGLα between the dendritic shaft and spine head.
To address precise localization of DGLα, we applied the preembedding silver-intensified immunogold electron microscopy (Fig. 4). Most metal particles were distributed on the plasma membrane of dendritic spines and shafts with a few attached to the endoplasmic reticulum (Fig. 4A,B). By quantification, the mean density of immunogold particles on the plasma membrane was similarly high in spines and shafts of GC dendrites, whereas that on MC terminals was at around the background level, as determined using DGLα-knock-out mice (Fig. 4C). In labeled spines, metal particles were found more often around the neck portion than the head portion (Fig. 4B). Intraspine distribution was evaluated by plotting the distribution of metal particles as a function of the distance from the edge of the postsynaptic density (PSD) (Fig. 4D) or from the spine–dendrite boarder (Fig. 4E) (n = 54 GC spines). The peak distribution was apart from the edge of the PSD (Fig. 4D) and observed near the spine–dendrite boarder (Fig. 4E). When the distribution of metal particles was plotted relative to the edge of the PSD (0%) and the spine–dendrite border (100%), the peak distribution was at the 80–100% bin, i.e., the base of the spine neck, and decreased progressively toward the edge of the PSD (Fig. 4F). These results suggest that 2-AG is synthesized in, and released from, dendritic spines and shafts, particularly at the spine neck portion.

Preferential distribution of DGLα on dendritic spines and shafts of GCs with the highest accumulation in the spine neck. A, B, Preembedding silver-enhanced immunogold electron microscopy. Metal particles for DGLα are located on the cell surface of dendritic spines (Sp; blue) and shafts (Dn; yellow) of GCs but not on that of MC terminals (MCT). Note two serial images in B1 and B2, in which the spine neck portion is consistently labeled. C, Bar graph showing the mean labeling density for DGLα, i.e., the mean number of metal particles per 1 μm of the plasma membrane in each element of wild-type (WT) and DGLα-knock-out (KO) mice. The numbers in and above parentheses on each column indicate the total length of measured plasma membrane or the mean labeling density, respectively. D–F, Histograms showing intraspine distribution of DGLα. The abscissa indicates the distance (in nanometers) from the edge of the PSD (D) or from the spine–dendrite border (E) and the normalized distance from the edge of the PSD (0%) to the spine–dendrite border (100%) (F). The ordinates indicate the percentage of metal particles falling in each bin. The total number of 71 metal particles was collected from 54 GC spines. Scale bars, 500 nm.
CB1 accumulates in the terminal portion of MC axons
In the dentate gyrus, CB1 is expressed weakly in MC terminals and intensely in CCK-positive interneuron terminals (Katona et al., 1999, 2006; Kawamura et al., 2006; Monory et al., 2006). To quantitatively evaluate CB1 expression and distribution in MC axons, we applied triple immunofluorescence to semithin cryosections (200 nm in thickness) to obtain high-resolution images (Fig. 5). Indeed, weak immunoreactivity for CB1 was detected in MC terminals colabeled for VGluT1 and calretinin (Fig. 5A,B, arrowheads). Because VGluT1 was exclusively overlapped with calretinin (90%, 109 of 121 VGluT1-positive terminals) (Figs. 3B, 5A,B) and also because VGluT1-negative nonterminal axons of MCs were stained for calretinin (Fig. 5B, double arrowheads), VGluT1-positive terminals thus mostly represent MC terminals in the inner molecular layer. Then, using VGluT1 and VIAAT, we quantitatively examined CB1 expression in terminals of MCs or interneurons, respectively (Fig. 5C–F). CB1 was detected, although low in intensity, in most of the VGluT1-positive terminals (72%, 188 of 260 terminals) (Fig. 5D, arrowheads). On the other hand, 30% of VIAAT-positive terminals (127 of 420 terminals) exhibited intense signals for CB1 (Fig. 5C,D, arrows).

CB1-expressing MC terminals exist at high densities in the inner molecular layer. A–D, Triple immunofluorescence for CB1 (red), VGluT1 (blue), and calretinin (A, B, green) or VIAAT (C, D, green) in the dentate gyrus. All images were taken from semithin cryosections (200 nm in thickness). B and D are high-power images in the inner molecular layer (IML). VGluT1-positive glutamatergic terminals are densely distributed, and most of them are positive for calretinin (B, arrowheads) and express low levels of CB1 (B, D, arrowheads). In contrast, VIAAT-positive inhibitory terminals are sparsely distributed, and some of them express high levels of CB1 (C, D, arrows). Double arrowheads in B indicate calretinin-positive and VGluT1-negative elements; these elements are mostly nonterminal portions of MC axons, as they are also negative to VIAAT (data not shown). E, A schematic drawing representing the distribution of centers of CB1/VGluT1-positive terminals (blue spots) and CB1/VIAAT-positive terminals (yellow spot), as reconstructed from the image in D. Concentric circles having the radius of 0.5, 1.0, 1.5, 2.0, 2.5, and 3.0 μm are overlaid on two selected blue spots. Note that blue spots included in given concentric circles outnumber yellow spots. F, Graph showing the average number of CB1/VGluT1-positive terminals or CB1/VIAAT-positive terminals in concentric circles with the radius ranging from 0 to 3.0 μm. n = 108 CB1/VGluT1-posotive terminals. Error bars indicate SD. ML, Molecular layer; GL, GC layer. Scale bars: A–C, 5 μm; D, 2 μm.
Obviously, VGluT1-positive terminals expressing CB1 were outnumbered by VIAAT-positive terminals expressing CB1 in the inner molecular layer (Fig. 5C,D), suggesting that MC terminals are positioned far more close to other MC terminals than to interneuron terminals. This was substantiated by plotting the centers of VGluT1-positive/CB1-positive terminals and VIAAT-positive/CB1-positive terminals as blue or yellow spots, respectively (Fig. 5E), and by counting their numbers contained in 0.5- to 3.0-μm-radius circles around a given MC terminal (Fig. 5F). The average number of blue spots increased steeply as a function of the radius: 1.6 ± 1.1 (mean ± SD) and 6.7 ± 2.5 blue spots in 1.5- and 3.0-μm-radius circles, respectively. However, the average number of yellow spots remained as low as 0.2 ± 0.4 and 0.6 ± 0.7 in 1.5- and 3.0-μm-radius circles, respectively.
Detailed distribution of CB1 in MC axons was assessed by the preembedding silver-intensified immunogold electron microscopy (Fig. 6). Because of the diverse shape and size of MC terminals, we defined the terminal portion as synaptic vesicle-accumulating regions and the juxtaterminal and extraterminal portions as 0–0.5 and >0.5 μm from the edge of the terminal portion (Fig. 6A). By collecting immunolabeled axon profiles containing all three portions (n = 14 axons), metal particles for CB1 were mainly localized on the plasma membrane of MC axons, and the density of plasma membrane labeling was in the order of terminal > juxtaterminal > extraterminal portions (Fig. 6B,C). Labeling density in the active zone, which was defined as the presynaptic membrane opposite to the PSD, was as low as that in the extraterminal portion (Fig. 6C). To assess the probability of positive CB1 labeling in MC terminals at the electron microscopic level, we examined three serial sections for each terminal, and found one or more metal particles in 83% of MC terminals examined (n = 66 terminals), almost consistent with the result by immunofluorescence microscopy (72%). Therefore, CB1 is expressed in most MC terminals and accumulates toward the terminal portion of MC axons.

Immunoelectron microscopy showing the distribution of CB1 in MC axons and its gradient toward the terminal portion. A, A schematic illustration showing the definition of the terminal (synaptic vesicle-containing portion), juxtaterminal (≤0.5 μm from the edge of terminal), and extraterminal portions (> 0.5 μm) of MC axons. Black lines represent the PSD on GC spines and the active zone of MC terminals. B, Preembedding silver-enhanced immunogold electron microscopy. Metal particles for CB1 are selectively localized on the surface of MC terminals (MCT) and axons (Ax). Arrows indicate the border between the terminal and juxtaterminal portions, whereas arrowheads indicate the edge of the PSD. Sp, GC spine. C, Bar graph showing the mean labeling density for CB1, i.e., the mean number of metal particles per 1 μm of the axolemma. The number on the top of each column indicates the mean labeling density. n = 14 axons. Scale bar, 200 nm.
MGL is lacking in MC–GC synapses
As a major degrading enzyme, MGL restricts the spread of 2-AG both spatially and temporally (Hashimotodani et al., 2007a; Pan et al., 2009). We next examined cellular expression and subcellular distribution of MGL. As reported previously (Dinh et al., 2002), MGL mRNA was widely expressed in the brain with high levels in the GC and pyramidal cell layers of the hippocampal formation (Fig. 7A). In addition to the principal cell layers, we found two distinct patterns of cellular labeling in the neuropil, i.e., intense labeling in large oval or polygonal cells (Fig. 7B, arrows) and weak labeling in small irregular cells (Fig. 7B, arrowheads). In the dentate gyrus, all cells with the former labeling were interneurons expressing GAD67 mRNA (48 of 48 cells expressing MGL mRNA) (Fig. 7C, arrows), whereas cells with the latter labeling were astrocytes expressing GLAST mRNA, an astrocyte-specific glutamate/aspartate transporter (110 of 122 cells) (Fig. 7D, arrowheads). However, MGL mRNA was not detected in almost all MCs expressing VGluT1 mRNA in the hilus (1 of 47 cells expressing VGluT1 mRNA) (Fig. 7E, double arrowheads). Thus, MGL mRNA is expressed in various cells in the dentate gyrus, except for MCs.

In situ hybridization showing distinct cellular expression of MGL mRNA in the dentate gyrus. A, Fluorescent in situ hybridization (FISH) and isotopic in situ hybridization (RI-ISH; inset) for MGL mRNA in parasagittal brain sections. B, FISH for MGL mRNA in the hippocampus formation. Principal neurons are labeled at moderate levels in the dentate GC layer (GL) and hippocampal pyramidal cell layer (Py). Note that medium-sized (arrows) or small (arrowheads) cells express MGL mRNA at high or low levels, respectively. C–E, Double FISH for MGL mRNA (red) with GAD67 (C, green), GLAST (D, green), or VGluT1 (E, green) mRNA. Note that MGL mRNA is expressed at high levels in inhibitory interneurons labeled for GAD67 mRNA (C, arrows) and at low levels in astrocytes labeled for GLAST mRNA (D, arrowheads). In contrast, MGL mRNA is negative in MCs identified by VGluT1 mRNA labeling (E, double arrowheads). Cb, Cerebellum; CPu, caudate–putamen; Cx, neocortex; DG, dentate gyrus; GP, globus pallidus; Hi, hippocampus; Md, midbrain; MO, medulla oblongata; Ob, olfactory bulb; SNr, substantia nigra pars reticulata; SC, superior colliculus; Th, thalamus; CA1, CA1 subregion of the hippocampus; Or, stratum oriens; Ra, stratum radiatum; LMo, lacunosum moleculare; ML, molecular layer; PL, polymorphic layer. Scale bars: A, 1 mm; B, 200 μm; C–E, 20 μm.
Immunohistochemical distribution and localization were examined using the MGL antibody, whose specificity was verified by blank immunoblot (supplemental Fig. S1F, available at www.jneurosci.org as supplemental material) and blank immunohistochemical labeling (Fig. 8A,B) in MGL-knock-out brains. In the dentate gyrus, the glia-like immunostaining pattern was evident (Fig. 8C). By double immunofluorescence with astrocyte markers, MGL was overlapped with GFAP in perikarya and shaft processes of astrocytes (Fig. 8D, arrows) and with GLAST in their peripheral processes (Fig. 8E, arrows). There was also a punctate pattern of immunolabeling, which was negative for GLAST (Fig. 8E, arrowheads). These puncta were inhibitory terminals expressing VIAAT (Fig. 8F). MGL was detected in both CB1-positive/VIAAT-positive terminals (33 of 47 terminals) (Fig. 8F, single arrowheads) and CB1-negative/VIAAT-positive terminals (60 of 73 terminals) (Fig. 8F, double arrowheads), but not in MC terminals labeled for VGluT1 and calretinin (Fig. 8G, arrows). No MGL immunoreactivity was detected in oligodendrocytes labeled for CNPase (Fig. 8H), microglia labeled for Iba1 (Fig. 8I), and neuronal dendrites labeled for MAP2 (Fig. 8J). Consistent with MGL mRNA expression in GCs and pyramidal cells, MGL labeling was found in VGluT1-labeled mossy fiber terminals in the CA3 (Fig. 8K) or VGluT1-labeled Schaffer collateral terminals in the CA1 (Fig. 8L, arrows). In the CA1, MGL was detected in both CB1-positive/VIAAT-positive (Fig. 8M, arrowheads) and CB1-negative/VIAAT-positive (Fig. 8M, double arrowheads) terminals and also in GLAST-expressing astrocytic processes (Fig. 8N, arrowheads). Thus, MGL is expressed in various nerve terminals and astrocytes, except for MC terminals and some interneuron terminals.

MGL is expressed in astrocytes and some inhibitory terminals in the dentate gyrus and hippocampus. A–C, Immunofluorescence for MGL in parasagittal brain sections of wild-type (WT; A, C) and MGL-knock-out (KO; B) mice. C, An enlarged view of the hippocampus formation. D, E, Double immunofluorescence for MGL (red) and astrocytic marker GFAP (D, green) or GLAST (E, green) in the inner molecular layer (IML) of the dentate gyrus. Note the overlap of MGL with GFAP in perikarya and shaft processes of astrocytes (D, arrows) and with GLAST in their peripheral processes (E, arrows). The arrowhead in E indicates intense MGL in GLAST-immunonegative elements (putative inhibitory terminals). F, Triple immunofluorescence for MGL (red), VIAAT (F1, green), and CB1 (F3, blue) in the IML. Note that intense MGL is found in many VIAAT-positive inhibitory terminals, which include both CB1-positive (arrowheads) and CB1-negative (double arrowheads) terminals. G, Triple immunofluorescence for MGL (red), VGluT1 (G1, green), and calretinin (G3, blue) in the IML. Note that there is no MGL immunoreactivity in MC terminals colabeled for VGluT1 and calretinin (arrows). H–J, Double immunofluorescence for MGL (red) with CNPase (H, green), Iba1 (I, green), or MAP2 (J, green). Note that there is no MGL labeling in CNPase-positive oligodendrocytes, Iba1-positive microglia, or MAP2-positive neuronal dendrites. K, L, Double immunofluorescence for MGL (red) and VGluT1 (green) in the hippocampal CA3 (K) and CA1 (L). M, Triple immunofluorescence for MGL (red), VIAAT (green), and CB1 (blue) in the hippocampal CA1. N, Double immunofluorescence for MGL and GLAST in the hippocampal CA1. In the CA3, intense immunoreactivity is detected in VGluT1-labeled mossy fiber terminals (K). In the CA1, MGL immunoreactivity is detected in VGluT1-labeled excitatory terminals of Schaffer collaterals (L, arrows), VIAAT-labeled inhibitory terminals including both CB1-positive (M, arrowheads) and CB1-negative (M, double arrowheads) ones, and GLAST-labeled astrocytes (N, arrowheads). Cb, Cerebellum; CPu, caudate–putamen; Cx, neocortex; DG, dentate gyrus; GP, globus pallidus; Hi, hippocampus; Md, midbrain; MO, medulla oblongata; Ob, olfactory bulb; SNr, substantia nigra pars reticulata; SC, superior colliculus; Th, thalamus; Su, subiculum; Or, stratum oriens; Py, pyramidal cell layer; Ra, stratum radiatum; LMo, lacunosum moleculare; ML, molecular layer; GL, GC layer; PL, polymorphic layer; Lu, stratum lucidum. Scale bars: A, B, 1 mm; C, 200 μm; D, 20 μm; E–G, L–N, 2 μm; H–K, 5 μm.
This was confirmed by immunoelectron microscopy in the inner molecular layer (Fig. 9). Metal particles for MGL were widely distributed in the cytoplasm of astrocytes from perikarya to peripheral processes enwrapping MC–GC synapses (Fig. 9A,B, colored area). Occasionally, metal particles appeared to be associated with membranous structures, such as the cell membrane and mitochondria. Cytoplasmic and membrane-associated distribution of MGL is consistent with previous studies (Dinh et al., 2002: Blankman et al., 2007). At inhibitory synapses made onto dendritic shafts, metal particles were selective to presynaptic terminals (Fig. 9C). We measured the density of MGL labeling in each element (Fig. 9D). Labeling densities in glial processes and inhibitory terminals were similarly high in wild-type mice and, by far, exceeded those in MGL-knock-out mice. In contrast, labeling densities in MC terminals, GC spines, and GC dendrites in wild-type mice were as low as those in MGL-knock-out mice. Therefore, astrocytes and some inhibitory terminals are the cellular elements expressing MGL in the inner molecular layer.

MGL is selectively localized in glial elements and inhibitory terminals in the inner molecular layer of the dentate gyrus. A, B, Preembedding silver-enhanced immunogold electron microscopy. Metal particles are distributed inside perikarya and lamellate processes of glial cells (Gl; purple) but not in MC terminals (MCT) or GC spines (Sp). C, Two serial images showing consistent MGL labeling in inhibitory terminals (InT) forming symmetrical synapses (arrows) with dendritic shafts (Dn). D, Bar graph showing the number of metal particles for MGL per 1 μm2 of the cytoplasmic area in each subcellular element of wild-type (WT; open bars) and MGL-knock-out (KO; filled bars) mice. The numbers in and above parentheses on the top of each column indicate the total area analyzed and the mean labeling density, respectively. Scale bars, 500 nm.
GC spine is contacted nonsynaptically by other MC terminals making synapses with other nearby GC spines
The aforementioned findings suggest that once 2-AG is liberated, retrograde suppression of glutamate release is readily induced at activated MC–GC synapses and also spreads to other MC–GC synapses in the neighborhood. In this respect, we finally investigated to what extents given GC spines were surrounded with respective neural elements by 3D reconstruction of 57 GC spines (Fig. 10). In all spines analyzed, each formed asymmetrical synapses with a single MC terminal on the spine head (Sp-1 with MCT-1 and Sp-2 with MCT-2) (Fig. 10A,B). Moreover, the head and neck portions of GC spines were nonsynaptically contacted by other MC terminals making synaptic contacts with other GC spines in the neighbor (Fig. 10A,B, between Sp-1 and MCT-2). As shown in Figure 10D, 80.7% of GC spines had such nonsynaptic contacts with one to three MC terminals. GC spines were also contacted nonsynaptically by inhibitory terminals, nonterminal axons of undefined origins, dendritic spines and shafts, and glial processes (Fig. 10A,C).

Serial electron microscopic analysis for subcellular elements contacting to GC spines. A, B, Four serial electron micrographs showing two adjacent MC–GC synapses (A) and their 3D reconstructed images (B). Two GC spines, Sp-1 and Sp-2, are innervated by MC terminal MCT-1 or MCT-2, respectively (black arrowheads in A, red regions in B). Note that Sp-1 is also contacted nonsynaptically by MCT-2 (white arrowheads in A, white dashed line in B). Each spine is also contacted by nonterminal axons (Ax) and glial elements (Gl). C, GC spines (Sp) are also contacted nonsynaptically by inhibitory terminals (InT) forming symmetrical synapses (arrow) onto dendritic shafts (Dn). D, Bar graph showing the frequency distribution of GC spines (n = 57) having nonsynaptic contact with zero, one, two, and three MC terminals. Note that the majority (80.7%) of GC spines contact with one to three noninnervating MC terminals. E, Bar graph showing the percentage of the total surface area of GC spines (n = 15) covered with presynaptic (Pre), postsynaptic (Post), and glial elements. The numbers and error bars indicate the mean percentage and SEM. N.D., Elements that could not be identified. A circular graph shows the percentage of GC spine surface area covered with respective presynaptic elements, i.e., innervating MC terminals, noninnervating MC terminals, InT, and Ax. Scale bars, 200 nm.
From 15 reconstructed GC spines, we calculated the coverage ratio; 58.2 ± 4.5% (mean ± SEM), 24.5 ± 3.5%, and 16.8 ± 3.7% of the total spine surface were covered with presynaptic, postsynaptic, and glial elements, respectively (Fig. 10E, bar graphs). Presynaptic elements contacting GC spines were MC terminals innervating the spine (19.0 ± 2.2% of the total spine surface), noninnervating MC terminals (12.2 ± 3.5%), inhibitory terminals (3.5 ± 2.3%), and nonterminal axons (23.5 ± 3.8%) (Fig. 10E, circular graph). Thus, GC spines are commonly contacted by noninnervating MC terminals, whereas glial elements only cover one-sixth of the total spine surface.
Discussion
2-AG synthesized by DGLα plays a major role in eCB-mediated retrograde signaling at various synapses in the brain (Gao et al., 2010; Tanimura et al., 2010). However, it has been controversial as to the role of 2-AG or DGL in eCB-mediated retrograde suppression at MC–GC synapses (Chiu and Castillo, 2008). In the present study, we have demonstrated that DSE and its enhancement by group I mGluR activation were abolished in DGLα-knock-out mice (Fig. 1), indicating that 2-AG produced by DGLα mediates these forms of short-term plasticity. Furthermore, we have disclosed the arrangement of molecules for 2-AG-mediated retrograde signaling at MC–GC synapses, and the main findings are illustrated in Figure 11.

The molecular–anatomical configuration of 2-AG-mediated retrograde signaling and cross talk at MC–GC synapses in the dentate gyrus. The molecular–anatomical configuration of 2-AG-mediated signaling at MC–GC synapses includes (1) wide distribution of DGLα in dendritic spines and shafts of GCs with the highest accumulation at the spine neck portion, (2) accumulation of CB1 in the terminal portion of MC axons, (3) spatial proximity among MC–GC synapses that causes frequent contact of GC spines to other MC terminals making synaptic contacts with other GC spines, and (4) incomplete surrounding of GC spines by MGL-expressing elements (astrocytes and some inhibitory terminals). These characteristics provide the framework fundamental to 2-AG-mediated retrograde signaling and also suggest 2-AG-mediated intersynaptic cross talk among local MC–GC synapses. This molecular–anatomical configuration will be important to adjust network activity in the dentate gyrus after enhanced excitability.
Molecular–anatomical configuration for 2-AG-mediated retrograde signaling
Katona et al. (2006) first reported the expression of DGLα in GC spines. In the present study, we confirmed this result and also revealed its distribution in dendritic spines and shafts with the highest density at the spine neck portion (Fig. 4). The spine neck accumulation of DGLα matches with its close but nonoverlapping patterns with F-actin and mGluR5 (Fig. 3H,I). Such spine neck accumulation is also found in cerebellar Purkinje cells (Yoshida et al., 2006). As the spine head is the site for the formation of glutamatergic synapses and for the accumulation of ionotropic and mGluRs in principal neurons (Harris and Kater, 1994), activation of these glutamate receptors will trigger DGLα-mediated 2-AG synthesis at around the neck portion of activated GC spines. This leads to 2-AG-mediated retrograde suppression of glutamate release, as we have shown electrophysiologically (Fig. 1). When synaptic activation is further enhanced by repetitive stimuli, the site of 2-AG synthesis will extend to dendritic shafts, because dendritic shafts of principal neurons are also provided with a complete set of molecular machineries for 2-AG synthesis, i.e., mGluR5, Gαq/11, phospholipase Cβ1, and DGLα (Tanaka et al., 2000; Fukaya et al., 2008; Yamasaki et al., 2010). Considering that dendritic shafts of principal neurons are the major site for inhibitory synapse formation, 2-AG synthesis at dendritic shafts will favor DSI. Therefore, molecular machinery for 2-AG synthesis is well orchestrated in dendritic shafts and spines of GCs.
On the other hand, CB1 expression in most MC terminals was revealed by immunofluorescence and immunogold electron microscopy (Figs. 5, 6). This is consistent with a previous study showing intense expression of CB1 mRNA in MCs and high degrees of coexpression of CB1 and VGluT1 in the MC-recipient molecular layer (Monory et al., 2006). We also revealed that CB1 was distributed in MC axons with a gradient toward the terminal portion. The spine neck accumulation of DGLα in GC spines and the terminal accumulation of CB1 in MC axons will be an important molecular–anatomical basis for the organization and promotion of 2-AG-mediated retrograde suppression of this excitatory recurrent synapse (Fig. 11).
Molecular–anatomical configuration for 2-AG-mediated local cross talk
In addition to the above arrangement of DGLα and CB1, the following facts will also predict 2-AG-mediated cross talk among local synapses in the MC-recipient molecular layer of the dentate gyrus.
Although molecular mechanisms for 2-AG reuptake across the cell membrane remain unclear (Hermann et al., 2006), MGL is established as the major enzyme involved in the subsequent degradation and termination of 2-AG-mediated retrograde signaling (Hashimotodani et al., 2007a; Pan et al., 2009; Schlosburg et al., 2010). In the inner molecular layer, we detected MGL in astrocytes and some inhibitory terminals (including both CB1-expressing and nonexpressing terminals), but not in MC terminals or GC spines (Figs. 8, 9). The specificity of immunohistochemical labeling for MGL was validated by blank immunohistochemistry in MGL-knock-out mice. The lack of MGL immunolabeling in MC terminals is also consistent with the lack of detectable MGL mRNA in MCs (Fig. 7). Furthermore, MGL expression in astrocytes is consistent with a previous study using cultured astrocytes (Walter et al., 2004). Therefore, in the MC-recipient molecular layer, MGL-mediated degradation of 2-AG should be conducted by astrocytes and some inhibitory terminals to restrict the spatial and temporal extents of 2-AG-mediated retrograde suppression in local areas. However, astrocytes and inhibitory terminals only covered 16.8 and 3.5% of the total surface of GC spines, respectively (Fig. 10). This suggests that, within short-range distances, 2-AG released from a given GC spine will readily escape from enzymatic degradation by MGL and can reach and bind its neighboring structures expressing CB1, most likely other MC–GC synapses. In the hippocampal CA1 and CA3, MGL is expressed not only in inhibitory terminals but also in excitatory terminals innervating pyramidal cells (Gulyas et al., 2004). In the present study, we confirmed this and also clarified MGL expression in astrocytes of the CA1 region (Fig. 8K–N). Therefore, MC–GC synapses are less surrounded by MGL-expressing elements than pyramidal cell synapses. This different milieu is mainly caused by the lack of MGL expression in MC terminals, will prolong the half-life of 2-AG, and will increase its spread in the MC-recipient molecular layer of the dentate gyrus. In this regard, we also need to consider possible participation of other degrading enzymes, such as α/β-hydrolases 6 and 12 (Blankman et al., 2007), although their functional contribution to 2-AG degradation appears much lower than MGL (Straiker et al., 2009; Marrs et al., 2010).
Moreover, our data from the serial electron microscopy have demonstrated that a given GC spine was not only innervated by a single MC terminal but also contacted nonsynaptically by one to three MC terminals that make synapses with other GC spines. There was only a narrow extracellular space between such GC spines and noninnervating MC terminals (Fig. 10). This molecular–anatomical configuration strongly suggests that, once liberated from activated GC spines, 2-AG is readily accessible not only to the activated MC terminal but also to nearby MC–GC synapses by escaping from enzymatic degradation (Fig. 11). This will cause 2-AG-mediated cross talk to local CB1-expressing synapses in the MC-recipient molecular layer, most likely other MC–GC synapses.
Functional relevance of 2-AG-mediated retrograde signaling and cross talk in the MC-recipient molecular layer
Such an eCB-mediated intersynaptic cross talk has been shown to occur in the hippocampal CA1; depolarization of a postsynaptic neuron induces DSI not only in the depolarized neuron, but also in nondepolarized neurons, if the depolarized neuron is apart <20 μm (Wilson and Nicoll, 2001). In contrast, in the cerebellum, synaptically evoked eCB-mediated DSE is confined to activated parallel fiber–Purkinje cell synapses (Brown et al., 2003; Brenowitz and Regehr, 2005). The limited cross talk in Purkinje cell synapses is likely attributable to complete synaptic coverage by Bergmann glia (Palay and Chan-Palay, 1974; Spacek, 1985) and high MGL contents in parallel fiber terminals (Gulyas et al., 2004). Thus, the extent of 2-AG-mediated intersynaptic cross talk (or input specificity) may vary from synapse to synapse depending on the constellation of 2-AG-mediated signaling molecules around synapses and the anatomical organization of presynaptic, postsynaptic, and glial elements. In this regard, our findings in the present study suggest that MC–GC synapses are more prone to 2-AG-mediated intersynaptic cross talk than pyramidal cell synapses in the hippocampus. This needs to be tested in future studies.
MCs are highly excitable, albeit subject to synaptic inhibition (Buckmaster and Schwartzkroin, 1994). Recurrent circuits from MCs to GCs are positioned between the entorhinal cortex and the hippocampal CA3, and are thought to regulate the excitability of the limbic system (Ratzliff et al., 2002). Furthermore, poor astrocytic coverage suggests that MC–GC synapses are also prone to glutamate spillover to neighboring synapses (Oliet et al., 2004). On one hand, these anatomical and physiological properties should be advantageous to normal hippocampal function, but on the other hand, the very same features might render these neurons and circuits hyperexcitable and vulnerable to excitotoxicity. 2-AG-mediated retrograde signaling and local cross talk at MC–GC synapses may contribute to suppressing the excitability of GCs and prevent seizures. When network activities are also increased, such cross talk could involve CB1-expressing inhibitory synapses, and the resultant DSI may increase seizure susceptibility and deteriorate the status epilepticus. Thus, it seems likely that MC–GC synapses are so constructed to permit, or even facilitate, 2-AG-mediated retrograde signaling and cross talk to adjust the excitability of this epileptogenic circuit (Ratzliff et al., 2002).
Footnotes
-
This work was supported by Grants-in-Aid for Scientific Research (19100005 to M.W., 21220006 to M.K., 21300118 to K.S., 20-04030 to M.U.) and by the Strategic Research Program for Brain Sciences (Development of Biomarker Candidates for Social Behavior) and the Global COE Program (Integrative Life Science Based on the Study of Biosignaling Mechanisms) provided by Ministry of Education, Culture, Sports, Science and Technology, Japan. M.U. is a recipient of research fellowships from the Japan Society for the Promotion of Science for Young Scientists. We thank Taisuke Miyazaki for helpful comments.
- Correspondence should be addressed to Masahiko Watanabe, Department of Anatomy, Hokkaido University School of Medicine, Sapporo 060-8638, Japan. watamasa{at}med.hokudai.ac.jp


