

Abstract
During a wide variety of behaviors, hippocampal field potentials show significant power in the theta (4–12 Hz) frequency range and individual neurons commonly phase-lock with the 4–12 Hz field potential. The underlying cellular and network mechanisms that generate the theta rhythm, however, are poorly understood. Oriens-lacunosum moleculare (O-LM) interneurons have been implicated as crucial contributors to generating theta in local hippocampal circuits because of their unique axonal projections, slow synaptic kinetics and the fact that spikes are phase-locked to theta field potentials in vivo. We performed experiments in brain slice preparations from Long–Evans rats to investigate the ability of O-LM cells to generate phase-locked spike output in response to artificial synaptic inputs. We find that O-LM cells do not respond with any preference in spike output at theta frequencies when injected with broadband artificial synaptic inputs. However, when presented with frequency-modulated inputs, O-LM spike output shows the ability to phase-lock well to theta-modulated inputs, despite their strong low-pass profiles of subthreshold membrane impedance. This result was dependent on spike refractory dynamics and could be controlled by real-time manipulation of the postspike afterhyperpolarization. Finally, we show that the ability of O-LM cells to phase-lock well to theta-rich inputs is independent of the h-current, a membrane mechanism often implicated in the generation of theta frequency activity.
Introduction
The mechanisms by which the 4–12 Hz theta rhythm is generated in hippocampus remain unclear. The traditional in vivo model is that hippocampal theta is imposed by rhythmic input from the medial septum and diagonal band of Broca (Bland and Oddie, 2001). However, detailed in vivo recordings from septum and hippocampus (King et al., 1998; Nerad and McNaughton, 2006) suggest that hippocampal theta is not simply paced by the septum. Furthermore, under the appropriate pharmacological conditions, hippocampal brain slices can generate in vivo-like theta activity autonomously (Gillies et al., 2002). The hypothesis of intrinsically generated theta is strengthened by more recent recordings from isolated hippocampus (Goutagny et al., 2009), data suggesting that individual layers of hippocampus contain independent theta generators (Montgomery et al., 2009; Shirvalkar and Bahar, 2009) and that some hippocampal interneurons display subthreshold oscillations (Morin et al., 2010).
Much of the work on intrinsically generated hippocampal theta has focused on the contributions of interneurons (Cobb et al., 1995; Klausberger et al., 2003; Rotstein et al., 2005; Goldin et al., 2007). In particular, oriens-lacunosum moleculare (O-LM) cells of the hippocampus have been suggested to contribute to the local theta rhythm by providing theta-frequency inhibition to principal cells (Pike et al., 2000; Gloveli et al., 2005b) or by providing slower inhibition onto basket cells and principal cell distal dendrites (Gillies et al., 2002; Rotstein et al., 2005). A common assumption has been that O-LM cells are intrinsic theta oscillators (Pike et al., 2000; Gillies et al., 2002; Gloveli et al., 2005b; Rotstein et al., 2005) and thus, that intrinsic membrane conductances, especially the h-current (Maccaferri and McBain, 1996), contribute to theta-frequency subthreshold oscillations and spike discharge. While it has been shown that O-LM cell spikes phase-lock to the theta rhythm in vivo (Klausberger et al., 2003) and can generate spike rates within the theta range in vitro (Gillies et al., 2002; Gloveli et al., 2005a; Goldin et al., 2007), the ability for O-LM cells to resonate or generate pace-making activity at theta has not been shown. Last, it is not well understood how spiking and subthreshold membrane dynamics interact and influence spike output in O-LM cells.
In the present study, we investigated the ability of O-LM cells to generate oscillatory spike activity in response to either unmodulated or sinusoidally modulated artificial synaptic activity. We were particularly interested in the biophysical mechanisms leading to patterned spike output in response to modulation of synaptic activity at theta frequencies. We find that O-LM cell spiking does not produce autonomous or pace-making activity at theta frequencies in response to unmodulated inputs. Instead, we find that O-LM cells support a modest amplification of inputs modulated at theta frequencies due to specific refractory dynamics associated with the spike afterhyperpolarization (AHP). These dynamics amplify spike output at 8 Hz to a greater extent than would be expected from subthreshold membrane voltage responses. Our data suggest that intrinsic biophysical properties of O-LM cells can potentially transmit network theta activity but do not themselves generate theta oscillations.
Materials and Methods
Electrophysiology.
All protocols were approved by the University of Utah Institutional Animal Care and Use Committee. Brain slices were prepared using established techniques (Netoff et al., 2005). Briefly, young (postnatal d 18–28) Long–Evans rats of either sex were anesthetized using isoflurane and decapitated. The brain was removed rapidly and placed in a beaker of ice-cold, oxygenated artificial CSF containing (in mm): 125 NaCl, 2.5 KCl, 1.25 NaH2PO4, 2 CaCl2, 1 MgCl, 25 NaHCO3, 25 d-glucose. The pH was maintained at 7.4 by saturation with 95% O2-5% CO2. The brain was dissected down to a block of tissue containing the region of interest. A vibrating microtome was used to cut slices, 350–400 μm thick, in the horizontal plane. Slices were incubated at 32°C for at least 30 min and 30 min at room temperature before use.
All recordings were performed in the CA1 region of the hippocampus and performed at 35°C. O-LM cells were identified under differential interference contrast optics based on the location of the cell body in stratum (str.) oriens and the presence of horizontally extending dendrites. Subsequent unequivocal identification of O-LM cells was based on post hoc morphological analysis but cells were preliminarily identified based on AHP shape and membrane voltage “sag” in response to a strong hyperpolarizing current step.
Cells were patched with 4–6 MΩ glass pipettes filled with internal solution that contained (in mm): 120 K-Gluconate, 20 KCl, 10 HEPES, 0.2 EGTA, 2 MgCl2, 4 Na2-ATP, 0.3 Tris-GTP, 7 di-tris-phosphocreatine and 0.6% biocytin by weight. Pipettes were connected to the headstage of an amplifier (MultiClamp 700B, Molecular Devices) set in “bridge” mode to obtain current-clamp recordings. Bridge balance correction was used for all recordings and a criterion based on resting membrane voltage (< −50 mV) and spike height (overshooting 0 mV) was used to identify healthy O-LM cells.
In all recordings, series resistances were <15 MΩ. O-LM cells have relatively high membrane resistance (>250 MΩ) and injected currents were small (<100 pA) mitigating any potential problems associated with series resistance and the implementation of dynamic clamp. Input resistance, resting potential, and capacitance compensation settings were continually monitored. Recordings were not corrected for the junction potential. All recordings were done in the presence of 10 μm DNQX (Sigma-Aldrich) and 50 μm picrotoxin (Sigma-Aldrich) to block endogenous synaptic activity. Synaptic block did not cause a significant change in the resting membrane resistance (control, 262 ± 155 MΩ; synaptic block, 246 ± 80 MΩ, p = 0.70, n = 6, Kruskal–Wallis test).
Dynamic clamp and recordings.
For dynamic clamp experiments, the current-clamp amplifier was driven by an analog signal from an x86 personal computer running Real-Time Application Interface Linux and an updated version of the Real-Time Linux Dynamic Clamp called Real-Time Experimental Interface (Dorval et al., 2001; Bettencourt et al., 2008). The dynamic clamp system update rate and data acquisition rate were both 5 kHz. A custom protocol was developed to generate two separate Poisson processes representing excitation and inhibition. Individual excitatory and inhibitory synaptic conductance waveforms were modeled as a difference-of-exponentials function with a rise time of 0.5 ms and decay time of 6.8 ms, which is within the range of normal values for GABAergic synapses (Netoff et al., 2005) and accounts for the fact that O-LM cells receive predominantly slower, kainate-based excitation (Goldin et al., 2007). Reversal values for the excitatory and inhibitory synaptic conductances were 0 and −80 mV, respectively. Conductance injection is different from traditional current injection in that it is a voltage-dependent process. Thus, rather than injecting a fixed current waveform, the injected current is subject to modification depending on the voltage of the target cell in the same manner that a biological synapse depends on postsynaptic voltage.
Synaptic input frequency modulation was modeled as a modulation of the Poisson rate of the inhibitory process. Frequency modulation was 20% in all cases. This was implemented by sinusoidally modulating the rate of generation of events by the Poisson process from 0.8 to 1.2 times the baseline rate. To represent the ensemble of activity from numerous slow firing individual synapses onto O-LM cells, the rates of excitation and inhibition were set to 500 and 1000 Hz, respectively (Paré et al., 1998; Destexhe and Paré, 1999). These frequency values also produced an approximate net balance in the excitatory and inhibitory currents such that the turning on of the Poisson stimulus kept cells near the threshold voltage for spiking at low rates. The amplitude of single events was adjusted on a per cell basis to achieve ∼3 mV SDs in the fluctuation of the membrane voltage. When required, small amounts of DC current were used to achieve an approximate firing rate of 2.5 Hz in all cells. A protocol to control spike rate automatically was adapted from existing code found at http://www.rtxi.org/topics/modules/.
Artificial h-current (Ih) was added with a separate dynamic clamp model using a first order differential equation described by the following equations:


 Parameters were as follows: τpeak = 150 ms, Vhalf = −75 mV, k = −8, and EIh = −20 mV, τmid = −50 mV, and τmin = 0.1.
We manipulated the spike AHPs by injecting a spike-triggered current that was modeled as a difference-of-exponentials function. After spikes had been detected, a 1 ms delay was observed until the start of the AHP, at which point a difference-of-exponentials waveform was injected and tuned to qualitatively alter the AHP in the desired manner. These waveforms had peak injected currents ranging between 20 pA and 40 pA. The rise times of the AHP manipulating waveform was set to 10 ms and the decay time to 50 ms.
Reconstructions.
All recordings of O-LM cells were done with intracellular pipette solution containing 0.6% biocytin (Invitrogen) by weight. Cells were allowed to passively fill with biocytin for at least 1 h before they were fixed in 4% paraformaldehyde. To visualize neurons, slices were washed 3 times for 15 min in 0.1 m PBS and then incubated for 2–4 h in a solution containing 1 mg/ml streptavidin-Alexa Fluor 488 or 532 (Invitrogen) and 0.75 ml/100 ml Triton X-100 (Sigma-Aldrich) in PBS. After another 3 washes for 15 min each in PBS slices were mounted on microscope slides in Mowiol. Slides were imaged on a custom built 2-photon microscope. Image stacks were processed with ImageJ (NIH) and processes were traced with the Neuromantic (http://www.reading.ac.uk/neuromantic/) tracing software. O-LM cells were characterized on the basis of horizontally oriented dendrites relative to str. pyramidale with cell bodies in str. oriens. Furthermore, we required that identified O-LM cells have axons passing through str. pyramidale and radiatum and branching in str. lacunosum moleculare. Only cells with this characteristic morphology were included in the study.
Analysis.
Analysis was done in MATLAB (The MathWorks) with custom scripts. Spike times from traces of identified O-LM cells were extracted from voltage traces and spike trains were converted to binary trains. A power spectral density was computed from binary spike trains to determine power in the spike train at each frequency between 0 and 100 Hz using the spectrum.welch function in MATLAB. FFT length was chosen such that resulting power spectra had integer frequencies falling exactly on bin centers. To quantify the relative amount of spike power at the modulation frequency, we took the ratio of the peak power at the modulation frequency divided by the mean steady-state power (power at 0 Hz). We refer to this quantity as the power ratio.
Subthreshold impedance (Z(f)) was assessed using the membrane voltage response to a white noise current stimulus. Impedance was defined as the ratio of the absolute magnitudes of the FFT of voltage traces and current input:
 The amount of resonance was quantified using a “Q-value,” which was defined as the maximum impedance value divided by the average impedance value between 1.5 and 2 Hz. For measures of spike train power spectra and vector strength we used 300 s traces (∼750 spikes) of spike train data in response to artificial synaptic stimuli. For assessment of impedance, we used 30 s traces of membrane voltage response to a white noise stimulus.
Vector strength was computed using tools from the Circular Statistics Toolbox in MATLAB (Berens, 2009). Vector strength is the summed normalized vector length of circular data and provides a measure of phase-locking of a series of spiking events relative to an ongoing oscillation.
When datasets were found to be non-normally distributed based on the Lilliefors test, we used nonparametric statistical tests to compute significance values. For datasets of equal size we used the Kruskal–Wallis test (the nonparametric version of a one-way ANOVA). When datasets were of unequal size we used the Wilcoxon rank-sum test (the nonparametric version of a two-sample t test). When multiple comparisons were performed, the threshold for significance was adjusted according to α = 1 − (1 − α0)n, where α0 is the default significance level of 0.05 and n is the number of comparisons. Plots were prepared for publication in Inkscape (inkscape.org).
Modeling.
A simple computational model was constructed with equations described by Izhikevich (2004). The equations were:

 with the reset condition:
 and parameters a = 0.03, b = 0.25, c = −60, d = 4. The computational model was implemented using the dynamic clamp software and the exact same protocols used in experimental recordings were used to drive activity in the model. Specifically, artificial synaptic fluctuations were generated identically to the experimental setup with the maximal conductance parameters for individual excitatory and inhibitory events adjusted to achieve the same 10 mV peak to peak voltage fluctuations as in the experimental data. Spike rate was controlled and kept at 2.5 Hz. AHP attenuating/enhancing currents were generated identically to the experimental data by using a difference-of-exponentials waveform with rise and fall kinetics of τrise = 10 ms and τfall = 50 ms. Measures of spike analysis and power ratio in the model were performed in the same way as for experimental data.
The NMDA conductance was implemented with the same equations as the other synaptic inputs but with kinetics of τrise = 5 ms and τfall = 150 ms and with voltage-dependent Mg2+ block modeled as described previously (Fernandez and White, 2008) using a published set of parameters (Harsch and Robinson, 2000) and the equation:
 with Vhalf = −10 and k = 12. GABAB was model with the same equation as GABAA using kinetics of τrise = 170 ms and τfall = 3400 ms (Pfrieger et al., 1994).
Results
Anatomical and electrophysiological identification of O-LM cells
O-LM cells possess a distinct anatomy among hippocampal interneurons (Freund and Buzsáki, 1996) that suggests a unique functional role and provides a convenient feature by which they can be unambiguously identified. O-LM cells are named after their somatic location and axonal projection pattern. The cell body and dendrites are found in the stratum oriens, often close to the alveus, while the axon projects to the stratum lacunosum-moleculare (Lorente De Nó, 1934). Given this unique structure, visual identification of O-LM cells is straightforward when the dendritic, and particularly axonal, morphologies are visualized. Due to the diversity of interneurons in the hippocampus (Freund and Buzsáki, 1996), we anatomically identified all cells to ensure recordings were from the appropriate cell type. Figure 1, A and B, shows two representative O-LM cells. Hippocampal lamina are labeled and delimited by dotted black lines. Projections in gray denote dendrites and are restricted to str. oriens (Fig. 1). Axons are traced in black and arborize in str. oriens, and more extensively in str. lacunosum-moleculare (Fig. 1). In general, cells show minimal axonal branching in str. radiatum; the axon nearly completely traverses the pyramidal cell layer and str. radiatum, a distance of several hundred micrometers, before extensively branching in str. lacunosum-moleculare (Fig. 1A,B). The example cell shown in Figure 1A has recurrent axonal collaterals that can be seen branching in str. pyramidale to project back to str. oriens (black star).

Reconstructed O-LM cells show characteristic anatomical and electrophysiological features. Str., Stratum, term for hippocampal lamina; Pyr., pyramidale, layer that contains pyramidal cell bodies; Rad., radiatum. A, An example O-LM cell with extensive axonal branching in str. LM. Lamina are delimited with black dotted lines. Axons are drawn in black and dendrites in light gray. Cell bodies are drawn in medium gray and lie in str. oriens. Main axon (black) is seen traversing str. pyramidale and radiatum before arborizing. A recurrent axonal collateral returns to arborize in str. oriens (black star). B, Additional example O-LM cell. An axon is seen traversing the hippocampal lamina until it branches in str. LM. Dendrites project parallel to the pyramidal cell layer. A recurrent axonal collateral again branches off of the axon early and returns to arborize in str. oriens. C, Example O-LM cell response to step current injection. Sag potential is visible with larger hyperpolarizing current injection. D, Subthreshold impedance profile of O-LM cells at −70 mV (n = 8). Notably, no subthreshold resonance is visible and the impedance profile is low pass. Inset, The ratio between the impedance at 2 Hz and 8 Hz (theta ratio) highlights the lack of subthreshold resonance. Individual dots represent individual cells. The mean ratio value was 0.7 ± 0.03 SEM.
We used current step injections and subthreshold impedance analysis to identify O-LM cells electrophysiologically. The profile of O-LM cells in response to hyperpolarizing current steps showed a characteristic sag in membrane voltage (Fig. 1C). Significant hyperpolarization, however, was required to elicit a visible sag in the voltage response. This indicated a relatively hyperpolarized voltage for activation of the h-current, the mechanism responsible for producing a sag in membrane voltage. Next, we measured the impedance profile by injecting white current noise into O-LM cells at near-threshold potentials. In agreement with more recent findings measuring impedance and the h-current activation voltage in O-LM cells (Zemankovics et al., 2010), we found no resonance peak in our impedance measurement (Fig. 1D, n = 8).
To quantify the responsiveness of O-LM cells to theta frequencies in the subthreshold voltage range, we measured the relative impedance between a slow-frequency response (2 Hz) and a theta range response (8 Hz). The ratio of impedance at these two frequencies (Fig. 1D inset, theta ratio) indicated that O-LM cells strongly attenuated the theta response compared with slower frequencies (mean ratio value of 0.71 ± 0.01). The impedance values at 2 Hz (320 ± 13 MΩ) and 8 Hz (220 ± 8 MΩ) were significantly different (n = 8, p < 0.04). Thus, rather than amplify theta inputs, subthreshold properties in O-LM cells near threshold have no resonance at theta and greatly reduce the size of membrane voltage fluctuations with frequency components >5 Hz. The absence of a peak at theta and the relative low-frequency cutoff of the O-LM cell response are likely due to an absence of h-current activation near threshold.
O-LM cells do not show theta spiking in response to artificial synaptic input
Results in Figure 1 and those from other groups using similar analyses have shown little subthreshold resonance at theta in O-LM cells. Instead, ideas attributing a pace-making role in theta generation have stemmed from studies measuring spike rate. The reported tendency of O-LM cells to fire at spike rates within theta frequencies in vitro (Maccaferri and McBain, 1996) has been used to conclude that O-LM cells are endogenous theta oscillators that pace network activity (Pike et al., 2000; Gloveli et al., 2005a; Goldin et al., 2007). A distinct role for O-LM cells in generating hippocampal theta field potentials has emerged from network modeling studies incorporating the aforementioned ability for O-LM cells to fire at a steady rate of ∼10 Hz in slices (Gloveli et al., 2005a; Rotstein et al., 2005; Tort et al., 2007). The implication from previous work is that O-LM cells, as endogenous oscillators, should discharge preferentially at theta frequencies when presented with broadband artificial synaptic input as in other theta-rhythmic cells (Fernandez and White, 2008). We used a dynamic clamp system (Dorval et al., 2001; Bettencourt et al., 2008; http://www.rtxi.org) to provide conductance-based synaptic inputs into O-LM cells. Importantly, the artificial synaptic input resulted in significant membrane voltage fluctuations that simulated conditions prevalent in vivo and which drove spikes via brief excursions in membrane voltage similar to in vivo conditions (Crochet and Petersen, 2006; Destexhe and Contreras, 2006). Finally, using this form of stimulation allowed a time varying modulation of the synaptic input rate.
To be consistent with in vivo recordings from O-LM cells (Klausberger et al., 2003), we held average spike rate at 2.5 Hz. The low firing rate has several important implications. First, any theta-frequency peak observed in the cell spike train power spectrum is due to an intrinsic oscillatory dynamic that is able to cluster spikes at theta. Thus, rather than simply firing at a mean rate of theta all the time, which many cells are capable of, the cell actively generates interspike intervals (ISIs) at theta. Second, imposing a low average firing rate allowed moderate variance in the input to achieve the desired values of spike time variability observed in numerous in vivo recordings (Smith and Smith, 1965; Calvin and Stevens, 1968; Noda and Adey, 1970; Softky and Koch, 1993; Holt et al., 1996; Shadlen and Newsome, 1998; Harvey et al., 2009). The low average spike rate still allows for potential epochs of theta to occur in response to the synaptic stimulus but does not bias the cell to fire only in the theta range at a constant spike frequency and with low spike time variability.
To quantify a potential oscillatory output in response to broadband and unmodulated synaptic input, we used the power spectrum of the spike train. Quantification of oscillatory properties using the spike train is important since only the spike train information, and not the membrane voltage, is likely to propagate to postsynaptic cells. Thus, the spike train power spectrum represents the actual output quantity that needs to be oscillatory if the cell is to behave as a pacemaker in a network.
The amplitude of individual events in the input train was adjusted such that the SD of the membrane fluctuations in the near-threshold range was near 3 mV, consistent with subthreshold voltage variability values reported in vivo (Paré et al., 1998; Destexhe et al., 2003; Fellous et al., 2003). The rate of synaptic inputs onto O-LM cells was chosen to maintain membrane voltage near threshold and produce the desired size in voltage fluctuations to drive spiking. O-LM cell spike trains recorded in response to artificial synaptic stimulation (Fig. 2A) did not generate any peak in spike train power or ISI distribution at theta frequencies (Fig. 2C,D, black traces). In all O-LM cells tested, we observed the same outcome (n = 8).

O-LM cells do not discharge with any frequency preference when driven with either conductance or current noise. We recorded from O-LM cells in the fluctuation-driven spiking regime. We compared spiking output of a single O-LM cell injected either with conductance noise or current noise. A, An example voltage trace (top trace) when an O-LM cell was given conductance noise inputs (bottom trace). Dotted line denotes average membrane potential (−50 mV). With conductance inputs, large deflections in the input current occur because of changes in the driving force term when spiking occurs (bottom trace). B, The same cell when given synaptic current noise. Spike rate was kept constant across both input types. C, Comparison of normalized ISI distributions for current (gray line) and conductance (black line) input into an O-LM cell. ISI distributions are histograms normalized to have unit area under them and plotted as line graphs. Excepting stochastic variations, the two ISI distributions appear qualitatively the same implying that the spiking response of O-LM cells was the very similar for each type of input. Inset, Average AHPs from a single O-LM cell spiking in the fluctuation driven regime. The AHP is similar between current and conductance inputs. D, Comparison of power spectra of the spike trains. Power spectra are computed from binary spike trains and are very similar between input types. Notably, neither power spectrum shows any clear peak in the theta range (gray box, 4–12 Hz).
We considered the possibility that the conductance component associated with the artificial synaptic activity was attenuating potential oscillatory dynamics, as has been reported for medial entorhinal cortical stellate cells (Fernandez and White, 2008). To test for this possibility, we repeated our recordings with current-based artificial synaptic stimulation (Fig. 2B). Hence, similar levels of voltage fluctuations were used to generate spikes without adding a mean conductance to the O-LM cell membrane. Under these conditions, O-LM cells continued to show no signs of oscillatory output in the spike train power spectra or the ISI distributions (Fig. 2C,D, gray traces). Both spike train power spectra and ISI distribution data remained unchanged compared with conductance-based synaptic activity.
The above results indicate that given broadband synaptic drive, O-LM cells generate no pace-making or oscillatory output in the spike train. Thus, unlike strongly oscillatory cells (Fernandez and White, 2008), spike trains showed no preference for generating periods of interspike intervals at theta frequencies. These results suggest that O-LM cells have no intrinsic biophysical properties that endow them with a theta pace-making role in hippocampus.
O-LM cells follow 8 Hz-modulated synaptic input well
Although O-LM cells did not respond rhythmically when driven with broadband artificial synaptic stimuli, we reasoned that the cells might modulate spike output rate preferentially in response to a stimulus modulated at theta frequencies. Thus, O-LM cells, while not endogenous theta oscillators, could amplify, or at least effectively transmit, existing theta activity by responding well to synaptic input that is modulated at theta. A preference for modulating spike output rate in response to theta modulated inputs would constitute a form of spike resonance analogous to the well established subthreshold membrane resonance measured in several cell types (Alonso and Llinás, 1989; Hu et al., 2002). Theta spiking resonance in O-LM cells would be meaningful because it would suggest that O-LM cells could be involved in stabilizing extant theta activity.
To measure spiking resonance in O-LM cells we modulated the baseline Poisson rate of the inhibitory synaptic input train. Hence, the process determining the timing of inhibitory synaptic stimulus became an inhomogeneous Poisson process whereby the baseline rate of 1000 Hz, representing total summed inhibitory activity, was modulated at a set frequency. We used four physiologically meaningful frequencies for the modulation of the inhibitory process: 2, 8, 20, and 30 Hz. We modulated the Poisson rate of the inhibitory input train at 20%, a reasonable level given the strong phase modulation observed in O-LM and other hippocampal cells in vivo during ongoing theta rhythm in the field potential (Klausberger et al., 2003). As a consequence, the inhibitory Poisson rate was modulated from a trough of 800 Hz to a peak of 1200 Hz at the desired frequency (2, 8, 20, and 30 Hz). In all recordings, we continued to keep the cell's average firing rate near 2.5 Hz.
We used multiple measures to quantify the resulting spike rate modulation. These measures included ISI histograms, spike phase histograms in relation to the phase of the modulating input; and spike power spectra. In Figure 3, A and B, we provide an example of our analysis from a single cell for input modulation rates of 2 and 8 Hz.

O-LM cell spikes phase-lock to frequency modulated artificial synaptic conductance inputs. A, Voltage trace (top) of an O-LM cell given synaptic inputs (bottom) modulated by 20% at 2 Hz. Dotted line denotes mean voltage (−50 mV). Inset, 400 ms average after spike waveform reveals the injected oscillation. On average, spikes occurred around the depolarizing peak of the oscillation. B, Same as A, but with 8 Hz modulation. C, ISI histogram for 2 Hz modulation shows multimodality of the spiking intervals. A large cluster of spike times is visible around 2 and 2.5 Hz (the modulation frequency and mean spike rate, respectively) along with a peak at faster rates (black arrow). Since spike rate is constant there is an additional smaller peak at lower frequencies which compensates for fast ISIs to maintain a constant mean rate. Inset, Phase histogram of spike times in an example cell shows a high degree of phase locking. Phases are defined relative to the cosine modulation wave. D, Spike power spectrum of the voltage trace in A. The peak power is at the modulation frequency along with a second smaller peak at higher frequencies. E, ISI and phase histograms for the spike train shown in B. Largest peak is at the modulation frequency with subsequent peaks at subharmonics. Inset, Phase histogram of spike times shows a high degree of phase-locking. F, Spike power spectrum of the trace in B shows large peak at the modulation frequency of 8 Hz and no other major peaks.
When ISI histograms were plotted from these examples, clear peaks emerged showing that the cell preferred certain interspike intervals over others in its output (Fig. 3C,E). With 2 Hz modulation, bimodality was evident in the histogram (Fig. 3C, black arrow). The sharp distribution at smaller ISI values is a result of high-frequency spike discharge near the peak of the slow 2 Hz modulation. At 8 Hz input modulation multiple peaks emerge that are integer multiples of the 125 ms period associated with the 8 Hz modulator.
For the power spectra, a clear peak at the modulation frequency was present (Fig. 3D,F). Likewise, the spike phase histograms also indicated a large modulation of spike phase in response to modulated input (Fig. 3C,E, inset). To assess any potential preference in modulation frequency, we compared the average spike power spectra and spike phase histograms of the O-LM spike trains in response to a physiological range of modulation frequencies of the synaptic inhibitory Poisson rate (2, 8, 20, and 30 Hz, Fig. 4). Average power spectra indicated that peak power at 8 Hz modulation was larger than 2, 20, and 30 Hz (Fig. 4A). The relative amount of power at the modulation frequency was quantified by taking the peak power and dividing by the power at 0 Hz, which is directly proportional to the number of spikes in each trial. This measure was used as an estimate of the proportion of spike train power at the modulation frequency. We termed this quantity the power ratio. We compared this value for each of the modulation frequencies tested. Although the effect was modest, we found that modulation of synaptic input rates at 8 Hz generated the highest power ratio. The average power ratio for 2 Hz modulation was significantly lower than that at 8 Hz modulation (Fig. 4B, p = 0.02, n = 8). Additionally, 20 and 30 Hz modulation produced less power at their respective modulation frequencies when compared with 8 Hz (Fig. 4B, 8 Hz vs 20 Hz p = 0.001 and 8 Hz vs 30 Hz p = 0.0008). The lack of spike output modulation at 20 and 30 Hz in spike power spectra can be accounted for by the significant filtering that results from the membrane time constant at high frequencies.

O-LM cells phase-lock better to 8 Hz modulation than to 2 Hz modulation. A, Average power spectra were computed for all cells for each modulation frequency (2, 8, 20, 30 Hz, n = 8). Each panel shows the average power spectrum for one modulation frequency (error bars not shown for clarity). Power spectra are plotted on a log scale on the x-axis and thus the 2 Hz peak appears wider than the other peaks. All peaks have equivalent width. B, Group data in bar graph show that the average ratio of the modulation peak power to the zero frequency power is significantly higher for 8 Hz modulation than it is for 2 Hz modulation in O-LM cells indicating spiking resonance (p = 0.02, n = 8, subthreshold impedance for these same cells plotted in Fig. 1D). Error bars are SEM. Peaks at modulation frequencies of 20 and 30 Hz were also consistently lower than the 8 Hz peak (p = 0.001 and p = 0.0008 respectively). Inset, Comparison of normalized subthreshold (low pass) and spiking (bandpass) resonance profiles. Both resonance curves are computed from the same cells. Compared with the subthreshold regime a reduction in the 2 Hz resonance and an increase in the 8 Hz resonance are seen in the spiking regime. C, Representative phase histograms from a single cell. The diagrams suggest that O-LM cells phase-lock to 8 Hz modulation better than any other frequency tested. D, Vector strength analysis, a measure of phase-locking, of the same data shows no significant resonant peak (p = 0.24, n = 8). However, the vector strength profile is less strongly low-pass than the subthreshold impedance profile (compare Fig. 1D). E, Average ISI distributions for each modulation frequency. Each panel shows the average ISI distribution for one modulation frequency (n = 8, histograms normalized to have unit area). Note the bimodality in the 2 Hz histogram indicating the presence of high-frequency events. The 8 Hz modulation shows a prominent peak at the modulation frequency and subharmonics of that peak. The 20 and 30 Hz modulation show less structure in the ISI distributions and are shaped like biexponential functions with a fast rise and slower fall time.
As an additional measure of the quality of phase-locking, we constructed phase histograms for each dataset (Fig. 4C) and calculated the vector strength (Fig. 4D, see Materials and Methods) associated with the spike phase distribution. Power ratios (Fig. 4B) and vector strengths (Fig. 4D) are qualitatively similar, but in the case of vector strengths, the difference between 2 and 8 Hz was not significant (p = 0.24; theta ratio = 1.07 ± 0.02). It is unclear why the power ratio reported a slightly larger difference in modulation between 2 and 8 Hz than did vector strength. Regardless, we conclude that O-LM neurons pass 8 Hz modulated stimuli well, and may exhibit modest resonance at 8 Hz in response to modulated inputs.
The average ISI histogram across all cells for 2 Hz modulation (Fig. 4E, top) showed the same biomodality seen in the representative example (Fig. 3C, black arrow). This result indicates that ISI values were reliably split between two clusters, with the peak at 0.5 s (2 Hz) being the smaller of the two. On the other hand, the average ISI histogram for 8 Hz input modulation (Fig. 4E, second panel) has its largest peak at the modulation frequency (∼125 ms). Peaks in the ISI histograms are not clearly discernable with 20 or 30 Hz input modulation.
Although O-LM cells produced marginal spike resonance to theta frequency inputs, the spike output was nonetheless much more strongly modulated at theta frequency compared with the subthreshold membrane impedance. To illustrate this point, we compared the subthreshold membrane impedance and the spike power ratio across all frequencies. In essence, we compared the input-output transfer function of the spiking behavior with that of the subthreshold membrane voltage response. The low-pass characteristic of the subthreshold response differed qualitatively from the spiking response. The subthreshold membrane voltage filters the 8 Hz response such that the theta ratio is 0.71 ± 0.01 (Fig. 1D). In contrast to the subthreshold response, the spiking response of O-LM cells responded similarly to both 2 and 8 Hz inputs with a slight preference for 8 Hz inputs. Thus, the theta ratio calculated using either vector strength or power spectra was greater than one with values of 1.07 ± 0.02 (for vector strength) and 1.37 ± 0.05 (for power ratio).
Thus, by either measure, the spike train phase-locks surprisingly well to 8 Hz modulatory input, despite significant filtering at this frequency in the subthreshold voltage response.
In summary, we have shown that O-LM cells phase-lock well to 8 Hz stimuli, showing mild resonance as quantified by spectral analysis. Spike output was found to be filtered considerably less at 8 Hz than predicted by their subthreshold impedance. Together, these results indicate that theta-patterned inputs are unlikely to be substantially amplified by the intrinsic dynamics of O-LM cells, but that theta-band synaptic inputs are likely to be faithfully transmitted to their postsynaptic partners.
Ih block does not affect responses to 8 Hz-modulated inputs in O-LM cells
While we observed no subthreshold resonance in O-LM cells (Fig. 1D), we considered whether subthreshold membrane mechanisms, specifically the h-current, could influence the spike response properties. The h-current, mediated by HCN channels, is a hyperpolarization-activated cation current that is depolarizing in O-LM cells (Maccaferri and McBain, 1996). It has been linked to theta oscillations in the hippocampus because blocking it often reduces power in the field potential at theta in CA1 (Gillies et al., 2002) although complete genetic knock-outs of the associated ion channel, HCN1, can cause enhancements in theta power (Nolan et al., 2004; Hussaini et al., 2011). Additionally, its slower kinetics correlate with the theta network oscillation time scale (Rotstein et al., 2005). We proceeded to test whether blocking the h-current could change the spike output statistics of fluctuation-driven spiking.
We first tested whether h-current block with 20 μm ZD7288 would change the baseline response of O-LM cells to the unmodulated synaptic stimulus. As in control conditions, when the h-current was blocked we still observed no measurable peak in the power spectrum in the theta range (Fig. 5A, first two bars). Average power spectra from these recordings mirrored this conclusion and neither spectrum had a peak in the theta range (Fig. 5B,C, top).

Blocking the h-current does not affect phase-locking to theta-modulated inputs in O-LM cells. A, Bar graph shows different pharmacological conditions under which O-LMs cells were tested for spiking resonance. All bars represent the ratio of power at 8 Hz to the zero frequency power. The first bar shows control data using only unmodulated synaptic fluctuations as inputs. The second bar shows unmodulated synaptic fluctuations in the presence of 20 μm ZD7288. The first two bars both indicate a lack of a modulation peak at 8 Hz under those input conditions. The third bar shows synaptic inputs modulated at 8 Hz as in Figure 3B. The fourth bar shows synaptic inputs modulated at 8 Hz along with 20 μm ZD7288. The ratio value in the last bar is not significantly changed from the modulated conductance inputs alone (p = 0.61, n = 6). These results suggest that the h-current is not contributing to phase-locking to 8 Hz inputs. All error bars are SEM. B, Spike power spectra corresponding to the four bars showing the spike train power spectra under control conditions and with 8 Hz modulation. C, Spike power spectra corresponding to the second and fourth bars showing the spike train power spectra under control conditions and with 8 Hz modulation with 20 μm ZD7288 applied in both cases. Power spectra with peaks in power correspond to tall peaks in the bar graph. D–F, The spike AHP duration (D), amplitude (E), and resting membrane potential (F) are not significantly altered by 20 μm ZD7288 application (p = 0.83, p = 0.65 and p = 0.80 respectively, n = 6). G, The 20 μm ZD7288 was, however, effective at eliminating the sag potential associated with h-current. Sag was measured as the difference of the lowest point in the voltage and a steady-state voltage of −80 mV during a current step (p < 0.01, n = 6).
We next tested whether h-current block could change the phase-locking to 8 Hz modulated synaptic inputs. We found no significant difference between O-LM cells' ability to respond to 8 Hz modulated inputs with or without h-current block. Thus, the power spectrum peaks at 8 Hz were not changed significantly when ZD7288 was applied (Fig. 5A, last two bars, p = 0.18, n = 6; B,C, bottom). This again suggests that O-LM cells do not generate a significant peak in spike train power at theta in response to unmodulated synaptic stimuli and that this behavior is unchanged with bath application of ZD7288.
Previous studies have linked the ability of O-LM cells to spike at theta with the h-current because h-current block modifies the AHP, which in turn alters intrinsic excitability (Maccaferri and McBain, 1996). Hence, we compared the average AHP of O-LM cells between control and h-current blockade. We found no significant difference in either the absolute duration (Fig. 5D, p = 0.83) or amplitude (Fig. 5E, p = 0.65) of the AHP during fluctuation-driven spiking (n = 6 cells, averaged over ∼750 spikes per cell).
Average resting membrane potential did not change with ZD7288 (mean membrane potential in control: −50.0 ± 3.8 mV, 20 μm ZD7288: −49.4 ± 3.6 mV, p = 0.75, n = 6, Kruskal–Wallis test, Fig. 5F). Despite having little or no effect on spike train power spectrum, mean resting potential and AHP, 20 μm ZD7288 had a large effect on the membrane voltage sag resulting from strong hyperpolarization (p < 0.01, Fig. 5G). Thus the application of ZD7288 was effective in blocking the h-current in O-LM cells despite a lack of effect on spike output.
Overall, these results show that the h-current has little effect on spike output properties of O-LM cells under a regime where spikes are driven by membrane voltage fluctuations. The lack of effect on resting membrane potential, despite a large effect on membrane voltage sag response, likely occurs because the h-current is activated only in a strongly hyperpolarized region of membrane voltage. For this reason, the role of h-current is limited in the spiking regime.
Added “virtual” h-current with depolarized activation curves fails to produce theta power in the spike train
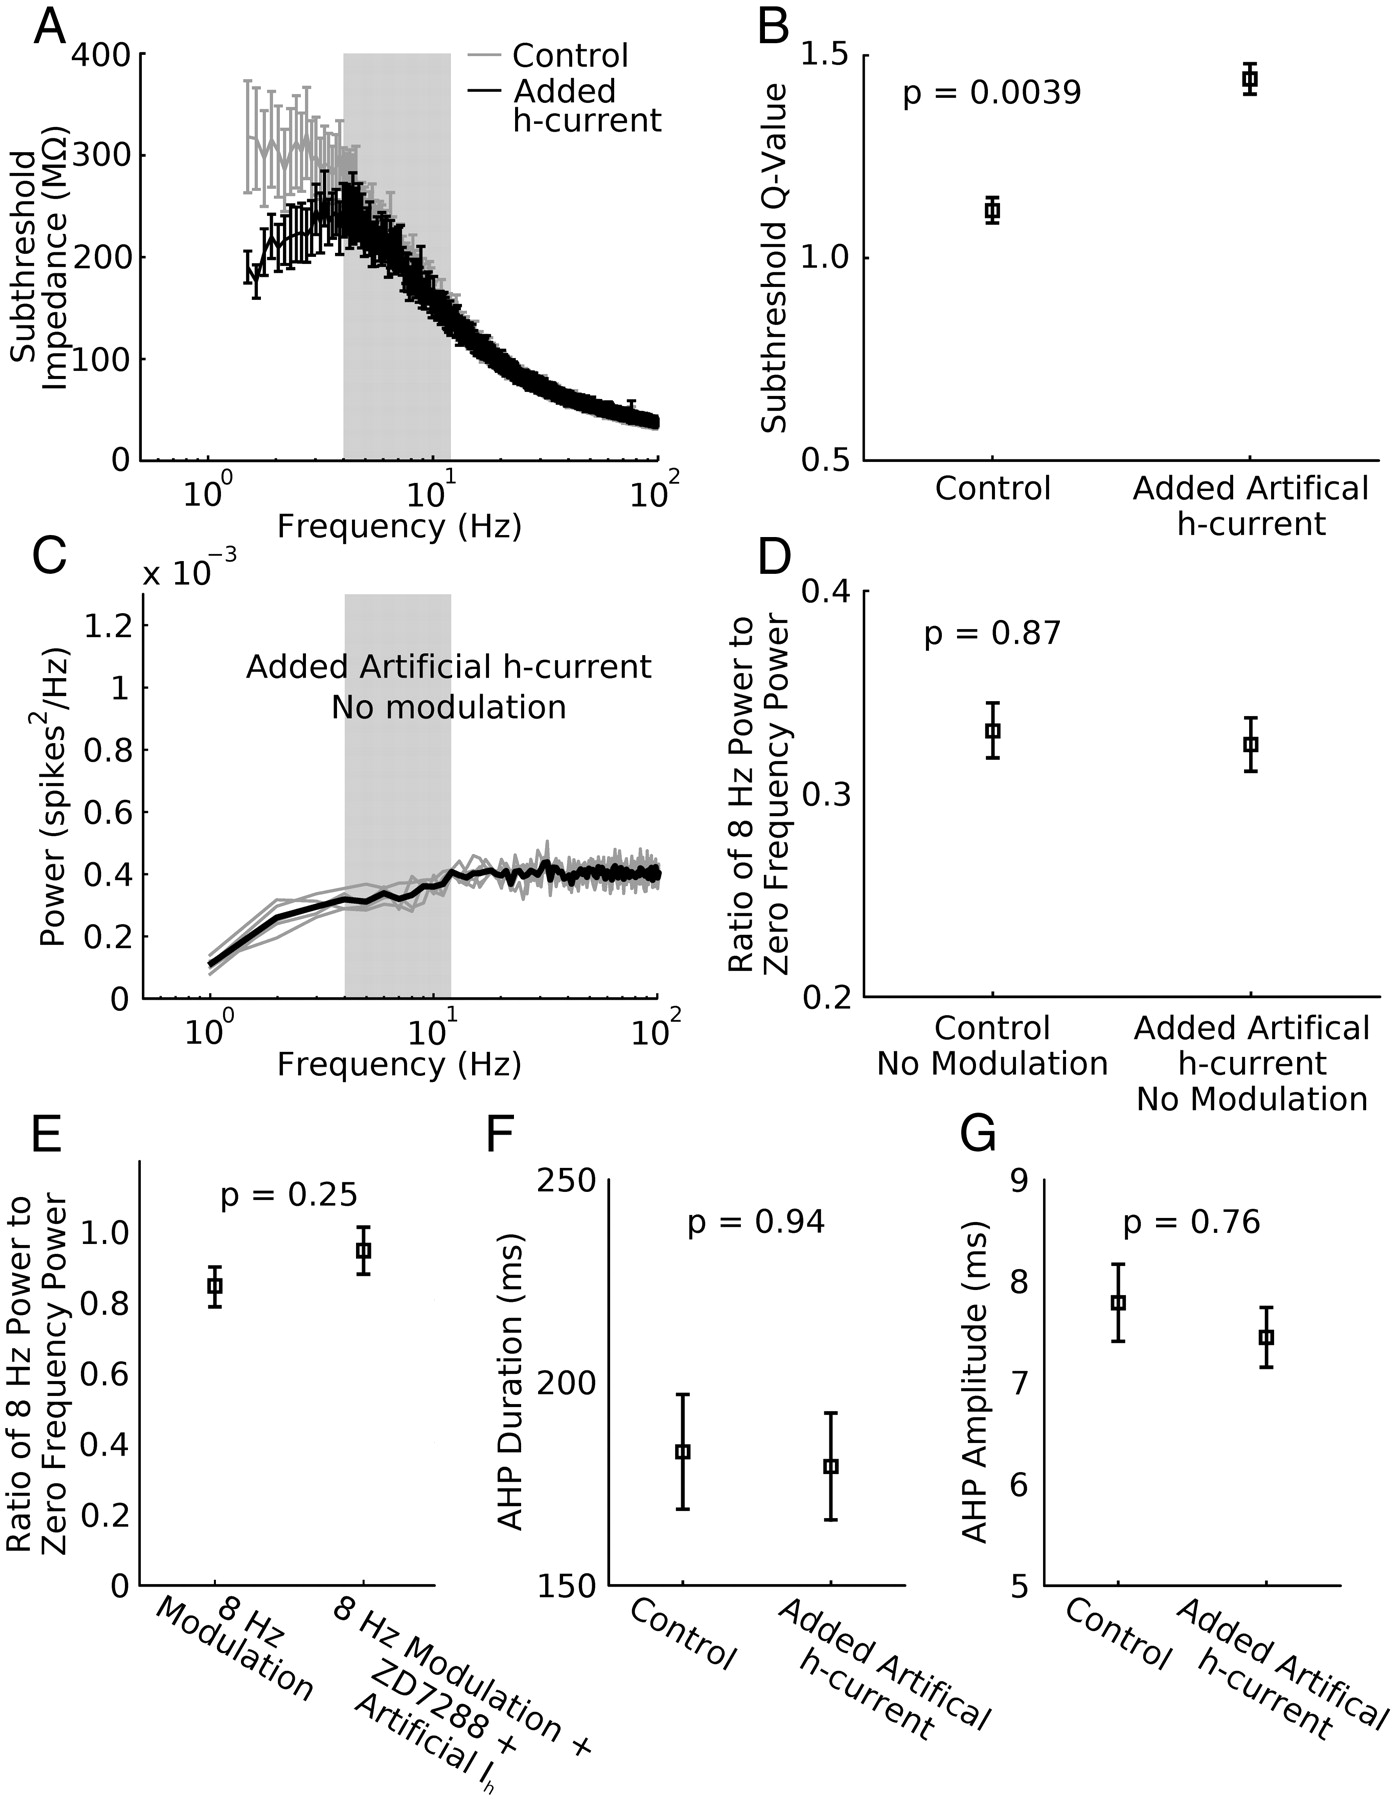
It is known that the h-current can be modulated to remain active in a more depolarized range in vivo (Pape, 1996; Biel et al., 2009; Emery et al., 2011). This can occur when β-adrenergic receptors are activated resulting in elevated cAMP levels which then shift the activation voltage of the h-current to a more depolarized range. Furthermore, it is known that such receptors are present in somatostatin-positive interneurons such as O-LM cells (Cox et al., 2008). We thus considered the hypothesis that in our slice preparations, the h-current had an excessively hyperpolarized half-activation voltage and that with a more depolarized activation profile it could contribute significantly to generating theta modulated spike rates. To test this hypothesis, we used dynamic clamp to add additional artificial h-current (2–2.5 nS) to O-LM cells with a half-activation of −75 mV (Maccaferri and McBain, 1996). This level of conductance was sufficient to produce a resonance peak in the subthreshold impedance profile in the voltage range immediately hyperpolarized to spike threshold that was significantly different from control (Fig. 6A,B, n = 5, Q-values significantly different with p = 0.0039). This result confirmed that the added artificial h-current was behaving as expected and that the modified O-LM cells had a resonant membrane.

Additional artificial h-current does not produce theta power in the spike power spectrum. Additional h-current conductance (2.5–5 nS) was added to O-LM cells to test whether this extra conductance could produce spiking resonance with unmodulated broadband synaptic inputs. A, Added h-current (half-activation voltage = −75 mV) is sufficient to produce a non-monotonic subthreshold impedance profile giving the membrane resonant properties compared with control (n = 5, error bars are SEM). B, Q-values of control and added h-current impedance curves are significantly different (p = 0.0039, n = 5) indicating that added h-current adds significant resonance to the O-LM cell membrane in the subthreshold range. C, Spike power spectra (gray traces are individual trials, black trace is the average, n = 5) of O-LM cells given unmodulated broadband synaptic inputs under added h-current (half-activation voltage = −75 mV). There is no peak present in the theta range, indicating that the subthreshold resonance was not translated into the spike power spectrum. Control traces without added h-current are not shown. D, Ratio of the 8 Hz power and the zero frequency power between control and added h-current trials is not significantly different (p = 0.87, n = 5). E, When 8 Hz modulation was used in addition to synaptic fluctuations a high ratio measure was seen. This ratio does not change significantly when the h-current in these cells is blocked and replaced with artificial h-current, indicating that the h-current is having no effect on spiking resonance (p = 0.25). F, G, Adding artificial h-current does not significantly change the AHP duration (F, p = 0.94) or amplitude (G, p = 0.76).
We injected a broadband synaptic stimulus and asked whether a peak at theta would emerge given the subthreshold resonance induced by the artificial h-current. Under these conditions, we found no peak in the spike train power spectrum in response to the unmodulated synaptic stimulus (Figs. 6C,D, n = 5, p = 0.87). We next tested whether an artificial h-current that induced subthreshold resonance could change the ability of O-LM cells to alter spiking in response to an 8 Hz modulated synaptic stimulus. We observed no significant change in the ratio of the modulation frequency power to the zero frequency power compared with control (Fig. 6E, p = 0.25, n = 5). Finally, we tested a small number of cells for spiking resonance when the half-activation of the h-current was depolarized further. Stepping the half-activation voltage from −75 mV to −55 mV in increments of 5 mV maintained subthreshold resonance but did not produce spiking resonance in response to broadband input for any voltage in the cells tested (n = 2, data not shown).
Because past work has linked oscillatory spike output properties in O-LM cells to specific features of the AHP (Maccaferri and McBain, 1996), we tested the effects of the artificial h-current on the AHP voltage trajectory. We compared average AHPs of O-LM cells between control and with added artificial h-current. We found no difference in either the duration (Fig. 6F, p = 0.94) or amplitude (Fig. 6G, p = 0.76, n = 5) of the AHP. Together, these results show that a level of h-current capable of inducing substantial subthreshold resonance is by itself insufficient to either induce spiking resonance or enhance the spiking response to 8 Hz modulated fluctuations.
Sensitivity to 8 Hz modulation in O-LM cells is dependent on AHP characteristics
Given that measures of spike output modulation were much stronger in the spiking regime at 8 Hz input modulation than the subthreshold response would predict (Fig. 4), we reasoned that specific spiking dynamics could be the critical factor in setting the spike response of O-LM cells. Previous work has established that features of the AHP are an important spike-dependent mechanisms for setting either an oscillatory/pace-making behavior (Fernandez and White, 2008) or a resonance behavior in the spike rate response (Higgs and Spain, 2009). For example, in stellate cells of the medial entorhinal cortex, reducing the AHP has a detrimental effect on those cells' ability to cluster spikes at interspike intervals values within the theta range (Fernandez and White, 2008). In neocortical regular-spiking cells, which, like O-LM cells, do not have subthreshold resonance, the AHP is responsible for producing spiking resonance at some input frequencies (Higgs and Spain, 2009).
To directly test whether the AHP was required for increased responsiveness in spike output modulation at 8 Hz in O-LM cells, we measured the change in resonance behavior when the AHP was reduced or enhanced. We avoided the use of pharmacological agents to modify the cell's AHP because in addition to modifying the AHP (Klink and Alonso, 1993; Yue and Yaari, 2004; Nolan et al., 2007; Yoshida and Alonso, 2007), pharmacological block can produce undesired changes in spike shape, adaptation rate or other interrelated parts of the cell's dynamics. As in previous studies (Fernandez and White, 2008; Higgs and Spain, 2009), we used dynamic clamp to provide a more specific manipulation of the AHP. We used a difference-of-exponentials waveform with a rise time constant of 10 ms and a decay time constant of 50 ms (Fig. 7B, inset) to inject either a depolarizing (AHP attenuating) or hyperpolarizing (AHP enhancing) current. In Figure 7, we provide an example of the average control spike overlaid onto a spike with an attenuated and enhanced AHP (Fig. 7A,B). When magnified, the voltage trajectory after the spike shows that the AHP has been changed substantially by the spike-triggered current and that, on average, spiking can either continue sooner or later depending on the sign of the AHP manipulation (Fig. 7B).

Spike-triggered current alters shape of the AHP. A, An average spike (average of ∼150 individual spikes) in which a real-time, spike-dependent current is injected to qualitatively alter the AHP shape. Cells were subjected to the same constant barrage of high-frequency conductance-based synaptic input as in other datasets and thus voltage traces remain noisy even when averaged. Shown in black in A and B is the control spike and the control AHP, respectively. Dark gray trace shows the spike and AHP when AHP attenuating current is used. Light gray trace shows the spike and AHP when AHP amplifying current is used. B, Magnification of the AHP associated with the spike waveform shown in A. The continuation of spiking after the AHP trough is advanced relative to control (black) due to AHP attenuating current (dark gray). Conversely, the continuation of spiking is delayed relative to control (black) when AHP amplifying current is used (light gray). Inset shows current waveforms associated with the AHP reducing or amplifying current injected via dynamic clamp. Current peaked at an approximate value of 30 pA.
For comparison, we provide the spike power ratios for each modulation frequency under control conditions (Fig. 8A, reproduced from Fig. 4B). We measured the change in the spike output modulation using the power ratio when the AHP modifying current was used to attenuate (Fig. 8B) or amplify (Fig. 8C) the AHP. For measures of power ratios, the AHP attenuation eliminated the significant difference between the 2 Hz and 8 Hz peaks seen in control (Fig. 8B, p = 0.53, n = 9; 2 Hz power ratio was increased by 0.29, 8 Hz power ratio was increased by 0.05). Conversely, amplifying the AHP maintained the peak in the power ratio at 8 Hz (Fig. 8C, p = 0.01, n = 9; 2 Hz power ratio was increased by 0.11, 8 Hz power ratio was increased by 0.15).

AHP attenuation with dynamic clamp makes O-LM cells more strongly low-pass. A–C, Bar graphs compare control recording (A, reproduced from Fig. 4B) with AHP-attenuated recordings (B) and AHP-amplified recordings (C). In the control condition (A), bars show the same pattern as in Figure 4 with a peak present at 8 Hz modulation. When the AHP is attenuated (B), the ratio at 2 Hz is increased and the significant different between the 2 and 8 Hz peaks disappears and nearly reverses (p = 0.53, n = 9) indicating an abolition of resonance behavior. When the AHP is amplified (C) the resonance profile is slightly enhanced (p = 0.01, n = 9). D–I, Average spike histograms (n = 9) of the data in A–C for 2 Hz modulation (first row) and 8 Hz modulation (second row). Histograms are normalized to have unit area. In general the number of high-frequency intervals increases with 2 Hz modulation and AHP attenuation (E, arrow) when compared with 2 Hz modulation and AHP amplification (F, arrow). J–O, Average spike power spectra (n = 9) of the data in A–C for 2 Hz modulation (first row) and 8 Hz modulation (second row). In general, larger peaks in power correspond to taller bars in bar graphs.
To account for these results it is important to consider that the AHP reducing current represents a form of positive feedback that leads to higher gain and more high-frequency events (i.e., smaller ISI values). Although we kept average spike rate at 2.5 Hz, attenuation of the AHP increased the cells' propensity to fire sequences of higher frequency spikes. Consistent with previous studies, high-frequency events (burst-like events by some definitions) are better elicited by low-frequency input modulation (Oswald et al., 2004; Higgs and Spain, 2009). Low-frequency 2 Hz input, in contrast to 8, 20, and 30 Hz, provides sufficient time in a depolarized voltage to elicit numerous high-frequency ISI values at the peak of the modulation. At 8, 20, and 30 Hz, one spike per cycle can be generated at most; thus, an O-LM cell with a reduced AHP does not become better at representing those frequencies.
The average ISI distributions of spike trains resulting from cells with alterations to the AHP in response to 2 and 8 Hz mirror the behavior observed with power ratio analysis (Fig. 8D–I, n = 9). When the AHP is reduced, the cell generated an increase in the proportion of high-frequency ISI values in response to 2 Hz modulation (Fig. 8E, arrow). As a result, the bimodality seen in the interspike interval distribution with 2 Hz modulation under control conditions (Fig. 8D) becomes more dramatic when the AHP is attenuated (Fig. 8E, arrow). Conversely, increasing the size of the AHP swung the power ratio in the opposite direction by reducing the number of ISI values at high frequencies in response to 2 Hz modulation (Fig. 8F, arrow). Thus, cells with an increase in the size of the AHP had far fewer high-frequency ISI values in response to 2 Hz modulation. Thus, the modest spiking resonance observed in O-LM cell is a result of AHP characteristics that suppress responsiveness to 2 Hz input modulation relative to 8 Hz.
Responses to modulated stimuli are qualitatively reproduced in a simple model
To demonstrate that modest spiking resonance can be generated by refractory dynamics alone and does not require the subthreshold membrane dynamics of the h-current, we repeated the AHP attenuation experiment in a simple model that did not have an h-current. We used a quadratic integrate-and-fire neuron (Izhikevich, 2003) with a predetermined parameter set (cell type “M” from Izhikevich, 2004) that was chosen because it has an AHP that is qualitatively similar to the AHP seen in O-LM cells. In general, however, this model was not meant to represent O-LM cells in a rigorous way but intended to be a simple representation of a cell in which the AHP contributes significantly to the timing of interspike intervals.
Using the same experimental setup from our previous results in biological O-LM cells, we were able to replicate our spike resonance findings in this simple model. We adapted the experimental protocols to first test the spiking response of the model in response to artificial synaptic fluctuations. For the model, the amplitude of individual excitatory and inhibitory events was adjusted to produce approximately a 3 mV SD in the voltage fluctuations as in experiments; however, all other parameters of the experimental protocol remained the same. Like in the experimental recordings, spike rate was maintained at 2.5 Hz. We proceeded to measure the ability of the model to respond to artificial synaptic fluctuations modulated at different frequencies.
We found that the model displayed spiking resonance qualitatively similar to that seen in O-LM cells, with the largest peak spike power observed at 8 Hz when compared with all other frequencies tested (2, 20, 30 Hz, Fig. 9A). We then compared the responses of the model when the AHP was attenuated as in our in vitro experiments (Fig. 9B). Scaling parameters were adjusted to produce AHP attenuation results qualitatively comparable to the experimental data. We noticed that spiking resonance was abolished in this model as in our experimental data when the AHP was attenuated (Fig. 9B). Conversely, when the AHP was enhanced, the spiking resonance profile of the model was unchanged relative to control (Fig. 9C). Like in the real neuron, attenuation of the AHP leads to an increase in the high-frequency ISI values for 2 and 8 Hz (Fig. 9B, bottom, arrows). These results suggest that the AHP-dependent mechanism, by which we have shown that O-LM cells produce a modest resonant response in their spiking behavior, is potentially applicable to a broad set of cell types.

Simple model replicates modest spiking resonance and abolition of resonance with AHP attenuation. A simple quadratic integrate-and-fire model with an AHP was used to qualitatively represent an O-LM cell. The model was subjected to the exact same protocol as real O-LM neurons (with parameters adjusted appropriately to produce similar 3 mV SD voltage fluctuations) with spiking elicited at low rates by frequency modulated artificial synaptic fluctuations. All bars are averages across 10 simulations. Error bars are SEM. A, A resonance profile similar to the one seen in vitro for O-LM cells emerges (for A–C, bar graphs of power ratio). B, When the model AHP was attenuated, the phase-locking profile is more strongly low-pass. C, When the model AHP was amplified, the resonance was slightly enhanced, consistent with experimental observations. Bottom rows, ISI histograms for 2 Hz modulation (first row) and 8 Hz modulation (second row) show similar profiles to those observed in vitro. D–G, We additionally tested the effects of changing the parameters of the artificial synaptic inputs to obtain intuition about how parameter choices might alter our experimental results. For all stimulus changes tested in the model, we observed no qualitative changes to the output of the model, suggesting that our experimental parameter choices yielded results that would hold across a wide range of stimuli. D, Increased synaptic input rate by 25% for both excitation and inhibition. E, Decreased synaptic input rate by 25% for both excitation and inhibition. With reduced synaptic input rates modulation is less effective yielding shorter bars (less phase-locking). F, Half of the excitatory synaptic input conductance was changed to be NMDA receptor based. G, Half of the inhibitory synaptic input conductance was changed to be GABAB receptor based. Due to the much slower kinetics of GABAB, frequency modulation is less effective yielding shorter bars.
To further test the generality of our results, we altered the stimulus given to the model in several ways. First, we altered the rate of the excitatory and inhibitory events to test whether our results were dependent upon specific choices for the rate parameter. We first increased the rate of both excitatory and inhibitory synaptic events by 25% (Fig. 9D) and then decreased them by the same percentage (Fig. 9E). In both cases, we continued to observe spiking resonance in the model suggesting that there is a wide range of rate values that yield results similar to what we observed in our experiments. When rate was decreased (Fig. 9B), modulation became less effective at modulating the spike output.
Next, we substituted an NMDA conductance for half of the AMPA conductance (Fig. 9F) as well as another set of tests in which we substituted a GABAB conductance for half of the GABAA conductance (Fig. 9G). For both of these changes the qualitative result remained unchanged. Overall, these simulations suggest that a wide range of parameters can yield results similar to what we observed in our experiments, which suggests that an AHP-dependent mechanism of spiking resonance could apply to a wide range of cell and input types.
Discussion
We have shown that O-LM interneurons of the hippocampus show no signs of pacemaker properties when driven with unmodulated synaptic stimuli. When synaptic input rates were modulated at certain frequencies, O-LM cells were able to follow theta frequencies effectively. The spike output rate of O-LM cells was much more strongly modulated at theta than would be expected from the subthreshold membrane voltage response. Thus, while subthreshold membrane properties attenuate 8 Hz inputs substantially, phase-locking is similar for 8 Hz and 2 Hz modulation. Although our data do not support the idea that O-LM cells serve as pacemakers of the theta rhythm, they do suggest that these neurons could stabilize, transmit, or even amplify ongoing theta-modulated activity from presynaptic sources.
Comparison with previous studies
A major motivation for this work was to clear up confusion regarding the potential role of O-LM interneurons in the theta rhythm. On the one hand, O-LM cells can discharge at theta frequencies, both in vivo (Klausberger et al., 2003) and in some cases in the otherwise quiescent brain slices (Maccaferri and McBain, 1996). These findings have led authors of computational models of hippocampal theta to treat these cells as clock-like pacemakers (Gloveli et al., 2005b; Rotstein et al., 2005; Tort et al., 2007). This assumed role may be accurate if considered strictly from the standpoint of the neuronal targets of O-LM cells. However, the existing biophysical results from O-LM cells are compatible with our results here and also argue against a role as a theta pacemaker or resonator. For example, morphologically identified O-LM cells have Q-values (a measure of subthreshold resonance) of <1.05 (Zemankovics et al., 2010), substantially less than in several other cell types in the hippocampal formation. The h-current in O-LM cells, which has been implicated as the driver of the O-LM theta pacemaker, is not active for membrane potentials near threshold (Zemankovics et al., 2010).
Our data suggest that O-LM cells respond with theta-frequency spike trains because they can phase-lock effectively to theta-modulated inputs from other sources. Previously, it has been shown that excitatory synapses onto O-LM cells can follow 10 Hz stimulation without appreciable adaptation (Goldin et al., 2007), suggesting that phase-locked input from CA1 pyramidal cells may provide the sort of theta-rich input to which O-LM cells can lock. Also, “horizontal” interneurons in stratum oriens are sensitive to theta-frequency sinusoidal inputs (Pike et al., 2000), a finding compatible with our data as well. However, because Pike et al. did not reconstruct their cells, we do not know for sure which population(s) are represented in their data.
Our findings do differ from previous data in one regard: unlike Maccaferri and McBain (1996), we did not observe much spontaneous firing activity in O-LM cells. Although we are not entirely sure why O-LM cells in our conditions did not fire spontaneously, our use of slightly older animals and lower external K+ concentrations relative to previous work (Maccaferri and McBain, 1996) may be involved.
Existing biophysical models of O-LM cells include descriptions of h-currents from either thalamic relay neurons (Saraga et al., 2003) or entorhinal stellate cells (Gloveli et al., 2005b; Rotstein et al., 2005; Tort et al., 2007). Typically, these models exhibit strong theta resonance features or slow oscillatory bursting dynamics. In light of our data and those of (Zemankovics et al., 2010), these models should be modified to move the activation curve of the h-current to more hyperpolarized potentials, and to dampen the resonant properties of the modeled cells.
Stimulus parameters
Our stimuli included two properties that are shared by the vast majority of recordings in vivo (Destexhe et al., 2003). The first is the use of noisy membrane voltage fluctuations that produce spike time distributions with high CVs and low average spike rates. Second, the synaptic conductances significantly reduce the membrane resistance. Both these features have been observed in a wide range of different cell types. It seems likely that fluctuation-driven spiking and the concomitant increase in membrane conductance associated with synaptic inputs are general features of mammalian central neurons during active states (Rossant et al., 2011).
For our analysis of suprathreshold responses, we measured power spectral densities and spike phase of binary spike trains and not raw voltage traces as in previous work (Gillies et al., 2002; Gloveli et al., 2005a). This allows the separation of theta in the spike train from theta oscillations in the subthreshold voltage.
Role of h-current in theta activity
Our data indicate that the h-current has a limited role in spike output characteristics during fluctuation-driven spiking in O-LM cells. The role of h-current in O-LM cells is limited due to its hyperpolarized activation voltage. The h-current in O-LM cells is not active near spike threshold and thus cannot significantly influence spiking. These results are also consistent with voltage-clamp data in O-LM cells that indicate a hyperpolarized voltage for activation for h-current (Maccaferri and McBain, 1996; Zemankovics et al., 2010). Furthermore, we did not observe any influence of the h-current even when we used dynamic clamp to give O-LM cells a more depolarized h-current activation. Despite the fact O-LM cells with the artificial h-current possessed robust subthreshold resonance, the h-current had no influence on the ability for O-LM cells to generate autonomous theta activity or amplify theta inputs in the spiking regime. The inability for h-current to influence spiking under these conditions is likely the result of the fluctuation-driven spiking regime, which does not provide the conditions in which h-current can pace spike activity with low interspike interval variability.
Although the role of the h-current is often emphasized in the literature, it is likely only one of many components that facilitate spike output resonance or pacing at theta. Even in entorhinal stellate cells, which have prominent h-currents and theta-frequency subthreshold oscillations, subthreshold oscillations can persist with h-currents clearly blocked (Haas et al., 2007). Also in stellate cells, factors that interact with the h-current, like the AHP, can form complex dynamics that support the transmission of subthreshold resonance into the spiking regime (Fernandez and White, 2008). We hypothesize that these other factors are missing in O-LM cells, with the consequence that adding virtual HCN channels to induce robust subthreshold resonance is insufficient alone to produce spike output resonance.
Role of AHP currents in O-LM spike activity
Our data show that the ability of O-LM cells to phase-lock well to theta-modulated stimuli is regulated by the AHP voltage trajectory. These results are consistent with previous work that has shown that bandpass characteristics in spike coherence to inputs can be regulated by the AHP and spike refractory properties of the cell (Oswald et al., 2004; Higgs and Spain, 2009). Furthermore, it has been established in simple models of spike generation that increased refractoriness through threshold fatigue reduces overall power in spike trains at low frequencies (Chacron et al., 2004). Thus, the AHP in neurons likely plays an important role in establishing spike statistics in response to both broadband input as well as frequency modulated input.
Limitations of our approach
Our results suggest that O-LM cells do not act as theta resonators, and show only weak evidence of theta selectivity in response to sinusoidally modulated stimuli. It is still possible, however, that dendritic inputs coupled with nonlinearities in the dendrite may produce more complex and cell-specific patterns. Thus, the assessment of voltage and spike output resonance in our study is limited to inputs at the soma. It is possible that highly resonant compartments located in the dendrites could selectively amplify theta inputs and increase spike train power at this frequency. However, there is no evidence for this possibility, and our results with artificially added h-currents suggest that the spike-generating mechanism in O-LM cells is not responsive to such bandpass-filtered inputs.
It is important to note that we do not exclude the possibility that O-LM cells are capable of discharging at 4–12 Hz with relatively low variability in their interspike intervals, thus helping to pace their postsynaptic targets. In fact, juxtacellular in vivo recordings of O-LM cells (Klausberger et al., 2003) support such a model. In this case, we believe that O-LM firing rates are constrained not by their intrinsic properties but rather by their synaptic inputs.
Theta activity in hippocampus
Recent whole hippocampal recordings in vitro provide the best evidence to date for the hypothesis that the CA1 region of the hippocampus can autonomously generate persistent theta activity (Goutagny et al., 2009). Those data suggest that theta can occur endogenously and need not be activated by pharmacological agents as in some slice recordings (Gillies et al., 2002). In the whole hippocampus preparation, theta was found to be dependent on AMPAergic excitation from pyramidal cells. It is also known that CA1 pyramidal cells also contain an h-current (Magee, 1998) and are theta resonant (Hu et al., 2002). Together, these data suggest that theta oscillations may be generated by the resonant properties of pyramidal cells and stabilized by feedback inhibition.
Footnotes
Support was provided by NIH Grants R01 MH085387, R01 MH085074, and R01 RR020115 (J.A.W.). We are grateful to Nancy Kopell and Eve Marder for helpful discussions and critiques of the manuscript.
The authors declare no competing financial interests.
- Correspondence should be addressed to John A. White, 20 S. 2030 E., BPRB 506A, University of Utah, Biomedical Engineering, Salt Lake City, UT 84112. john.white{at}utah.edu
References
- Alonso and Llinás, 1989.↵
- Berens, 2009.↵
- Bettencourt et al., 2008.↵
- Biel et al., 2009.↵
- Bland and Oddie, 2001.↵
- Calvin and Stevens, 1968.↵
- Chacron et al., 2004.↵
- Cobb et al., 1995.↵
- Cox et al., 2008.↵
- Crochet and Petersen, 2006.↵
- Destexhe and Contreras, 2006.↵
- Destexhe and Paré, 1999.↵
- Destexhe et al., 2003.↵
- Dorval et al., 2001.↵
- Emery et al., 2011.↵
- Fellous et al., 2003.↵
- Fernandez and White, 2008.↵
- Freund and Buzsáki, 1996.↵
- Gillies et al., 2002.↵
- Gloveli et al., 2005a.↵
- Gloveli et al., 2005b.↵
- Goldin et al., 2007.↵
- Goutagny et al., 2009.↵
- Haas et al., 2007.↵
- Harsch and Robinson, 2000.↵
- Harvey et al., 2009.↵
- Higgs and Spain, 2009.↵
- Holt et al., 1996.↵
- Hu et al., 2002.↵
- Hussaini et al., 2011.↵
- Izhikevich, 2003.↵
- Izhikevich, 2004.↵
- King et al., 1998.↵
- Klausberger et al., 2003.↵
- Klink and Alonso, 1993.↵
- Lorente De Nó, 1934.↵
- Maccaferri and McBain, 1996.↵
- Magee, 1998.↵
- Montgomery et al., 2009.↵
- Morin et al., 2010.↵
- Nerad and McNaughton, 2006.↵
- Netoff et al., 2005.↵
- Noda and Adey, 1970.↵
- Nolan et al., 2004.↵
- Nolan et al., 2007.↵
- Oswald et al., 2004.↵
- Pape, 1996.↵
- Paré et al., 1998.↵
- Pfrieger et al., 1994.↵
- Pike et al., 2000.↵
- Rossant et al., 2011.↵
- Rotstein et al., 2005.↵
- Saraga et al., 2003.↵
- Shadlen and Newsome, 1998.↵
- Shirvalkar and Bahar, 2009.↵
- Smith and Smith, 1965.↵
- Softky and Koch, 1993.↵
- Tort et al., 2007.↵
- Yoshida and Alonso, 2007.↵
- Yue and Yaari, 2004.↵
- Zemankovics et al., 2010.↵


