

Abstract
The exquisite sensitivity and frequency discrimination of mammalian hearing underlie the ability to understand complex speech in noise. This requires force generation by cochlear outer hair cells (OHCs) to amplify the basilar membrane traveling wave; however, it is unclear how amplification is achieved with sharp frequency tuning. Here we investigated the origin of tuning by measuring sound-induced 2-D vibrations within the mouse organ of Corti in vivo. Our goal was to determine the transfer function relating the radial shear between the structures that deflect the OHC bundle, the tectorial membrane and reticular lamina, to the transverse motion of the basilar membrane. We found that, after normalizing their responses to the vibration of the basilar membrane, the radial vibrations of the tectorial membrane and reticular lamina were tuned. The radial tuning peaked at a higher frequency than transverse basilar membrane tuning in the passive, postmortem condition. The radial tuning was similar in dead mice, indicating that this reflected passive, not active, mechanics. These findings were exaggerated in TectaC1509G/C1509G mice, where the tectorial membrane is detached from OHC stereocilia, arguing that the tuning of radial vibrations within the hair cell epithelium is distinct from tectorial membrane tuning. Together, these results reveal a passive, frequency-dependent contribution to cochlear filtering that is independent of basilar membrane filtering. These data argue that passive mechanics within the organ of Corti sharpen frequency selectivity by defining which OHCs enhance the vibration of the basilar membrane, thereby tuning the gain of cochlear amplification.
SIGNIFICANCE STATEMENT Outer hair cells amplify the traveling wave within the mammalian cochlea. The resultant gain and frequency sharpening are necessary for speech discrimination, particularly in the presence of background noise. Here we measured the 2-D motion of the organ of Corti in mice and found that the structures that stimulate the outer hair cell stereocilia, the tectorial membrane and reticular lamina, were sharply tuned in the radial direction. Radial tuning was similar in dead mice and in mice lacking a tectorial membrane. This suggests that radial tuning comes from passive mechanics within the hair cell epithelium, and that these mechanics, at least in part, may tune the gain of cochlear amplification.
Introduction
A sound pressure wave propagates up the length of the cochlea in the form of a traveling wave (von Békésy, 1960). The location of the peak of the traveling wave varies according to the tonotopic map defined by passive mechanical gradients in stiffness and mass. The cochlear base is tuned to high frequencies and the apex is tuned to low frequencies. Active processes within outer hair cells (OHCs) associated with somatic electromotility (Brownell et al., 1985) and/or stereociliary bundle motility (Nin et al., 2012) generate force to amplify and sharpen the tuning of the traveling wave, a process termed cochlear amplification (Davis, 1983). Thus, sound stimuli produce larger vibratory responses and sharper frequency tuning in living compared with dead animals (Rhode, 1971; Nuttall and Dolan, 1996; Robles and Ruggero, 2001). Eliminating the power to drive OHC motility by removing the endocochlear potential (Ruggero and Rich, 1991), removing OHC stimulation by removing the tectorial membrane (TM) (Legan et al., 2000), or inactivating the OHC motor protein prestin (Dallos et al., 2008) are all known to reduce both the gain and the sharpness of frequency tuning in the basilar membrane (BM) vibratory response. These data indicate that OHCs are needed for both amplification and sharp frequency tuning.
However, the concept that OHCs simply amplify the broadly tuned traveling wave cannot alone explain the exquisite sharpness of BM tuning (Evans, 1972; Allen and Fahey, 1992). If each OHC along the length of the cochlea provided equal gain, the tuning of the traveling wave would not be sharp enough to match what has been measured in BM motion (Fig. 1A). Instead, an additional filtering step within the organ of Corti has been proposed to account for the apparent frequency-selectivity of OHC amplification (Evans and Klinke, 1982; Markin and Hudspeth, 1995). According to this theory, additional filtering selectively tunes OHC stimulation, force production, and/or the impedance of the organ of Corti, so that the traveling wave is amplified only over a short region. Various components have been suggested to provide this additional filtering, including the TM (Hubbard, 1993; Gummer et al., 1996; Russell et al., 2007) fluid within the tunnel of Corti (Karavitaki and Mountain, 2007a), the Deiters' cell phalangeal processes (Geisler and Sang, 1995; Yoon et al., 2011), the stereociliary bundle (Fettiplace, 2006; Peng and Ricci, 2011; Hudspeth, 2014), and OHC electromotility (Neely and Kim, 1986; Mountain and Hubbard, 1994; Weitzel et al., 2003; Song and Santos-Sacchi, 2013).
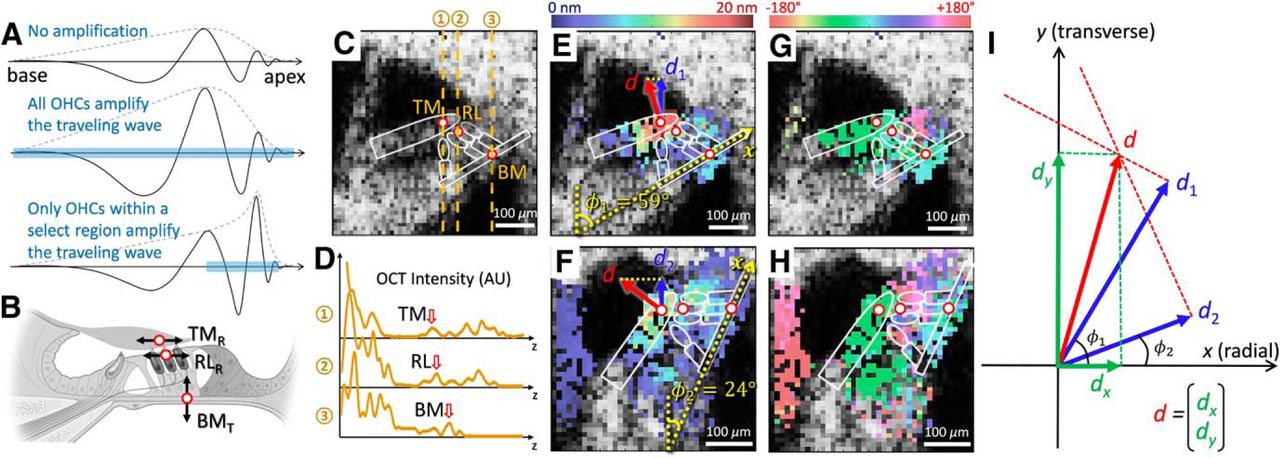
A, Schematic of traveling waves along the cochlea. The displacement of the basilar membrane in the transverse direction at one point in time (solid lines) and the peak envelope (dotted lines) in response to a pure tone stimulus are shown. The postmortem response (top) stems from the passive mechanics of the basilar membrane, and there is no amplification. If the forces of amplification delivered by every OHC were proportional to the displacement of the basilar membrane under it (i.e., equal gain along the length of the cochlea), the traveling wave would essentially be a magnified version of the postmortem response (middle). In contrast, the normal response in a living cochlea exhibits sharpened tuning with a shifted peak location (bottom). This is consistent with the forces of amplification being delivered only over a localized region of the basilar membrane. B, Schematic cross-section of the organ of Corti. We focused our analyses on transverse motion of the basilar membrane (BMT), the radial motion of the reticular lamina (RLR), and the radial motion of the tectorial membrane (TMR). C, Cross-sectional OCT anatomic image (B-scan) of a mouse cochlea in vivo. The optical axis through each measurement point is shown (dotted lines). D, Plots of the image intensity versus depth (A-scan) for the three measurement locations. The locations we measured could be identified as peaks in the tracings. E–H, Cross-sectional OCT images of a mouse cochlea taken at two different angles relative to the optical axis (φ1, φ2). The vibratory magnitude (left images) and phase (right images) to a 10 kHz, 20 dB SPL pure tone are pseudocolored and superimposed upon the anatomic image. The actual 2-D motion of any structure in the image could be calculated by measuring the projected motion from these two images. In this example, the BMT (red arrows) is shown projected onto the optical path of the OCT laser (blue arrows). I, Calculation of vibrations in 2-D from two different measurement angles. The x- and y-axes represent the radial and transverse directions, respectively. The measured vibrations (d1 and d2) were in the direction of the two different optical paths. Their projections were used to calculate the actual 2-D motion of the point, d, in the radial and transverse directions, dx and dy (green arrows).
In support of the concept of additional filtering within the organ of Corti, phase shifts in the vibration of the reticular lamina (RL) and in the electric field potential generated by hair cell transduction have been found near the frequency of maximal BM vibration to low-intensity stimuli (termed the characteristic frequency [CF]) (Dong and Olson, 2013; Ramamoorthy et al., 2014). Similarly, we found that the region of the organ of Corti containing the Hensen, Boettcher, and Claudius cells demonstrated a sharply tuned phase change in its vibratory response near the CF (Gao et al., 2014). Surprisingly, this phase change was present not only in control mice, but also in dead mice and in mutant mice that do not have cochlear amplification, suggesting that the filtering is passive.
If the mechanics of the organ of Corti produce additional filtering to sharpen tuning, this filtering may be represented in the frequency response of the OHC stereociliary bundle, which would then amplify the tuned stimulus. However, because hair cell stereocilia are stimulated by radial shear, measurements of radial motion are needed to test this hypothesis (Fig. 1B). Therefore, we measured the vibratory response of the organ of Corti in 2-D to determine the transverse (up-and-down) and radial (side-to-side) vectors of motion in live and dead mice. We determined the frequency response of the transfer function relating the shear between the structures that deflect the OHC bundle, the TM and RL, to the transverse motion of the BM (BMT).
Materials and Methods
Mouse preparation.
The study protocol was approved by the Stanford Institutional Animal Care and Use Committee. P28-P42 CBA/CaJ mice and TectaC1509G/C1509G mice of either sex were used (stock #000654 and 10826, The Jackson Laboratory). Each mouse was anesthetized with ketamine/xylazine, and its left middle ear bulla was surgically opened to access the cochlea without disturbing the otic capsule bone. We recorded from a region of the cochlear apex approximately a half-turn down from the apical end. After performing all the desired experiments in the living mouse, the animal was killed by anesthesia overdose so as not to move the head. Further measurements were made postmortem. Finally, vibration measurements were made from the middle ear ossicular chain to define the magnitude and phase of the sound entering the cochlea.
Volumetric optical coherence tomography vibrometry (VOCTV).
Vibrations of the organ of Corti were measured using VOCTV. Our VOCTV system is custom-built and has been described previously (Lee et al., 2015). Briefly, it is composed of a broadband swept-source with a center wavelength of 1300 nm and 200 kHz sweep rate (MEMS-VCSEL, Thorlabs), a dual-balanced photodetector (WL-BPD600MA, Wieserlabs), and a digitizer (NI-5761, National Instruments). An adaptor attached to the bottom of a dissecting microscope (Stemi-2000, Zeiss) scanned the beam in both the x and y directions. For all experiments, the power on the sample was 16 mW. Sound stimuli were synthesized in software and output by a speaker (MDR EX37B, Sony) that was inserted into ear canal. We calibrated the stimuli using a probe-tip microphone in the ear bar as previously described (Oghalai, 2004; Xia et al., 2010, 2013). We presented pure tones from 2 to 13 kHz in frequency steps of 0.5 kHz at intensities from 10 to 80 dB SPL in 10 dB steps. The duration of the sound stimulus ranged from 50 to 200 ms, with longer stimuli used for less intense stimuli to achieve a lower noise floor.
At any given x-y location of the scan mirror, the vibratory data from all pixels along the optical path of the laser (comprising different structures in depth) were collected and analyzed simultaneously. We underfilled a 75 mm focal length objective lens to focus a collimated laser beam with a 1/e2 diameter of 6.7 mm, giving an effective numerical aperture (NA) of 0.044. In air this gives a 1/e2 diameter spot size of 18.7 μm. Because the laser beam has a Gaussian profile, we use the FWHM diameter of 10.9 μm as a better indication of imaging resolution. Therefore, in water, which has a refractive index of ∼1.3 at 1300 nm, the theoretical lateral imaging resolution is 8.4 μm. We have measured the lateral resolution of our VOCTV system and found it to be reasonably close to this at 9.8 μm (Lee et al., 2015). With such a low NA objective, the axial resolution is set by the bandwidth of the laser source, and we measured this to be 11.4 μm in water (Lee et al., 2015). The vibratory sensitivity of our system is within the picometer range, calibrated using a piezoelectric probe and a commercial laser Doppler Vibrometer (Applegate et al., 2011; Gao et al., 2013; Lee et al., 2015).
During the experiments, we selected points for study that had strong signal intensity on the image because these provided the lowest noise floor for the vibratory measurements. No averaging of adjacent points was performed. To minimize the potential for phase corruption, where the point spread functions overlap and vibrations from one point might affect the measurement at the other point (Ellerbee and Izatt, 2007), we only studied measurement points that were at least 30 μm apart and in which the measurement point had an intensity that was a local maxima. Furthermore, vibration data from any given voxel were not analyzed if the image intensity of that voxel was within 3 SDs of the noise floor of the background intensity measured in perilymph. Similarly, we did not analyze vibration data if the vibratory magnitude at the stimulus frequency was below a threshold set at the mean + 3 SD of the vibratory noise floor measured at nearby frequencies.
Vibratory measurements.
Most of our measurements were made at three locations: the BM, the RL, and the TM. The BM was measured in its mid-point, the RL was measured at the apical edge of the OHC region, and the TM was measured in the mid-portion of the region overlying the OHCs. We selected these measurement positions using three criteria. First, the anatomic image (termed a B-scan in the OCT literature) was used to provide an assessment of organ of Corti anatomy (Fig. 1C). Second, plots of the intensity versus depth along selected optical path of the three points (termed A-scans in the OCT literature) were used to identify peaks that corresponded to the structures of interest (Fig. 1D). Third, we presented acoustic stimuli and collected the vibratory magnitude and phase responses at every point in the image. Plotting these responses in pseudocolor superimposed upon the anatomic image demonstrated that these nearby structures had clearly different vibratory responses (Fig. 1E–H) and thus helped confirm our selected measurement points.
Vibratory measurements were made from the same cochlear location at two different angles. Example images taken from one mouse are shown in Figures 1E, G and Figures 1F, H. This was done by rotating the head of the mouse while maintaining the plane of the cross-sectional image. We verified that the cochlear cross-section did not change in two ways. First, before measuring at either angle, we collected a volumetric series of images by scanning the beam in both the x and y directions. We viewed the image stack to verify that the angle of the organ of Corti cross-section we selected was not skewed. When necessary, the scan angle was rotated using our software to minimize the width of the scala media and achieve a perpendicular slice. This was done to guarantee that the cochlear cross-sections we measured from were always perpendicular to the longitudinal axis of the cochlear duct. Second, after rotating the head, the vibratory phase of the basilar membrane at the characteristic frequency was checked to make sure it was the same as before the head was rotated. This was done to verify that we were at the same longitudinal location.
Even though we were careful to maintain the position of the speaker in the ear canal, changing the orientation of the head of the mouse could potentially affect the distance between the speaker and the tympanic membrane, producing a phase error. We calculated, however, that, even in a worst-case scenario where the speaker moved 1 mm in air, the phase error would only be 3% at 10 kHz (∼11°). Therefore, this potential issue has little impact on our interpretation of the data.
Reconstruction of 2-D motion.
After measuring the motion of these locations with the animal rotated at two different angles, we then calculated the transverse and radial vectors of motion for each of these locations (Fig. 1I). A vibratory response with respect to the harmonic input sound stimulus is held in 3-D space; however, our study focuses on its projected motion in the cross-section of the cochlea, d = (dx, dy), where d is the 2-D displacement of the point being measured, dx and dy compose the radial and transverse orthogonal vectors of time-varying motion, respectively. However, because our system can only measure the one-dimensional projected motion along the laser axis, at least two measurements at different laser angles (φ1 and φ2 with respect to the radial axis) are required to reconstruct the 2-D motion. Therefore, we describe the two measured displacement vectors as di = (ai · cos(ωt + θi), ai · sin(ωt + θi), where ai is the measured vibratory magnitude, θi is the measured vibratory phase, ω is the frequency in radians, t is time, and i = 1 or 2 to identify the measurement angle. Given these two measured arbitrary vectors of motion, we can reconstruct the 2-D motion of the point, d(t), by solving for the intersection of two lines normal to the end of the vectors (Fig. 1I, red dotted lines) as follows:
 The magnitude and phase of the radial (x) and transverse (y) vectors of the 2-D motion can be obtained by taking the absolute values and angles of the complex numbers in each coordinate (Fig. 1I, green arrows). As an example, if the two measurement angles were exactly the x and y axes, then the reconstructed 2-D motion would be d = (d1, d2), which is the same as the output from Equation 1 when φ1 = 0° and φ2 = 90°.
Practically, to perform these calculations, we first identified the basilar membrane from the anatomic image. Each of the images and its vibratory data were segmented visually by comparing the OCT images to two-photon images of the mouse cochlea at the same cochlear location (Soons et al., 2015). Transverse motion was defined as being perpendicular to the basilar membrane (the y direction) and radial motion was defined as being parallel to the basilar membrane (the x direction). The angle of the vibratory measurement was then determined as the angle of the basilar membrane relative to the optical axis. Thus, if the basilar membrane was flat in the image, the angle was 90°. Vibratory data measured at both angles from the identical position were then plugged into Equation 1 to get the transverse and radial vectors of motion.
Data adjustment and statistical analysis.
To average data collected from different mice, vibratory magnitudes and phases were averaged separately, and the mean and SEM for all data points were calculated. Phase unwrapping was performed so that all phases that were averaged together at each frequency were within π radians of the mean. For all figures, we did not plot data at those frequency/intensity combinations where the vibratory responses from two or more of the mice included in the average were below the noise floor. Student's paired or nonpaired t tests were used as indicated for comparisons of two groups, and ANOVA testing was used for three or more groups.
Tuning curve sharpness was quantified by calculating the Q10 dB. We first identified the frequency of the peak vibratory response at the lowest stimulus intensity used, the CF. The bandwidth 10 dB below the vibratory magnitude at this frequency was then determined. The Q10 dB is the CF divided by the bandwidth.
Scanning electron microscopy.
Inner ears from P35 CBA/CaJ mice were dissected in fixative (2.5% glutaraldehyde; 4% formaldehyde; 0.05 mm HEPES buffer, pH 7.2, 10 mm CaCl2, 5 mm MgCl2, 0.9% NaCl). A hole was poked at the apex of the cochlea, and fixative was flushed through the round window. The samples were fixed first for 2 h at room temperature in this fixative, then in 1% osmium tetroxide in washing buffer (0.05 mm HEPES buffer, pH 7.2, 10 mm CaCl2, 5 mm MgCl2, 0.9% NaCl) for 1.5 h, and then rinsed extensively in washing buffer. The samples were dissected in the washing buffer to remove the stria vascularis, Reissner's and TMs. The samples were refixed in 1% osmium tetroxide in washing buffer for 1 h then rinsed extensively again. Finally, the samples were dehydrated and processed to critical drying point (Autosamdri-815A, Tousimis). The cochleae were mounted on a stud with silver paint and sputter coated with 5 nm of iridium (EMS150T S; Electron Microscopy Sciences). Samples were imaged at 5 kV with a FEI Magellan 400 XHR Field Emission Scanning Electron at the Stanford Nano Shared Facilities. The length of the tallest row of OHC stereocilia in the apical turn, approximately a half-turn down from the helicotrema (where we made the vibratory measurements), was estimated using the scale bars of the original scanning electron microscopy pictures.
Results
We studied anesthetized P28-P40 CBA/CaJ mice in vivo. We used VOCTV to measure sound-induced vibrations within the cochlea noninvasively, approximately a half-turn down from the apex (Lee et al., 2015). Because OHC stereocilia are deflected by the radial shear between the RL and the TM, whereas the transverse motion of the BM is the most commonly published measurement of cochlear mechanics, we focused our analyses on these three measurements. To provide a convenient nomenclature, we labeled the vectors of motion by placing a subscript after the structure being measured. Examples include the BMT, the radial motion of the RL (RLR), and the radial motion of the TM (TMR).
Data from one representative mouse are presented as an example (Fig. 2). However, to assess for differences quantitatively, we averaged responses measured from a cohort of six CBA/CaJ mice both living and dead (Fig. 3). One of the mice moved slightly during the euthanasia process and thus only five of the mice were averaged in the dead condition. The transverse and radial motion of all three structures (BM, RL, and TM) were calculated. The CF was defined as the frequency of maximal vibratory amplitude of transverse BM in a live mouse at the lowest stimulus intensity tested, which was 10 dB SPL. Because the CF at the recording locations varied slightly between mice, we frequency-shifted the data by up to ±0.5 kHz so that the CF for all mice became 10 kHz. This facilitated averaging of the responses.

Vibration data for the BM, RL, and TM from a representative CBA/CaJ mouse. Motion in both the transverse (subscript T) and radial (subscript R) directions are presented. A–F, Displacement magnitude in live mice. G–L, Displacement magnitude in dead mice. M–R, Gain curves in live mice, calculated by normalizing the displacement magnitude of each structure to the ossicular chain. S–X, Displacement phase in live mice (top curves) and dead mice (bottom curves), normalized to the ossicular chain. The CF in the live mouse was ∼10 kHz, whereas the frequency of maximal vibration (BF) in the dead mouse was ∼5 kHz. Thus, there are differences in the frequency response of the cochlear vibrations in the live and dead mouse measured at the same location. This is an equivalent way of demonstrating a shift in the location of the traveling wave peak (i.e., compare the locations of the peaks of the dotted lines in the top and bottom tracings in Fig. 1A).

Average vibration data for the BM, RL, and TM from 5 or 6 CBA/CaJ mice. Motion in both the transverse (subscript T) and radial (subscript R) directions are presented. A–F, Displacement magnitude in live mice. G–L, Displacement magnitude in dead mice. M–R, Gain curves in live mice, calculated by normalizing the displacement magnitude of each structure to the ossicular chain. S–X, Displacement phase in live mice (top curves) and dead mice (bottom curves). Error bars indicate SEM.
BMT, RLT, and TMT
In live mice, the BMT demonstrated the classic findings of cochlear amplification (Figs. 2A, 3A) (Robles and Ruggero, 2001). First, there was compression of the vibratory responses, consistent with a nonlinear active process that provides more gain for low-intensity than for high-intensity stimuli. This was particularly obvious near the CF (10 kHz). Second, the frequency of maximal vibration (termed the best frequency [BF]) increased as the stimulus intensity decreased so that it was 5 kHz at 80 dB sound pressure level (SPL) compared with 10 kHz at 10 dB SPL. Last, the frequency response of the vibration became more sharply tuned as the stimulus intensity was decreased. In contrast, dead mice had purely passive responses, which were tuned broadly at 5 kHz and varied linearly with stimulus intensity (i.e., there was no compression) (Figs. 2G, 3G).
The transverse motion of the RL (RLT) and TM (TMT) were then compared with the BMT. At the lowest stimulus intensity tested, 10 dB SPL, the RLT and TMT had larger vibratory magnitudes than the BMT at the CF (Fig. 3A–C; 10 kHz; BMT: 4.90 ± 0.71 nm; RLT: 8.07 ± 1.89 nm; TMT: 12.18 ± 2.37 nm; p = 0.07 and p = 0.02 respectively, paired t test). However, the phase responses of the BMT, RLT, and TMT at CF were similar (Fig. 3S–U; BMT: −2.33 ± 0.06 cycle; RLT: −2.25 ± 0.04 cycle; TMT: −2.28 ± 0.07 cycle; p = 0.645, ANOVA). These findings are consistent with recent published reports (Lee et al., 2015; Ren et al., 2016).
Interestingly, however, we found that the frequency responses of the RLT and TMT were flatter than that of the BMT, particularly at low frequencies. This was most obvious after normalizing the vibratory responses to that of the middle ear to show the cochlear gains (Fig. 3M–O). We calculated the stimulus level dependence of the gain at CF by dividing the gain at 10 dB SPL by that at 80 dB SPL. At CF, there was no difference between the three calculations (10 kHz; BMT: 59.6 ± 2.4 dB; RLT: 60.4 ± 1.3 dB; TMT: 58.8 ± 1.7 dB; p = 0.820, ANOVA). We repeated this calculation below CF, although we had to use the gain at 30 dB SPL rather than 10 dB SPL because of the lower vibratory magnitudes at this frequency. This demonstrated that, below the CF, the RLT and the TMT clearly had larger level dependences to their gain (5 kHz; BMT: 5.3 ± 0.7 dB; RLT: 16.5 ± 2.2 dB; TMT: 12.8 ± 1.3 dB; p = 0.020 and p = 0.049 respectively, paired t test). This argues that OHCs are activated below CF and produce force to displace the RL and TM, even though this is not as strongly represented in the BMT response, suggesting that the impedances of the RL and TM are different from that of the BM.
Regardless of the low-level amplification found at low frequencies, these data demonstrate that, at the tonotopic location of the cochlea we studied, the passive mechanics of the basilar membrane were broadly tuned at ∼5 kHz, whereas the active mechanics associated with cochlear amplification were sharply tuned at ∼10 kHz. Therefore, the rest of our analyses focused on comparing the RLR and TM to the BMT at or near these two frequencies.
RLR and TMR
The radial motion of the RL (RLR) and TM (TMR) demonstrated features similar to, but not exactly like their transverse motion. Thus, there were compressive nonlinearities in living mice that disappeared after death (Fig. 3E,F), and the phase responses demonstrated a progressive lag as the frequency was increased (Fig. 3W,X). However, the shapes of the curves were not identical. In live mice (Fig. 3A,E,F), the CF was similar among the three measurements (BMT: 10.0 ± 0 kHz; RLR: 10.25 ± 0.17 kHz; TMR: 10.37 ± 0.12 kHz; p = 0.123, ANOVA). However, the BF at 80 dB SPL was higher for the RLR and TMR measurements (BMT: 5.25 ± 0.25 kHz; RLR: 6.58 ± 0.24 kHz; TMR: 7.00 ± 0.29 kHz; p = 0.005 and p = 0.002 respectively, paired t test). The tuning curve sharpness at 10 dB SPL, defined by the Q10 dB, was similar for the three measurements (BMT: 3.47 ± 0.14; RLR: 3.52 ± 0.17; TMR: 3.71 ± 0.28; p = 0.692, ANOVA). The level dependence of the gain was similar between the BMT, RLR, and TMR at CF (10 kHz, 10–80 dB SPL comparison; Fig. 3M,Q,R; BMT: 59.6 ± 2.4 dB; RLR: 58.9 ± 1.2 dB; TMR: 55.6 ± 3.1 dB; p = 0.475, ANOVA). However, the differences in the level dependence of the gain were prominent below CF (5 kHz; BMT: 4.1 ± 0.5 dB; RLR: 16.2 ± 2.5 dB; TMR: 11.2 ± 1.0; p = 0.02 and p = 0.05 respectively, paired t test). Together with the previously presented data on transverse vibrations, these data indicate that, below CF, the transverse and radial movements of both the RL and TM are more sensitive measures of amplification than the transverse movement of the BM.
In dead mice (Fig. 3G,K,L), the radial motion of the RL and TM and the transverse motion of the BM all demonstrated linear, passive responses. However, visual inspection of shapes of the tuning curves suggested differences in tuning. We therefore compared the Q10 dB values of these three structures (BMT: 1.23 ± 0.11; RLR: 1.06 ± 0.06; TMR: 0.86 ± 0.04) and found that the Q10 dB of the BMT was not statistically different from that of the RLR, but the Q10 dB of the BMT was more sharply tuned than that of the TMR (p = 0.295 and p = 0.035, respectively). These differences in tuning primarily appeared to extend the high-frequency response of the TMR (and to a lesser extent, the high-frequency response of the RLR) compared with the BMT. In contrast, the low-frequency responses were similar between the three measurements.
Normalized RLR and TMR
To better quantify their frequency responses, we normalized the radial motion of the RL and TM to the transverse motion of the BM (Fig. 4A,B,F,G). In live mice, these analyses revealed sharply tuned responses centered at 11 kHz. In dead mice, a similar pattern was found. However, because the raw magnitudes of all vibrometry measurements diminished >11 kHz, we could not assess whether or not the normalized response dropped off above this frequency.

Radial tuning in 6 living (top row) and dead (bottom row) CBA/CaJ mice. A, B, F, G, The magnitudes of the RLR and TMR were normalized to the BMT. The differences in the response amplitudes at 5 and 10 kHz to 80 dB SPL stimuli are highlighted (arrows, mean ± SEM). These data show that RLR and TMR are tuned to be maximal near the characteristic frequency of ∼10 kHz, in both live and dead mice. C, D, H, I, The phase of RLR and TMR normalized to the phase of BMT. E, J, The phase difference between TMR and RLR. Error bars indicate SEM.
In live mice, there was evidence for gain that was intensity-dependent at 5 kHz, consistent with the low level of cochlear gain we identified in the RL and TM vibratory measurements below CF. However, there was no intensity dependence to the response at 11 kHz. Dead mice had no intensity dependence to these normalized responses at any frequency.
The increases in the relative radial motions of the RL and TM when comparing the responses to 11 and 5 kHz stimuli were substantial. In some cases, this difference reached nearly 40 dB (i.e., 100× greater; Fig. 4A,B,F,G, arrows). Importantly, however, these differences in the frequency responses were largest when cochlear amplification was least relevant (i.e., live mice at an 80 dB SPL stimuli or dead mice at any stimulus intensity). Therefore, it appears that, because of passive filtering unrelated to BM mechanics, the RLR and TMR are reduced compared with the BMT below at frequencies considerably below the CF but are increased compared with the BMT near and at the CF.
The relative phase also changed as a function of frequency and intensity (Fig. 4C,D,H,I). In both live and dead mice, the RLR phase led the BMT phase as the stimulus frequency was increased. In live mice, the TMR phase demonstrated a similar response, whereas in dead mice the TMR phase lagged the BMT phase. The phase of the radial motion of the TM demonstrated a frequency-dependent lag relative to the RL, which extended to lower frequencies as the stimulus intensity was increased (Fig. 4E,J).
These findings indicate that the radial motion of the hair cell epithelium is tuned differently than the BM upon which it sits. If tuning were identical, the normalized responses would show no frequency dependence. Instead, radial motion is enhanced near CF. Because this phenomenon is found in dead mice, OHC force production is not necessary to provide this tuning. Thus, we demonstrate a passive, frequency-dependent contribution to cochlear filtering that is distinct from BM filtering. This is the key finding of this report.
Estimation of stereociliary deflection
We then sought to predict the effect that radial tuning of the TM and RL would have on OHC stimulation. OHC stereocilia are rooted in the cuticular plates at the apical end of the hair cell, which form the RL. The tips of the tallest row of stereocilia are attached to the undersurface of the TM. Thus, performing a vector subtraction of the TMR and RL provides an estimate of stereociliary displacement (STR) as follows:
 This calculation takes into account the vibratory magnitude and phase of each structure.
It is important to recognize that this calculation should only be considered an estimate because we cannot visualize OHC stereocilia with our VOCTV system. We must therefore assume that the vibration data at the points we measured in the TM and RL accurately represent what is actually happening at the tips and base of the stereocilia, respectively. These are reasonable assumptions because previous data have demonstrated that the RL is rigid and vibrates as a stiff element (Tilney et al., 1980; Drenckhahn et al., 1982; Furness et al., 2008; Nowotny and Gummer, 2011). Similarly, ex vivo data argue that stereociliary bundles should drive the TM to vibrate as a single bulk at one cochlear location, essentially acting like a series of coupled rigid bodies (Ghaffari et al., 2007; Gu et al., 2008). The limited in vivo data available also support this notion that the vibration in the body of the TM is the same as that along the bottom edge, where the OHC stereociliary bundles attach (Lee et al., 2015). However, the stereocilia may undergo dynamic length changes, causing the tip to indent the TM and move more than predicted (Hakizimana et al., 2012). Furthermore, the deflection of the stereocilia may not be precisely at the 90° radial angle, and so the absolute values we measure may be off by the cosine of the actual angle.
To estimate the angular deflection of the stereociliary bundle, we measured the length of the OHC stereocilia in our mouse model. Scanning electron microscopy was performed in the CBA/CaJ mouse cochlea at the location where we made the vibratory measurements, a half-turn down from the apex. From the images, the length of the tallest row of OHC stereocilia in the location where we made the vibratory measurements was ∼1 μm (Fig. 5A,B). This measurement is consistent with previously published data. For example, while our measurement is shorter than published measurements of OHC stereocilia from the apical end of P6-P7 Swiss Webster, CD-1, or C57BL/6 mice, which range from ∼2 to 3.7 μm (Stauffer and Holt, 2007; Lelli et al., 2009), it is larger than measurements made from adult C57BL/6 mice, which were ∼0.6 μm (Narayanan et al., 2015). Thus, we estimated the angular deflection of the stereociliary bundle (ϴ) using the length of the tallest row of OHC stereocilia (ℓ = 1 μm) with the following formula:
 Stereociliary deflection estimates demonstrated features of cochlear amplification in live mice, including compression and intensity-dependent shifts in the BF and tuning curve sharpness (Fig. 5C,D,G,H). For example, at 10 dB SPL, the peak magnitude of stereociliary displacement was 8.3 ± 0.7 nm (0.49 ± 0.04°) at the CF of 10.2 ± 0.3 kHz. At 80 dB SPL, the peak magnitude of stereociliary displacement was 151.2 ± 9.6 nm (8.60 ± 0.55°) at the BF of 6.5 ± 0.4 kHz. In contrast, dead mice demonstrated linear responses and reduced stereociliary deflection. At 80 dB SPL in live mice, the BF of stereociliary deflection was higher than the BF of the transverse motion of the BM (compare Fig. 5C vs Fig. 3A; 7.1 ± 0.4 kHz vs 5.2 ± 0.3 kHz for live mice, p = 0.011, paired t test) and was similar in dead mice. Finally, the phase of stereociliary deflection was similar in live and dead mice.

Estimated stereociliary bundle deflection in the radial direction (STR). A, B, Scanning electron microscopy images of representative OHC stereociliary bundles from the location we measured vibratory responses. We estimated the length of the tallest row of stereocilia to be 1 μm and used this to estimate angular deflection of the bundle from the displacement data. C–J, Data from 6 live (top row) and 5 dead (bottom row) mice are shown, including estimates of the raw magnitude (C, G) and phase (D, H) estimates and the responses normalized to the BMT (E, F, I, J). Error bars indicate SEM. The differences in the normalized magnitude responses at 5 and 10 kHz to 80 dB SPL stimuli are highlighted (arrows, mean ± SEM) and demonstrate tuning at the characteristic frequency in both live and dead mice.
We normalized the estimated deflection of the stereocilia to the BMT (Fig. 5E,F,I,J). In both live and dead mice, the relative deflection of the stereocilia was greatest at ∼10–11 kHz. Compared with the relative stereociliary deflection at 5 kHz, this increased response ranged from 18.8 ± 2.3 to 35.0 ± 4.4 dB (i.e., 8–56× greater). In both live and dead mice, the phase of stereociliary deflection led the phase of the basilar membrane at higher frequencies.
Thus, these estimates indicate that, although OHCs are stimulated over a broad frequency range, the feedback loop associated with the forces they produce is sharply tuned relative to BM motion. Our data suggest that feedback associated with the amplification process is reduced at frequencies far below the CF, whereas feedback is enhanced near the CF.
Tonotopic distribution of stereociliary tuning
To verify that the frequency dependence of our estimates of OHC stereociliary deflection reflected the tonotopic map of the cochlea, we measured the TMR and RL at three different longitudinal locations from three different mice (Fig. 6). The CFs of these locations were 10, 11.5, and 12.5 kHz. All of the estimates of OHC stereociliary deflection magnitude and phase had similar patterns that were simply shifted in frequency. After death, stereociliary deflection was reduced and became linear; however, the phase was unaffected. In two of the mice, we were also able to record the BMT. Normalizing the stereociliary deflection to basilar membrane transverse motion revealed a frequency shift in the maximal point of the magnitude ratio, consistent with a shift in the tonotopic map. In the third mouse, we could not make this comparison to the basilar membrane transverse motion because the angle was limited surgically to only permit a purely radial measurement. Together, these findings confirm that OHC stereociliary bundles are stimulated relatively more at frequencies above the BF of the basilar membrane, and that this occurs in dead mice, where OHCs do not produce force. This suggests that the stereociliary bundles of OHCs are tuned by passive mechanical properties so that they are stimulated with the proper frequency response for their tonotopic location along the length of the cochlea.

Representative stereociliary displacement estimates in the radial direction (STR) at three different longitudinal locations (Locations 1–3) in CBA/CaJ mice when live (blue) or postmortem (gray). Each measurement point was shifted by ∼200 μm from each other, and the CFs were 10, 11.5, and 12.5 kHz (red lines). A–C, Displacement magnitude of STR. D–F, Displacement phase of STR. G, H, Displacement magnitude of STR normalized to that of BMT. A ratio could not be calculated for location 3 because movement was measured from only one image that was collected at a purely radial angle (θ = 90°), due to anatomic limitations.
What is the role of the TM?
Radial tuning of the TM has been shown in vitro (Ghaffari et al., 2007; Sellon et al., 2015). To test whether the radial tuning we measured in vivo derived from the TM, we studied TectaC1509G/C1509G mice. In this model, the TM is malformed, is completely elevated off of the epithelium, does not contact stereocilia from any of the three rows of OHCs, and does not stimulate the OHCs (Xia et al., 2007; Liu et al., 2011). Therefore, for the purposes of this experiment, the radial motion of the RL is independent of TM motion, and the presence or absence of radial tuning can be assessed. On the other hand, because the TM will be stimulated by the fluid between it and the underlying hair cell epithelium, its motion will not be independent of RL motion. Furthermore, the TM has altered mechanical properties because of the Tecta mutation, and thus its response is unlikely to reflect that of a normal TM.
The transverse vibratory response of the basilar membrane was passive and, like dead CBA/CaJ mice, peaked at 4–5 kHz (Fig. 7A,F). The RLR, although passive like the BMT, had an enhanced response at higher frequencies somewhat like that found in dead CBA/CaJ mice (Fig. 7B,G). TMR was also present, which surprisingly demonstrated a second peak centered at 10 kHz (Fig. 7C,H). Whereas the phase of the BMT and RLR responses was similar, the TMR had less of a frequency-dependent phase lag. When normalized to the BMT, both the RL and TM demonstrated enhanced vibration magnitude at 10 kHz compared with 5 kHz like in dead CBA/CaJ mice (Fig. 7D,E). This enhancement was larger for the TM compared with the RL (RLR: 13.1 ± 3.0 dB, TMR 32.1 ± 5.6 dB, p = 0.017, paired t test).

BMT, RLR, and TMR motion in 5 TectaC1509G/C1509G mice. A–C, Displacement magnitudes of BMT, RLR, and TMR. F–H, Displacement phase of BMT, RLR, and TMR. D, E, The magnitude of RLR and TMR normalized to the magnitude of BMT. The differences in the responses at 5 and 10 kHz to 80 dB SPL stimuli are highlighted (arrows, mean ± SEM). As in CBA/CaJ mice, the radial motion of both structures was tuned to the characteristic frequency in both live and dead mice. The normalized responses of dead CBA/CaJ mice to 80 dB SPL stimuli taken from Figure 4F, G are shown for reference (gray). I, J, The phase of RLR and TMR minus the phase of BMT. The normalized responses of dead CBA/CaJ mice to 80 dB SPL stimuli taken from Figure 4H, I are shown for reference (gray). There was a large phase difference in the TM phase between CBA/CaJ and TectaC1509G/C1509G mice, which was quantified at 10 kHz (arrow).
The phase difference between the RLR and the BMT was similar to that of dead CBA/CaJ mice (Fig. 7I). However, the phase difference between the TMR and the BMT led that of dead CBA/CaJ mice near the CF (Fig. 7J). For example, at 10 kHz the TMR phase led the BMT phase by 0.74 ± 0.15 cycles in TectaC1509G/C1509G mice but lagged by 0.21 ± 0.08 cycles in dead CBA/CaJ mice, a phase shift of nearly one cycle (p = 0.013, paired t test). These findings were paralleled in the transverse motion of the RL and TM. Consistent with a lack of tethering between the TM and the RL, the phase of the transverse motion of the transverse motion of the TM and basilar membrane differed near the CF in TectaC1509G/C1509G mice but not in CBA/CaJ mice (Fig. 8).

Phase difference between the transverse vibration of the TM and the BM: (A) in 6 live CBA/CaJ mice; (B) in 5 dead CBA/CaJ mice; and (C) in 5 live TectaC1509G/C1509G mice. The TM in TectaC1509G/C1509G mice has a phase difference from the BM near CF, whereas there is no phase difference in wild-type mice.
The frequency-dependent phase differences between the TM and the basilar membrane in TectaC1509G/C1509G mice are consistent with the TM being detached from the underlying epithelium in this mutant strain. However, because RL motion was similar in mice with either an attached or detached TM, we interpret these data to indicate that the radial tuning of the RL is not significantly imparted by the mechanical properties TM.
Micromechanical interactions within the organ of Corti
To better understand the basis of radial motion within the RL, we assessed the interactions between various subregions of the organ of Corti. We presented pure tone stimuli and measured vibratory responses from every voxel over the cross-section of the organ of Corti. As before, this measurement was performed at two different angles. Off-line, the images were segmented and the magnitudes and phases from each of 16 discrete locations were determined (Fig. 9A–C). We then calculated the 2-D motion pattern of each location. Within each image, vibratory phases at every location were referenced to the phase of the center of the basilar membrane, which was set to 0°, and we averaged the responses from 5–7 mice. Images demonstrating the motion over one sound cycle were created, by creating circles to plot the 2-D vibration magnitude, and coloring the circle to represent phase (Fig. 9D–J). We scaled the magnitudes of all locations within each image equally to make the motion easy to visualize. To aid with interpretation, movies were also created to show the motion (Movie 1).

2-D motion of the organ of Corti. A, We quantified vibration at 16 different measurement points. These points were chosen to correspond with the segmentation pattern shown superimposed on an anatomic OCT image. B, C, A representative example of the vibration magnitude and phase responses to a 10 kHz, 10 dB SPL sound stimulus measured at one angle. The vibratory responses were pseudocolored on the corresponding anatomic image, and the segmentation model was overlaid. D–J, Reconstructed 2-D motions at the 16 measurement points measured under different conditions. Each image represents average data from 5–7 mice. Data from live CBA/CaJ (D–F), dead CBA/CaJ (G, H), and TectaC1509G/C1509G (I, J) mice are shown. Left column, Data collected at a stimulus frequency below the CF (5 kHz). Middle and right columns, Near the CF (8–10 kHz). Tracing pattern at each point represents the vibration shape. Color gradient represents the vibration phase. Inset, 2-D motion of tip of the stereocilia relative to its root. The displacement tracings are magnified to permit clear visualization. Scale bars reflect the vibratory magnitude, not image size.
Two-dimensional motion of the organ of Corti. This movie is an animation of the data contained in Figure 9. Left column, Data collected at a stimulus frequency below the CF (5 kHz). Middle and right columns, Near the CF (8–10 kHz). Sound stimulus is at 5 kHz and 80 dB SPL, 10 kHz and 80 dB SPL, and 10 kHz and 20 dB SPL in CBA/CaJ live mice for the first row, 5 kHz and 80 dB SPL and 8 kHz and 80 dB SPL in CBA/CaJ dead mice for the second row, and 5 kHz and 80 dB SPL and 8 kHz and 80 dB SPL in Tecta live mice for the third row. Inset, 2-D motion of tip of the stereocilia relative to its root.
In both live and dead CBA/CaJ mice, the predominant vector of motion at 5 kHz for most locations was in the transverse direction (Fig. 9D,G). The entire organ of Corti vibrated nearly in phase, and there was little suggestion of changes in OHC length as might be expected if electromotility were occurring. However at 10 kHz, a larger component of radial motion was found in the structures above the basilar membrane in (Fig. 9E,F). At 20 dB SPL, when cochlear amplification is large relative to the passive motion of the organ of Corti, features suggestive of OHC electromotility were obvious (compare the motion patterns at the apical and basal ends of the OHC region in Fig. 9F).
In dead CBA/CaJ mice, we could not study responses at 10 kHz because the vibratory magnitude for many voxels in the image were below the noise floor due to the fall off in the traveling wave without amplification. Therefore, we used 8 kHz stimuli to achieve a compromise between being close to the CF and being able to record vibratory responses. At 8 kHz, radial movements of the TM and RL were antiphasic and enhanced the deflection of the OHC stereocilia (Fig. 9H), although this was not seen at 5 kHz (Fig. 9G). Using the same stimulus presentation strategy in live TectaC1509G/C1509G mice, the frequency dependence of the response was dramatic (Fig. 9I,J). All locations vibrated transversely in phase at 5 kHz, but there was dramatic antiphasic RLR and TM at 8 kHz. These 2-D vibratory data demonstrate that, below the CF, the pattern of motion of all structures is transverse and nearly in-phase. However, near the CF, the vibratory pattern becomes more complex, and this involves the emergence of radial motion within the hair cell epithelium and TM.
Discussion
OHCs produce cochlear amplification by selectively providing mechanical gain to achieve the wide dynamic range and exquisite frequency selectivity that distinguish mammalian hearing from that of all other animals (Manley, 2000; Ashmore, 2008; Dallos, 2008). All previous in vivo studies of cochlear mechanics have been made by measuring vibrations in the transverse direction, typically from the basilar membrane. However, hair cell stereocilia are oriented to be stimulated in response to radial forces. Here we show that radial motion within the organ of Corti is tuned to the frequency where cochlear amplification occurs rather than the frequency to which the underlying BM is tuned. The radial tuning of the RL and TM is measurable both in a dead cochlea where OHCs do not produce force and in Tecta mutants where OHC stereocilia are not stimulated, indicating that radial tuning derives from passive mechanical properties. Because radial tuning peaks at the characteristic frequency, these data suggest that radial tuning of the RL and TM produce selective stimulation of OHCs and thus might be, at least in part, responsible for tuning cochlear amplification to achieve sharp frequency selectivity (Fig. 10A).

A, Summary of the micro-mechanical motion within the organ of Corti below and near the CF. Motion is predominantly transverse and in phase below CF, whereas more complex motion, including radial movement of the hair cell epithelium, occurs near CF. B, A hypothetical system diagram of cochlear amplification. Bode plots provide a schematized form of the transfer functions that filter the response between the sites where we made vibratory measurements. The input sound pressure, (s(t)), is initially filtered to create a traveling wave with broad cochlear tuning when measured at the BM. Additional filtering within the organ of Corti creates radial responses within the TM and RL, which are more sharply tuned and antiphasic at the characteristic frequency. The difference between these responses creates STR. The complex OHC transfer function, which we did not measure, converts this into force, which then drives BM motion through a positive feedback loop. C, Schematized Fourier Transforms (FT) of the various vibratory responses at the various points in the system diagram for live (red) and dead (blue) mice.
Because of the potential for variations in our measurements due to technical limitations, the actual vibratory displacements of the structures may be different from what we measured. This is particularly relevant for our estimates of OHC stereociliary bundle deflection because we cannot directly visualize the stereociliary bundles with VOCTV. We estimated the potential for errors by assuming a tilted imaging angle of ±10° longitudinally (producing 1.5% variation in all displacement data), a variation of orientation angle of stereociliary bundles of ±10° with respect to the transverse axis we defined (producing a 1.5% variation in stereociliary displacement), or a variation of stereociliary length of ±0.25 μm (producing a 20%–30% variation in stereociliary angular deflection). Thus, together, our estimates of stereociliary bundle displacement could be off by as much as 3% and our estimates of stereociliary angular deflection could be off by as much as 35%.
Nevertheless, our data provide reasonable estimates of OHC stereociliary bundle deflections under normal listening conditions in vivo; and more importantly, they support the conclusion of passive filtering due to radial motion, regardless of the accuracy of the deflection magnitude estimates. For every 1 nm of BM displacement, bundle deflection is ∼0.1–0.2 nm (0.01°) when the stimulus frequency is below the CF and 5–8 nm (0.3°-0.5°) when the stimulus frequency is at the CF. Furthermore, the maximum bundle deflection to a relatively loud stimulus (80 dB SPL) is ∼150 nm (8.5°) below CF and ∼50 nm (2.9°) at CF. In dead mice, we estimate that the maximum bundle deflection to a relatively loud stimulus (80 dB SPL) at 5 kHz, where BM vibratory response peaks, is ∼30 nm (1.7°). This corresponds to a bundle deflection of 0.12 (0.01°) for every 1 nm of BM displacement, which is similar to that found in the live mouse below CF.
Our estimates of stereociliary bundle motion in the dead mouse and the live mouse below CF, which predominantly reflects passive mechanics with little contribution of cochlear amplification, agree with previous reports, although the experimental conditions were quite different. This includes modeling predictions (Neely and Kim, 1986; Steele et al., 2009; Nam et al., 2015), ex vivo hair cell patch-clamp studies of transduction (Ricci et al., 2005; Stauffer and Holt, 2007), and in vitro preparations (Chan and Hudspeth, 2005; Fridberger et al., 2006). For example, transduction currents measured in single OHCs demonstrate that 90% of the conductance occurs with a 151 nm (2.0°) deflection (Géléoc et al., 1997). Although this measurement was not done at acoustic frequencies, it still corresponds well with our bundle deflection estimates to 80 dB SPL stimuli. Similarly measurements in the gerbil hemicochlea demonstrate that the angular deflection of OHC stereociliary bundle corresponding to a 10%–90% activation of transducer conductance is 1.9°-2.1° and the OHC bundle deflection is 0.01°-0.04° per nm of BM displacement (He et al., 2004). Our angular deflection estimate for stimuli below the CF also agrees with this measurement nicely.
Our data demonstrate that, in a purely passive condition, OHCs are stimulated over a relatively broad frequency range. However, relative to the basilar membrane motion, they are sharply tuned to be stimulated more near the CF. This finding is important because, in live mice, the positive feedback provided by OHC force production (Guinan et al., 2012) is likely to further enhance OHC stimulation at the CF. Our hypothetical model of the impact of this frequency response is shown in Figure 10B, C. Although there is evidence of a low level of cochlear gain below CF when measured at the RL and TM, this does not significantly impact the BM response. Only when the radial motion of the organ of Corti enhances OHC stimulation does amplification becomes maximal. This is consistent with several models of cochlear amplification (Shera, 2007; de Boer et al., 2007), as well as the limited in vivo experimental data that are available (Nilsen and Russell, 2000; Chen et al., 2011; Fisher et al., 2012; Ramamoorthy et al., 2014) and ex vivo (Hu et al., 1999; Cai et al., 2003; Karavitaki and Mountain, 2007b). In particular, our data strongly support previously published data showing that targeted photo inactivation of prestin well to the base of the CF does not alter cochlear gain, whereas inactivation of prestin just basal to the peak of the CF significantly reduces gain (Fisher et al., 2012). Furthermore, our data extend this finding by suggesting that the mechanism why the local activation of prestin-based electromotility tunes cochlear amplification is because the passive tuning of the radial motion of the hair cell epithelium begins to promote OHC stimulation and increase positive feedback just below CF.
The findings in TectaC1509G/C1509G mice suggest that the source of the additional filtering that tunes OHC stereociliary stimulation, at least in part, derives from within the epithelium. It is unlikely to derive from processes associated with OHC electromotility, as electrical stimulation evokes broadband rather than tuned vibratory responses in isolated OHCs (Frank et al., 1999) and in TectaC1509G/C1509G mice (Ren et al., 2016). The mammalian cochlea evolved not only the specialized force-producing OHC, but also a highly structured framework of cells that sit on top of the basilar membrane (Manley, 2012). These cells (including Deiters', pillar, Hensen's, Boettcher's, and Claudius' cells) not only support and orient the hair cells, but also form a cross-linked, truss-like network both in the radial and longitudinal directions (Spicer and Schulte, 1994). It is possible that the passive mechanical properties of the supporting cells establish the frequency response of radial motion, and that these properties vary along the length of the cochlea in a tonotopic distribution.
Another source of additional filtering within the cochlea is likely to be the TM. Tuning in the radial direction has been identified within the excised TM (Ghaffari et al., 2007; Sellon et al., 2015). In mutant mice in which the TM is attached to the stereociliary bundles, but has abnormal mechanics, frequency tuning is altered (Russell et al., 2007; Ghaffari et al., 2010). Consistent with this, the data we show here demonstrate that the TM does not simply follow the movements of the underlying cochlear epithelium but instead has different frequency-dependent changes in its vibration patterns. Given that the TM is constructed by proteins secreted by the supporting cells during development of the organ of Corti, it is conceivable that both structures develop the mechanical properties that underlie their tuning in synchrony.
In conclusion, our data indicate that micromechanics within the mammalian cochlea are complex and involve a significant radial component that appears to be controlled by the passive mechanics of the organ of Corti. This radial tuning may play a role in determining which OHCs will be stimulated, thus tuning cochlear amplification at the selected cochlear location. Why might sharp frequency tuning have evolved to be controlled by a different mechanism than gain? Separating these features eliminates some of the downsides that would occur if a single active process provided both gain and tuning. The benefits of cochlear gain are that it improves the ability to hear quieter sounds and it extends the bandwidth of hearing to higher frequencies. However, without sharp frequency filtering before the amplification step, background noise would be increased together with the desired signal. Feedback would also be more of a problem. Indeed, both of these problems are the major concerns of patients who try hearing aids, which primarily provide gain (McCormack and Fortnum, 2013). Consequently, preamplification filtering is commonly used in hearing aid technology to reduce feedback and improve hearing in noisy background environments (Kates, 2005). Our data argue that there is sharp relative tuning within the passive organ of Corti that is unchanged in the active cochlea, and this relative tuning is part of the full picture of cochlear mechanics.
Notes
Supplemental material for this article is available at https://oghalailab.stanford.edu/. This includes a link to download the radial and transverse vibratory data. This material has not been peer reviewed.
Footnotes
This work was supported by National Institutes of Health, National Institute on Deafness and Other Communication Disorders Grants DC014450, DC013774, and DC010363, the Stanford Crack the Neural Code Seed Grant Program, and a Stanford Nano Shared Facilities Seed Grant. We thank Drs. Charles Steele, Sunil Puria, and Tony Ricci for helpful discussions; and Chris Gralapp for artwork.
The authors declare no competing financial interests.
- Correspondence should be addressed to Dr. John S. Oghalai, Department of Otolaryngology–Head and Neck Surgery, 801 Welch Road, Stanford, CA 94305-5739. joghalai{at}stanford.edu


