

Abstract
Hyperexcitable neuronal networks are mechanistically linked to the pathologic and clinical features of Alzheimer's disease (AD). Astrocytes are a primary defense against hyperexcitability, but their functional phenotype during AD is poorly understood. Here, we found that activated astrocytes in the 5xFAD mouse model were strongly associated with proteolysis of the protein phosphatase calcineurin (CN) and the elevated expression of the CN-dependent transcription factor nuclear factor of activated T cells 4 (NFAT4). Intrahippocampal injections of adeno-associated virus vectors containing the astrocyte-specific promoter Gfa2 and the NFAT inhibitory peptide VIVIT reduced signs of glutamate-mediated hyperexcitability in 5xFAD mice, measured in vivo with microelectrode arrays and ex vivo brain slices, using whole-cell voltage clamp. VIVIT treatment in 5xFAD mice led to increased expression of the astrocytic glutamate transporter GLT-1 and to attenuated changes in dendrite morphology, synaptic strength, and NMDAR-dependent responses. The results reveal astrocytic CN/NFAT4 as a key pathologic mechanism for driving glutamate dysregulation and neuronal hyperactivity during AD.
SIGNIFICANCE STATEMENT Neuronal hyperexcitability and excitotoxicity are increasingly recognized as important mechanisms for neurodegeneration and dementia associated with Alzheimer's disease (AD). Astrocytes are profoundly activated during AD and may lose their capacity to regulate excitotoxic glutamate levels. Here, we show that a highly active calcineurin (CN) phosphatase fragment and its substrate transcription factor, nuclear factor of activated T cells (NFAT4), appear in astrocytes in direct proportion to the extent of astrocyte activation. The blockade of astrocytic CN/NFAT signaling in a common mouse model of AD, using adeno-associated virus vectors normalized glutamate signaling dynamics, increased astrocytic glutamate transporter levels and alleviated multiple signs of neuronal hyperexcitability. The results suggest that astrocyte activation drives hyperexcitability during AD through a mechanism involving aberrant CN/NFAT signaling and impaired glutamate transport.
Introduction
Alzheimer's disease (AD) is the most common cause of dementia. Similar to other neurodegenerative diseases, AD is accompanied by profound glial activation (Bouvier and Murai, 2015; Heneka et al., 2015). Though most conspicuous around amyloid-β (Aβ) deposits at late disease stages, activated glial cells (i.e., microglia and astrocytes) also appear at the outset of clinical symptoms (Carter et al., 2012; Schöll et al., 2015; Yokokura et al., 2016), suggesting that glial modulation strategies could slow the progression of AD. However, the phenotype of activated glial cells is very complex (Oberheim et al., 2012; Prokop et al., 2013; Pekny et al., 2014; Malm et al., 2015; Andreasson et al., 2016; Liddelow et al., 2017), and more work is required to elucidate their functional impact in neurodegeneration.
In healthy brain, astrocytes fine-tune synaptic function and preserve neurite integrity by removing excitotoxic glutamate from the extracellular milieu (Huang and Bergles, 2004; Schousboe et al., 2004; Sattler and Rothstein, 2006). Genetic deletion or inhibition of astrocyte glutamate transporters in rodents causes hyperexcitability and/or excitotoxicity (Rothstein et al., 1996; Rao et al., 2001; Selkirk et al., 2005; Petr et al., 2015; Moidunny et al., 2016), while the promotion of glutamate-uptake imparts neuroprotection (Prow and Irani, 2008; Harvey et al., 2011; Zumkehr et al., 2015; Karklin Fontana et al., 2016). Network hyperexcitability is commonly observed in AD brain and AD mouse models (Palop et al., 2007; Busche et al., 2008; Minkeviciene et al., 2009; Noebels, 2011; Putcha et al., 2011; Bakker et al., 2012; Grienberger et al., 2012; Bomben et al., 2014; Kellner et al., 2014; Šišková et al., 2014; Vossel et al., 2016; Fontana et al., 2017) where it is thought to contribute to excitotoxic damage and cognitive loss. Diminished expression and/or functional impairment of astrocyte glutamate transporters is similarly associated with AD and AD-related pathology (Masliah et al., 1996, 2000; Abdul et al., 2009; Mookherjee et al., 2011; Schallier et al., 2011; Scimemi et al., 2013; Meeker et al., 2015; Audrain et al., 2016; Hefendehl et al., 2016; Xu et al., 2016), suggesting that impaired glutamate regulation is a key phenotypic trait of activated astrocytes and a primary mechanism for AD-related neurodegeneration.
Numerous intracellular mechanisms, including the Ca2+/calmodulin-dependent phosphatase calcineurin (CN), have been implicated in the phenotypic switching of glial cells with injury and disease (Furman and Norris, 2014; Pekny et al., 2016). CN is rapidly activated/inactivated by fluctuating Ca2+ levels within healthy cells but can become proteolyzed and irreversibly activated following neural damage (Wu et al., 2004, 2010; Huang et al., 2005; Liu et al., 2005; Shioda et al., 2006; Mohmmad Abdul et al., 2011). Proteolysis of CN is especially pronounced in astrocytes associated with Aβ pathology (Pleiss et al., 2016), leading to the hyperactivation of key substrates, such as the nuclear factor of activated T cells (NFATs; Mohmmad Abdul et al., 2011). NFAT activation is increased at early stages of AD-related cognitive decline (Abdul et al., 2009) and linked to altered glial phenotypes and neuroinflammation (Fernandez et al., 2007; Nagamoto-Combs and Combs, 2010; Serrano-Pérez et al., 2011; Rojanathammanee et al., 2015). Selective inhibition of astrocytic CN/NFATs normalizes the basal function and plasticity of glutamatergic synapses in mouse models of AD and brain injury (Furman et al., 2012; Furman et al., 2016), suggesting that at least some detrimental phenotypic traits of activated astrocytes arise from aberrant CN/NFAT signaling.
Here, we used in vivo and ex vivo measures to determine whether astrocytic CN/NFATs underlie glutamate dysregulation and possibly excitotoxicity in a highly aggressive AD mouse model. Adeno-associated virus (AAV)-mediated expression of an NFAT inhibitory peptide in hippocampal astrocytes of 5xFAD mice reduced the frequency of spontaneous glutamate transients and synaptic events, increased GLT-1 expression, prevented dendritic derangement, and normalized NMDA-to-AMPA receptor activity ratios. The results suggest that hyperexcitability in AD arises from the loss of critical glutamate regulatory properties in activated astrocytes due to aberrant CN/NFAT signaling.
Materials and Methods
Animals.
5xFAD mice (Oakley et al., 2006) and wild-type (B6/SJL) littermates were bred in a pathogen-free environment in accordance with University of Kentucky guidelines. Mice of either sex were used in this study and held in standard laboratory cages under 12 h light/dark cycles. The animals had access to food and water ad libitum. All animal procedures were conducted in accordance with the National Institutes of Health Guide for the Care and Use of Laboratory Animals and were approved by University of Kentucky Institutional Animal Care and Use Committees.
Hippocampal protein measures.
For CN protein measures, fresh-frozen hippocampus was thawed on ice for 10 min and then homogenized in sucrose buffer (0.25 m sucrose, 20 mm EDTA, pH 8.0, 20 mm EGTA, pH 8.0, 100 mm Tris, pH 7.4), supplemented with a protease and phosphatase inhibitor mix (catalog #Calbiochem 524625, catalog #Calbiochem 208733, and catalog #Calbiochem 539134, EMD Millipore). Resulting homogenate was aliquoted (150 μl) and then combined and gently mixed with an equal volume of RIPA buffer (Sigma-Aldrich) and incubated on ice for 45 min. Samples were then centrifuged at 13,000 rpm for 10 min, and the supernatant was stored at −80°C until use for Western blot analyses. For GLT-1 protein measures, hippocampal tissue was homogenized in ice-cold PBS supplemented with protease inhibitor mixture, phosphatase inhibitor mixture, and calpain inhibitor (all from Calbiochem) and then centrifuged at 20,800 × g for 30 min at 4°C. The resultant pellet was re-extracted by sonication in 2% SDS containing protease, phosphatase, and calpain inhibitors and centrifuged at 20,800 × g for 30 min. The supernatant was stored at −80°C until use.
Approximately 10–60 μg of protein (dependent on the antigen blotted) were resolved on 4–20% Criterion gradient gels (Bio-Rad) and transferred to Immobilon-FL PVDF membranes (Millipore). After washing and blocking in Odyssey protein blocking reagent (LI-COR), the primary antibodies were incubated with the blots overnight at 4°C as follows: calcineurin (anti-CN-Aα, catalog #07-1492, Millipore; RRID: AB_10563965); GFAP (catalog #13-0300, Invitrogen; RRID: AB_2532994); EAAT2/GLT-1 (catalog #ab41621, Abcam; RRID: 941782); and GAPDH (catalog #ab9484, Abcam; RRID: AB_307274). Following washes and incubating with secondary antibodies to mouse (800) or rabbit (700) primaries, blots were imaged on an Odyssey Scanner (LI-COR) and the quantification was performed using Image Studio 3.1 Software (LI-COR; RRID: SCR_013715).
Brain section preparation.
Brains were collected and fixed in 4% paraformaldehyde in phosphate buffer, pH 7.4, and then saturated with 30% sucrose buffer. Coronal sections at 40 μm thickness were prepared using a microtome (Leica) and kept at −20°C in cryoprotectant solution containing 25% ethylene glycol and 25% glycerin in 0.05 m phosphate buffer.
Immunofluorescent labeling and NeuN immunohistochemistry.
Brain sections were labeled following the free-floating protocol using the following primary antibodies: anti-GFAP (1:500; catalog #12389, Cell Signaling Technology; RRID: 28066914), anti-NFAT4 (1:50; catalog #sc-8405, Santa Cruz Biotechnology; RRID: AB_628014); anti-NeuN (1:1000; catalog #MAB377, EMD Millipore; RRID: AB_2298772); anti-MAP2 (1:500; catalog #4542, Cell Signaling Technology; RRID: AB_2144160); anti-EAAT2/GLT-1 (1:200; catalog #ab41621, Abcam; RRID: AB_941782); anti-Aβ (1:200; catalog #803007, BioLegend; RRID: AB_2564657); and anti-ΔCN (1:50). The anti-ΔCN is a rabbit polyclonal antibody custom-made in our laboratory to identify a 45–48 kDa proteolyzed CN fragment, based on the Lys 424 calpain-dependent cleavage site (Wu et al., 2004). This antibody was recently characterized using negative controls and peptide competitors as described by Pleiss et al., 2016. Secondary antibodies conjugated with fluorescence dye were obtained from Life Technologies. Specificity of primary antibody was confirmed by omitting primary antibodies or changing the fluorescence probe of the secondary antibodies. To enhance NFAT4 immunofluorescence, we used Teramide signal amplification kit (catalog #T20915, Life Technologies). After secondary antibody incubation, we washed the sections and performed the signal enhancement system according to the protocol of the kit. Sections were mounted with ProLong Antifade Mounting Medium (catalog #P36970, Life Technologies). Fluorescent confocal microscopic images were obtained from a Nikon Eclipse Ti microscope across a linear range to avoid undersaturated or oversaturated pixels. Changes in brightness and contrast were matched across images from different treatment conditions, and all images/fields used for quantification were randomly acquired to avoid experimenter bias. Nuclear NFAT4 localization images were obtained with a 100× objective in a Z-series (0.5 μm steps), and image analyses were performed using NIS Element software (Nikon; RRID: SCR_014329) and 3D reconstructions performed using Imaris 8.1.2 software (RRID: SCR_007370). For dendritic diameter measures, all images were acquired from a 100× objective in a Z-series (0.3 μm steps), and image analysis was performed via NIS Element software. For Aβ and GFAP label volume measures, all images were acquired at 40×. GLT-1 labeling intensity measures were performed at 40× with 2× digital magnification. Plaque volume, GFAP volume, and GLT-1 intensities were quantified by Imaris 8.1.2 software (RRID: SCR_007370).
For NeuN immunohistochemistry and neuron counting, every sixth coronal section from each mouse (8–10 sections/animal) was stained with anti-NeuN antibody (1:1000; EMD Millipore) using a free-floating protocol. Briefly, sections were incubated with 3% hydrogen peroxide in methanol for 30 min to block endogenous peroxidase. Background was blocked by incubating sections in a solution containing 3% bovine serum albumin (BSA), 0.5% Triton X-100, and 0.01 m PBS for 1 h. Sections were then incubated overnight in blocking solution containing primary antibody and then rinsed with 0.01 m PBS followed by incubation in biotinylated secondary antibody (Vector Laboratories) for 1 h, and incubation in biotin amplification solution (ABC Elite kit, Vector Laboratories) for another hour. After a PBS rinse, staining was developed with a DAB peroxidase (HRP) substrate kit (Vector Laboratories). Stained sections were mounted on glass slides, dehydrated in ethanol, cleared in Safeclear solution and coverslipped with Permount (Fisher Scientific). Slides were scanned using a ScanScope XT Scanner (Aperio) at 20× magnification, and positive pixels were visualized in ImageScope Software (Aperio). NeuN-positive cells were counted within a 300 μm region of the CA1 pyramidal neuron layer, which was selected randomly. Sample decoding was done after counting process to avoid bias between samples.
AAV vectors.
cDNA encoding enhanced green fluorescent protein (EGFP) from the pEGFPn1 vector (Clontech Laboratories), and VIVIT-EGFP (a gift from Dr. Anjana Rao, Harvard University, Cambridge, MA) was extracted and inserted into modified pAdlink vectors downstream of the human GFAP promoter Gfa2 (a gift from Dr. Michael Brenner, University of Alabama, Tuscaloosa, AL), as described previously (Abdul et al., 2009). pGfa2-EGFP and pGfa2-VIVIT-EGFP constructs were then inserted into pENN.AAV2/5 vectors for the creation of high-titer (1012 inclusion forming units/ml) AAV2/5 vectors at the University of Pennsylvania Viral Vector Core (Philadelphia, PA). Our previous work shows that AAV-Gfa2 vectors drive transgene expression selectively in astrocytes with no transgene expression observed in nonastrocyte cell types (Furman et al., 2012, 2016).
AAV delivery.
Wild-type and 5xFAD mice at 1.5–2 months of age were placed in a stereotaxic frame and anesthetized with isoflurane (2.5%) throughout the surgery process. AAV vectors or vehicle (5% glycerol) were loaded into a microinjector and delivered bilaterally into the hippocampus at a rate of 0.2 μl/min (total 4 μl; Furman et al., 2012). Hippocampal coordinates for this injection were −2.0 mm anteroposterior, ±1.5 mm mediolateral relative to bregma, and −1.5 mm dorsoventral relative to dura.
Radial arm water maze.
At 4 months postinjection, mice were assessed for hippocampal-dependent cognitive function on the radial-arm water maze (RAWM; Alamed et al., 2006). Mice were trained to find an escape platform located at the end of one of six arms. On the first day, mice were trained over four blocks of three trials/block with blocks alternating between visible and hidden platform. For the second day, mice were tested over four training blocks on the hidden platform task. On any given trial, entry to the incorrect arm was recorded as a single error.
The total number of errors committed on each trial (60 s/trial) were averaged across blocks and used for statistical comparisons. To compensate for slight differences in error performance at the outset of training, average error scores for each block were normalized to block one performance for each mouse and used for statistical analyses. The learning curve slope was calculated for each genotype/AAV group across all eight training blocks and used to estimate learning rate. Total errors committed on day 1 versus day 2 of training, across all blocks, were also compared.
In vivo glutamate signaling measures.
High-speed measures of fluctuating l-glutamate levels in intact mice were performed using ceramic-based microelectrode arrays (MEAs) as previously described (Hascup et al., 2007, 2011; Hinzman et al., 2012; Miller et al., 2015). The W4 type MEAs (see Fig. 3A) contain four platinum recording sites consisting of two glutamate-sensitive channels and two self-referencing “sentinel” channels with a tip diameter of ∼100 μm. Glutamate-sensing channels were coated with 1% BSA (Sigma-Aldrich), 0.125% glutaraldehyde (Sigma-Aldrich), and 1% glutamate oxidase (US Biological), which converts free glutamate to α-ketoglutarate and the reporter molecule H2O2. Sentinel channels were coated with BSA/glutaraldehyde. Currents generated by H2O2 production at the glutamate-sensing channels were self-referenced to current activity at the sentinels by subtraction of the signals. The rise time, amplitude, and decay of differential currents were directly proportional to changes in the local glutamate concentration and insensitive to changes in other neurotransmitters and factors (e.g., dopamine and ascorbic acid; data not shown).
Before recording, each MEA was calibrated using the FAST-16 mkIII System (Quanteon) to verify glutamate selectivity, limit of detection, and sensitivity. Mice were anesthetized and placed in a stereotaxic frame and a 3- to 4-mm-diameter craniotomy was performed over both hemispheres. Under continuous inhalation isoflurane (2%) anesthesia, MEAs were lowered into the CA1 region of the hippocampus and a miniature Ag/AgCl reference electrode was placed into the frontal cortex contralateral to the glutamate MEA. Body temperature was maintained at 37°C throughout recording using a water pad connected to a circulating water bath. Final MEA placement coordinates were as follows: −2.3 mm anteroposterior and ±1.7 mm mediolateral relative to bregma, and −1.5 mm dorsoventral relative to dura. Once MEAs were in place, a stable 20–30 min baseline was collected at a final recording display rate of 4 Hz. Basal glutamate levels were calculated and averaged during the last 10 min of the baseline. Spontaneous glutamate spikes were then recorded over an additional 5 min window. Transients recorded at glutamate-sensing sites were subtracted from current activity at the sentinel sites. Maximal amplitude for each transient (in micrometers) was calculated by taking the difference between the transient peak and the baseline glutamate level immediately before the transient. After glutamate recording, brain tissues were collected and cresyl violet staining was used to confirm the location of the MEA for each mouse.
Data acquisition was controlled by the Fast Analytical Sensing Technology (FAST-16) mkIII system (Quanteon) consisting of a control box, headstage, and an analog-to-digital board (National Instruments) and FAST mkIII Windows-based software. Glutamate signaling parameters, including rise and decay times (e.g., T50, T80, and T100 parameters), amplitudes, and frequencies of spontaneous glutamate spikes (see Fig. 4E,H) were analyzed off-line using MATLAB-based FAST analysis software.
Soluble Aβ peptide measures.
Methods for quantifying soluble Aβ(1–42) peptide levels using ELISA were nearly identical to those used in our previous work (McGowan et al., 2005; Murphy et al., 2007; Furman et al., 2012). Tissue was homogenized in ice-cold PBS containing protease and phosphatase inhibitor cocktails and calpain I and II inhibitors (Calbiochem) and then centrifuged at 20,800 × g for 30 min at 4°C. The pellet was extracted by sonication in 2% SDS and spun again at 20,800 × g for 30 min. The supernatant was collected and diluted in antigen capture (AC) buffer that contained 20 mm Na3PO4, 0.4% Block Ace (AbD Serotec), 0.05% NaN3, 2 mm EDTA, 0.4 m NaCl, 0.2% BSA, and 0.05% CHAPS, pH 7. Immulon 4HBX plates were coated with 2.1.3 (end specific for Aβ(1–42)) capture antibody (0.5 μg/well) and blocked with Synblock (AbD Serotec), as per the instructions of the manufacturer. Synthetic human Aβ(1-–42) was diluted in AC buffer and used to construct a standard curve. Protein standards and sample extracts were loaded at least in duplicate, and antigen was detected with 4G8 (Aβ(17–24); Covance) biotinylated antibody. Reactions were developed with 3,3′,5,5′-tetramethylbenzidine reagent, stopped with 6% o-phosphoric acid, and read at 450 nm using a multiwell plate reader. Aβ levels were calculated relative to the standard curve.
Glutamate transport currents in primary astrocytes.
Primary astrocyte cultures were prepared from P7 Sprague Dawley rat pups. Cerebral cortices were collected and washed in HBSS then trypsinized and triturated. Isolated cells were washed and seeded in culture flasks in MEM completed with NaHCO3, l-glutamine, 1% antibiotics/antimycotics, and 10% fetal bovine serum. These cultures were grown for 10–12 d and then trypsinized and plated on plastic inserts within 35 mm culture dishes until electrophysiological recordings. Approximately 48 h before electrophysiological recording, cultures were infected with adenovirus vectors [100 multiplicity of infection (MOI)] expressing LacZ-IRES-GFP [control (CT)], ΔCN-IRES-DsRed2, and VIVIT-EGFP, as described previously (Sama et al., 2008).
Astrocyte-containing inserts were washed once in recording solution and then transferred to a Siskiyou recording chamber and perfused (3–5 ml/min) with additional recording solution containing the following (in mm): 150 NaCl, 5 KCl, 2 MgCl2, 10 HEPES, 2 CaCl2, and 10 d-glucose, pH. 7.4). Whole-cell astrocyte patch clamp was performed as previously described (Dallas et al., 2007). Briefly, high-resistance membrane seals (>1 GΩ) on individual astrocytes were made with fire-polished glass pipettes (∼4–5 MΩ), filled with the following solution (in mm): 140 KSCN, 5 EGTA, 1 MgCl2, 0.5 CaCl2, 10 HEPES, 3 MgATP, and 0.3 NaGTP, pH 7.25). The whole-cell recording configuration was obtained with gentle suction, and the astrocyte membrane potential was held at −70 mV. To induce excitatory amino acid transporter (EAAT)-dependent inward currents, we applied 10 μm l-glutamate to the perfusion media. To confirm that inward currents were mediated by EAATs, some astrocyte-containing inserts were perfused with the glutamate transport inhibitor TBOA (100 μm; Tocris Bioscience) 15 min before and during perfusion with glutamate. Data acquisition was controlled using a Multiclamp 700B amplifier, Digidata 1332a, and pClamp software (Molecular Devices; RRID: SCR_011323). All currents were filtered at 2 kH and digitized at 10 kHz.
Acute brain slice preparation.
Brain slices were prepared as described in our previously published work (Mathis et al., 2011; Bachstetter et al., 2012; Furman et al., 2012). Mice were deeply anesthetized with CO2 and decapitated. Brains were removed and stored briefly in Ca2+-free, ice-cold, oxygenated (95% O2, 5% CO2) artificial CSF (aCSF) containing the following (in mm): 124 NaCl, 2 KCl, 1.25 KH2PO4, 2 MgSO4, 26 NaHCO3, and 10 dextrose, pH 7.4. Four hundred-micrometer-thick sections from one hemisphere, chosen at random, were cut on a vibratome (Leica). Slices were then quickly transferred to netting in a custom Plexiglas holding chamber and maintained in CaCl2-containing (2 mm) aCSF at an interface with warm (32°C), humidified air. Slices were permitted to equilibrate for at least 1.5 h before beginning electrophysiological analysis. These slices were used for whole-cell patch-clamp and synaptic strength analyses.
Spontaneous EPSC measures in brain slices.
Slices were transferred to an RC-27 recording chamber (Warner Instruments) and continuously perfused with aCSF (2 ml/min) heated to 32°C and saturated with 95% O2/5%CO2. Whole-cell patch-clamp recordings were obtained from individual CA1 pyramidal neurons visualized under infrared microscopy using a Nikon E600 microscope. The patch pipette solution contained the following (in mm): 120 CH3CsO3S, 10 CsCl, 5 NaCl, 10 HEPES, 0.5 EGTA, 5 TEA-Cl, 4 Mg-ATP, and 0.3 GTP, pH 7.35 adjusted with CsOH, osmolarity 290 mOsm. The pipette solution also contained QX-314 (1 mm) to block voltage-gated Na+ channel currents, as described previously (Norris et al., 2006; Sama et al., 2008). The average pipette tip resistance was 4.66 ± 1.0 MΩ and did not differ across groups. Spontaneous AMPA receptor-mediated EPSCs were recorded for 3 min at a −80 mV membrane potential. Data acquisition was performed using a Multiclamp 700B amplifier, Digidata 1332a, and pClamp software (Molecular Devices; RRID: SCR_011323). All currents were filtered at 2 kHz and digitized at 10 kHz. Spontaneous EPSC events were detected and analyzed off-line using Minianalysis software (Synaptosoft).
Population synaptic strength measures.
For analysis of hippocampal synaptic strength, slices were transferred to a Kerr Tissue Recording system (Kerr Scientific Instruments) and submerged in warmed (∼32°C) oxygenated aCSF containing 2 mm CaCl2 and 2 mm MgSO4. Schaffer collaterals were activated with a bipolar stainless steel electrode located in stratum radiatum. Stimulus intensity was controlled by a constant current stimulus isolation unit (World Precision Instruments), and stimulus timing was controlled by LabChart 8 software (ADInstruments; RRID: SCR_001620). Field potentials were recorded in CA1 stratum radiatum using a Ag/AgCl wire located ∼1–2 mm from the stimulating electrode. Field potentials were amplified 100× and digitized at 10 kHz using the Kerr Tissue Recording System amplifier and a 4/35 PowerLab analog-to-digital converter (ADInstruments). To assess basal synaptic strength, 100 μs stimulus pulses were given at 12 intensity levels (range, 25–500 μA) at a rate of 0.1 Hz. Five field potentials at each level were averaged, and measurements of fiber volley (FV) amplitude (in millivolts) and EPSP slope (millivolts per millisecond) were performed off-line using LabChart 8 software. FV amplitudes were plotted across stimulation intensity levels to generate FV curves. Synaptic strength curves were constructed by plotting EPSP slope values against FV amplitudes for each stimulus level. Curves were fit with a three parameter sigmoidal equation using GraphPad Prism (GraphPad Software; RRID: SCR_002798) as described previously (Norris and Scheff, 2009; Norris et al., 2016). Curve parameters included maximum curve amplitude, half-maximal activation, and curve slope. The maximal synaptic strength for each slice was also estimated by taking the maximal EPSP slope amplitude during the input/output curve and dividing by the corresponding FV amplitude. To estimate population spike (PS) threshold, the EPSP slope amplitude at which a PS first appeared in the ascending phase of the field potential was calculated and averaged across five successive trials at the spike threshold stimulation level.
Silent synapse measures.
CA1 neurons were patched, as described above, and minimal stimulation techniques were performed in acute brain slices as previously described (Isaac et al., 1995; Liao et al., 1995; Sametsky et al., 2010). Briefly, the stimulating electrode was positioned in CA1 stratum radiatum ∼100–150 μm away from the patched neuron. The average stimulation intensity was 89.24 ± 36.69 μA, which produced detectable postsynaptic responses that alternated with failures. Inward- and outward-going EPSCs were recorded under minimal stimulation at −80 and +40 mV holding potentials, respectively. Ro-25-6981 (1 μm), a specific NR2B antagonist, was applied for some cells to confirm that outward-going EPSCs were partially dependent on NMDA receptors. Minimally evoked EPSCs were filtered at 2 kH and digitized at 10 kHz using a Multiclamp 700B amplifier and Digidata 1320 digitizer (Molecular Devices). Stimulus timing and acquisition was controlled by Clampfit 9.2 software (Molecular Devices). Synaptic transmission failure rates were measured at −80 mV and +40 mV holding potentials for each cell. A reduction in the failure rate at +40 versus −80 mV within the same cell was considered as an indication of functionally silent synapses (Isaac et al., 1995; Liao et al., 1995; Sametsky et al., 2010).
Isolation of NMDAR-dependent field potentials.
The CA3 region was dissected away with a scalpel blade, and slices were transferred to a Kerr Recording system and perfused (1–2 ml/min) with oxygenated prewarmed (∼30°C) aCSF as described above. Field potentials were recorded in CA1 stratum radiatum in response to electrical stimulation of CA3 Schaffer collaterals at a rate of 0.033 Hz. After a stable baseline was obtained (∼20 min), the AMPAR antagonist CNQX (10 μm) and the GABAA receptor antagonist picrotoxin (50 μm) were added to the perfusion media to isolate NMDAR-dependent EPSPs. The NR2B-dependent component was further isolated by adding 3-phenoxy-3-phenylpropan-1-amine (PPPA; 0.5 μm), while the NR2A component was isolated using Ro-25-6981 (1 μm). Ten consecutive EPSPs were collected at 20–30 min post-drug washin and averaged, and then compared with EPSPs averaged immediately before drug washin. Field potentials were amplified 100× and digitized at 10 kHz using the Kerr Tissue Recording System amplifier and a 4/35 PowerLab analog-to-digital converter (ADInstruments). Stimulus timing and data acquisition were controlled by LabChart 8 Software.
Drugs.
CNQX, picrotoxin, and QX-314 were obtained from Sigma-Aldrich. Threo-β-benzyloxyaspartate (TBOA), Ro-25-6981, and PPPA were obtained from Tocris Bioscience.
Statistical analyses.
As outlined in the Results section, genotype and AAV treatment effects on biobehavioral markers were determined using a variety of parametric and nonparametric tests, including t tests, ANOVA, repeated-measures ANOVA (rmANOVA), Fisher's exact test, and Kolmogorov–Smirnov test. For parametric tests, post hoc comparisons were performed using Fisher's LSD. All statistical comparisons were made with GraphPad Prism version 7 software (RRID: SCR_002798), except for three-way repeated-measures ANOVAs, which were performed with StatView version 5 software. Statistical significance for all comparisons was set at p ≤ 0.05.
Results
CN/NFAT4 expression/activity in 5xFAD mice is associated with astrocyte activation
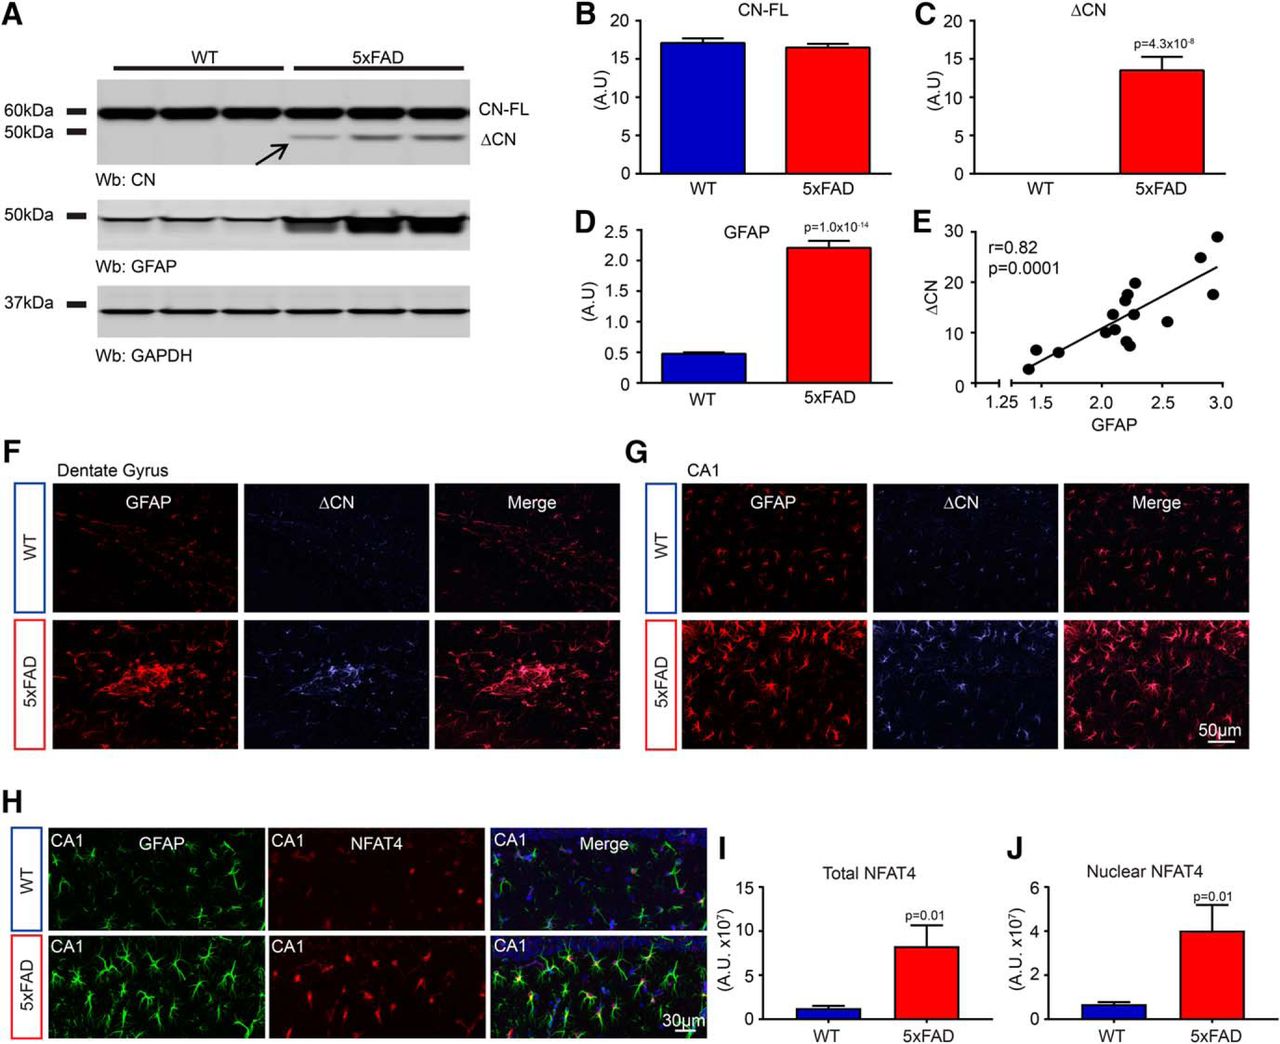
The CN/NFAT pathway becomes excessively activated in astrocytes in multiple forms of injury and disease. Figure 1A–C shows hippocampal protein levels for full-length CN (∼60 kDa) and a high-activity CN proteolytic fragment (ΔCN, ∼48 kDa) in 8-month-old WT (n = 15) and 5xFAD (n = 16) mice. Although levels for full-length CN did not differ significantly between genotype groups (Fig. 1B), ΔCN appeared almost exclusively in 5xFAD mice (Fig. 1C; t(29) = 7.35, p = 4.3 × 10⁻⁸) characterized by significantly elevated GFAP expression (Fig. 1D; t(29) = 14.4, p = 1.0 × 10⁻¹⁴), indicative of astrocyte activation. Within the 5xFAD group, ΔCN levels increased directly in proportion to GFAP levels (Fig. 1E; r = 0.82, p = 0.0001). A similar ΔCN fragment has been previously linked to neuronal damage associated with excitotoxicity (Wu et al., 2004), acute injury (Shioda et al., 2006; Furman et al., 2016), and Aβ pathology (Wu et al., 2010; Mohmmad Abdul et al., 2011). The direct association of ΔCN with activated astrocytes was further demonstrated using confocal microscopy and a custom-made antibody that detects ΔCN, but not full-length CN (Pleiss et al., 2016). As shown in Figure 1, F and G, ΔCN labeling was associated with numerous GFAP-positive astrocytes throughout the hippocampus of 5xFAD mice but did not appear at high levels in the neuronal cell layers. Similar to ΔCN, the NFAT4 isoform, previously identified in activated astrocytes of acute injury models (Serrano-Pérez et al., 2011; Furman et al., 2016), was also colocalized to GFAP-positive astrocytes in 5xFAD mice (Fig. 1H). NFAT4 was found at elevated levels in astrocytes (t(14) = 2.94, p = 0.01) and astrocyte nuclei (t(14) = 2.84, p = 0.01) of 5xFAD mice (n = 8), relative to WT mice (n = 8), which is consistent with increased NFAT activation (Fig. 1I,J). Together, these results confirm the presence of aberrant CN/NFAT signaling in activated astrocytes of the 5xFAD mouse model.

Astrocyte activation in 5xFAD mice is associated with increased CN/NFAT signaling. A, Representative Western blots for CN, GFAP, and GAPDH loading control in three WT and three 5xFAD mice. Full-length CN (CN-FL) is an ∼60 kDa band, and the hyperactive ΔCN fragment falls at ∼48 kDa (arrow). B–D, Mean ± SEM hippocampal protein levels [in arbitrary units (A.U.)] for CN-FL, ΔCN, and GFAP in WT (n = 15) and 5xFAD (n = 16) mice. E, Scatter plot showing the correlation between ΔCN and GFAP levels in 5xFAD mice. F, G, Confocal micrographs showing immunolabeling of GFAP and ΔCN in the dentate gyrus (F) and CA1 (G) of WT and 5xFAD mice. H, Confocal micrographs showing immunolabeling of GFAP and NFAT4 in CA1 of WT and 5xFAD mice. DAPI labeling of cell nuclei is in blue. I, J, Mean ± SEM NFAT4 labeling intensity in astrocytes (I, total) and astrocyte nuclei (J) in WT mice (n = 8) and 5xFAD mice (n = 8). NFAT4 labeling was compared across genotypes using Student's t test.
AAV-Gfa2-VIVIT inhibits NFAT nuclear localization and improves cognition in 5xFAD mice
At 1 to 2 months of age, before 5xFAD mice develop extracellular Aβ deposits (Oakley et al., 2006), mice in both transgene groups received intrahippocampal injections of vehicle or AAV vectors expressing EGFP (control AAV) or the NFAT inhibitor VIVIT (tagged to EGFP). Transgene expression was limited to astrocytes using a human GFAP promoter (Gfa2; Fig. 2A–C), as described previously (Furman et al., 2012, 2016). Similar to our previous work, vehicle-treated and AAV-Gfa2-EGFP-treated mice were statistically comparable on every biomarker investigated (data not shown) and were therefore combined into a single control (CT) group for each transgene group (i.e., WT-CT or 5xFAD-CT). Mice were then examined at 6–8 months post-AAV injection, when Aβ pathology and glial activation are widespread in 5xFAD mice (Oakley et al., 2006).

AAV-Gfa2-VIVIT reduces astrocytic NFAT activation and improves cognition in 5xFAD mice. A, B, Experimental treatments and timeline. Mice received intrahippocampal injections of AAV-Gfa2-EGFP control or AAV-Gfa2-VIVIT-EGFP at 1.5–2 months of age. Behavioral, glutamate signaling, and/or electrophysiology endpoint measures were collected at 6–8 months of age. C, Transverse hippocampal section from an AAV-Gfa2-EGFP-treated mouse at 8 months of age showing extensive EGFP labeling. D, Confocal micrographs of EGFP (green), NFAT4 (red), and DAPI in 5xFAD mice treated with AAV-Gfa2-EGFP or AAV-Gfa2-VIVIT-EGFP. Left panels are 2-D confocal micrographs, and right panels are 3-D reconstructed images of ∼15 μm z-stacks (0.5 μm sections). E, Mean ± SEM NFAT4 activity levels (ratio of nuclear NFAT4 to total NFAT4 labeling) in EGFP-positive astrocytes of 5xFAD mice treated with AAV-Gfa2-EGFP (n = 6) or AAV-Gfa2-VIVIT-EGFP (n = 6). Nuclear NFAT4 levels were compared across AAV treatment groups using Student's t test. F, G, Mean ± SEM error rate (percentage of total errors on block 1) on the 2 d RAWM task in WT mice (F) and 5xFAD mice (G) treated with AAV-Gfa2-EGFP (CT) or AAV-Gfa2-VIVIT-EGFP. Genotype and AAV treatment effects on learning rates were determined with ANOVA and Fisher's LSD test. H, Mean ± SEM total errors committed on days 1 and 2 of the RAWM task. WT-CT group, 28 mice/group; WT-VIVIT group, 15 mice/group; 5xFAD-CT group, 22 mice/group; 5xFAD-VIVIT group, 10 mice/group. Genotype, AAV, and training day effects (along with significant interactions) were determined with a three-way rmANOVA and follow-up one-way rmANOVAs within each experimental group.
To assess the impact of VIVIT on astrocytic NFAT activation, we quantified the nuclear localization of NFAT4 exclusively in individual EGFP-positive astrocytes of 8-month-old 5xFAD mice (EGFP control, n = 6; VIVIT-EGFP, n = 6) using confocal microscopy. Representative three-dimensional reconstructions of NFAT4 labeling in EGFP- and VIVIT-EGFP-positive astrocytes are shown in Figure 2D. NFAT4 present in DAPI-labeled nuclei was significantly reduced by >30% in VIVIT-EGFP-positive astrocytes (Fig. 2E; t(10) = 2.3, p = 0.04), demonstrating VIVIT-mediated inhibition of NFAT4.
Figure 2F–H shows the effects of genotype and AAV on relative learning rates (Figs. 2F,G) and the total number of errors committed (Fig. 2H) on the 2 d version of a radial arm water maze task (WT-CT group, 28 mice/group; WT-VIVIT group, 15 mice/group; 5xFAD-CT group, 22 mice/group; 5xFAD-VIVIT group, 10 mice/group). ANOVA detected a significant genotype × AAV treatment interaction for learning rate (F(1,71) = 5.261, p = 0.02), with post hoc tests showing a reduced learning rate in 5xFAD-CT mice versus WT-CT mice (p = 0.02, Fisher's LSD) and in 5xFAD-CT mice versus 5xFAD-VIVIT mice (p = 0.04, Fisher's LSD). No differences were observed between 5xFAD-VIVIT mice and either WT AAV treatment group. By the last training block on day 2, 5xFAD-VIVIT mice made significantly fewer errors than 5xFAD-CT mice (Fig. 2G; p = 0.03, Student's t test). When the total number of errors was compared across training days using a three-way rmANOVA, a significant genotype by AAV treatment by training day interaction was observed (Fig. 2H; F(1,71) = 6.2, p = 0.02). Within both genotype groups, there was a significant effect of training day, indicating that errors were reduced on day 2 for both genotype groups (WT mice: F(1,41) = 35.28, p < 0.0001; 5xFAD mice: F(1,30) = 20.49, p < 0.001). However, for the 5xFAD group, a significant AAV treatment by training day interaction was also found (F(1,30) = 5.46, p = 0.03). A follow-up rmANOVA in each AAV treatment condition within the 5xFAD group revealed a significant training effect only for 5xFAD-VIVIT mice (F(1,9) = 20.76, p = 0.002). Thus, all groups exhibited significant improvement on day 2 of the RAWM task except for 5xFAD-CT mice. Together, the results demonstrate that blockade of astrocytic CN/NFAT signaling before AD pathology helps stabilize cognitive function in 5xFAD mice.
AAV-Gfa2-VIVIT normalizes spontaneous glutamate transients in 5xFAD mice
Signs of neuronal hyperexcitability and/or excitotoxicity have been reported in AD (Putcha et al., 2011; Bakker et al., 2012) and can occur in conjunction with increasing amyloid pathology in transgenic mice (Palop et al., 2007; Busche et al., 2008; Grienberger et al., 2012; Bomben et al., 2014; Kellner et al., 2014; Šišková et al., 2014; Busche and Konnerth, 2015; Fontana et al., 2017). Though glutamate dysregulation is key to excitotoxic damage, dynamic levels of glutamate have only rarely been directly examined in common AD mouse models. Using ceramic-based, enzyme-coated (i.e., glutamate oxidase) MEAs (Hascup et al., 2007; Miller et al., 2014; Hunsberger et al., 2015; Fig. 3A–C), we measured multiple glutamate signaling parameters in CA1 of anesthetized WT and 5xFAD mice treated with AAV vectors (WT-CT group, 10 mice/group; WT-VIVIT group, 4 mice/group; 5xFAD-CT group, 8 mice/group, 5xFAD-VIVIT group, 5 mice/group). Similar to previous work (Matveeva et al., 2012), basal glutamate levels were highly variable (Fig. 3D) and no significant effects of genotype or AAV were found. Mice also exhibited spontaneously generated glutamate transients (Fig. 3E) that varied in frequency, amplitude, and duration (Fig. 3F–I). The average glutamate transient amplitude did not differ significantly across groups (Fig. 3G), although VIVIT tended to have opposing effects in WT and 5xFAD mice (i.e., transient amplitude was increased in WT mice but was decreased in 5xFAD mice treated with VIVIT).

AAV-Gfa2-VIVIT normalizes spontaneous glutamate transients in 5xFAD mice in vivo. A, B, Self-referencing MEAs were used to measure glutamate transients in CA1 of anesthetized WT and 5xFAD mice treated with AAV-Gfa2-EGFP (CT) or AAV-Gfa2-VIVIT-EGFP. A micrograph of the MEA is shown in A. Glutamate-sensing sites were coated with glutamate oxidase (GluOx). “Sentinel” indicates self-referencing sites (for details, see Materials and Methods). C, Hippocampus of a WT-CT mouse labeled with cresyl violet to confirm MEA localization to CA1 stratum radiatum (red arrowhead). D, Mean ± SEM basal glutamate levels in WT and 5xFAD mice under CT and VIVIT conditions. n.s. = nonsignificant. WT-CT group, 10 mice/group; WT-VIVIT group 4 mice/group; 5xFAD-CT group, 8 mice/group; 5xFAD-VIVIT group, 5 mice/group. E, Representative traces of spontaneous glutamate transients in WT and 5xFAD mice. Inset is a higher-magnification view of a single transient. F, G, Mean ± SEM frequency (F) and amplitude (G) of glutamate transients across treatment groups. H, Parameters for measuring glutamate transient duration. Representative transients in 5xFAD-CT and 5xFAD-VIVIT mice are shown. Transients were matched for maximum amplitude then were fit with nonlinear Lorentzian functions (dotted line). Relative glutamate levels are indicated along the descending limb when transients fell to 50% (T50), 20% (T80), and 0% (T100) of the maximum amplitude. I, Transient duration expressed as the time at which T50, T80, and T100 thresholds were reached (mean ± SEM; see H) in each group. Time is relative to the peak glutamate transient amplitude. Genotype and AAV effects in D, F, G, and I were determined with ANOVA and Fisher's LSD test.
In contrast to amplitude, both the frequency and duration of glutamate transients differed significantly depending on genotype and AAV treatment (Fig. 3F–I). For transient frequency, ANOVA detected a significant genotype by AAV treatment interaction (Fig. 3F; F(1,23) = 3.92, p = 0.05), which was characterized by a greater response rate in 5xFAD-CT mice relative to WT-CT mice (p = 0.02, Fisher's LSD test) and to 5xFAD-VIVIT mice (p = 0.02, Fisher's LSD). No differences were found among WT-CT, WT-VIVIT, and 5xFAD-VIVIT groups. To calculate transient duration (measured in seconds), glutamate levels were calculated along the descending phase of the transient at three different points: T50 (50% decay from peak amplitude), T80 (80% decay), and T100 (100% decay; Fig. 3H). Decay times were then compared across genotype and AAV treatments using a three-way rmANOVA, which detected a significant AAV treatment by time point interaction (Fig. 3I; F(2,20) = 3.71, p = 0.03). A two-way rmANOVA performed within each genotype group revealed a similar AAV by time point interaction within 5xFAD mice (F(2,10) = 3.78, p = 0.04) but not within the WT group. Post hoc tests showed significantly longer decay times for 5xFAD-CT mice relative to both WT-CT mice (T100; p = 0.02, Fisher's LSD) and 5xFAD-VIVIT mice (T100; p = 0.02, Fisher's LSD). The results demonstrate an increase in the frequency and duration of spontaneous glutamate transients in 5xFAD mice due, in part, to elevated astrocytic CN/NFAT activity.
AAV-Gfa2-VIVIT reduces Aβ pathology and increases GLT-1 expression
Previous work has shown that the levels and/or function of EAAT2 (rodent analog, GLT-1), the most abundantly expressed glutamate transporter in hippocampal astrocytes (Maragakis and Rothstein, 2006) are reduced in conjunction with Aβ pathology and/or glial activation (Masliah et al., 1996; Abdul et al., 2009; Simpson et al., 2010; Tian et al., 2010; Scimemi et al., 2013; Hefendehl et al., 2016). AAV-mediated delivery of VIVIT to 5xFAD mice reduced both Aβ plaque load in CA1 (Fig. 4A,B; 5xFAD-CT group, 6 mice/group; 5xFAD-VIVIT group, 7 mice/group; t(10) = 2.41, p = 0.04) and soluble Aβ42 peptide levels in whole hippocampus (Fig. 4C; 5xFAD-CT group, 4 mice/group, 5xFAD-VIVIT, 5 mice/group; t(7) = 3.1, p = 0.02). Furthermore, GFAP labeling around Aβ deposits was significantly reduced in VIVIT-treated 5xFAD mice (Fig. 4A,D; t(10) = 2.28, p = 0.04). GLT-1 showed diffuse labeling across the hippocampus (Fig. 4E,F) as reported in other studies (Hefendehl et al., 2016). VIVIT increased GLT-1 labeling in 5xFAD mice (Fig. 4E,G; 5xFAD-CT group, 6 mice/group; 5xFAD-VIVIT group, 6 mice/group; t(10) = 2.29, p = 0.04), especially around Aβ deposits (Fig. 4F,H; t(10) = 5.8, p = 0.0002), and was associated with an overall increase in hippocampal GLT-1 protein (Fig. 4I,J; 5xFAD-CT group, 3 mice/group; 5xFAD-VIVIT group, 3 mice/group; t(4) = 5.1, p = 0.007).
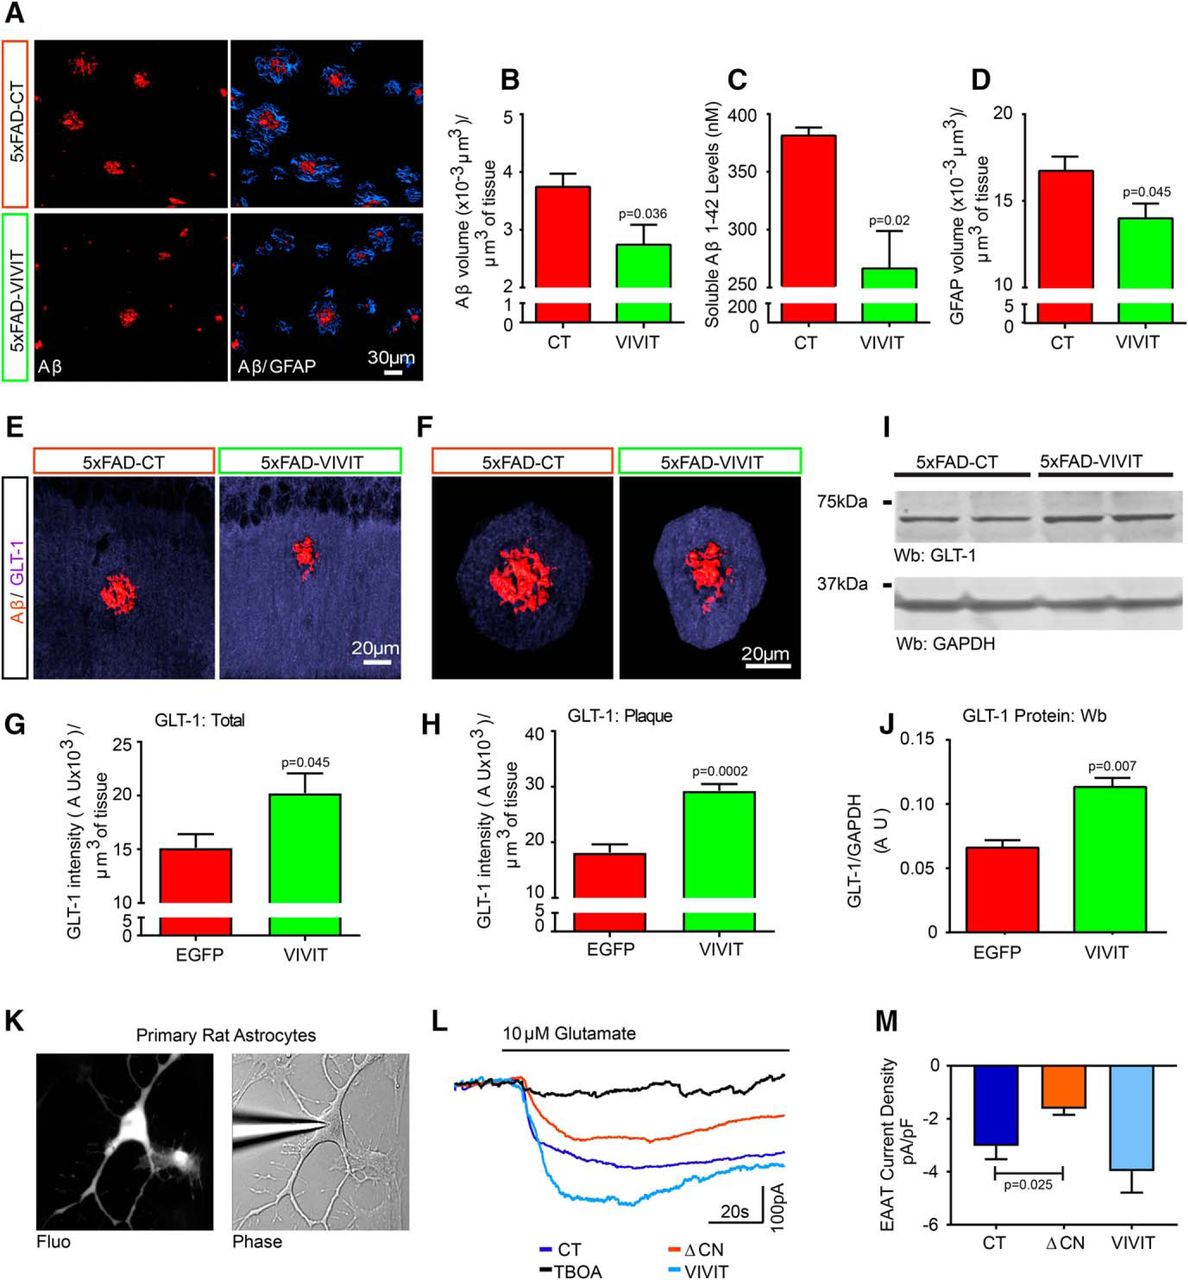
AAV-Gfa2-VIVIT-EGFP reduces Aβ levels and increases GLT-1 labeling in 5xFAD mice. A, Confocal micrographs of CA1 in CT- and VIVIT-treated 5xFAD mice showing immunolabeling of Aβ (red) and GFAP (blue). B–D, Mean ± SEM Aβ plaque load (B), Aβ peptide levels (C), and GFAP labeling (volume-μm3; D) in CA1 of AAV-treated 5xFAD mice. 5xFAD-CT group, 6 mice/group; 5xFAD-VIVIT group, 7 mice/group. E, F, 3-D reconstructions of GLT-1 labeling (blue) in hippocampal area CA1. Aβ deposits are shown in red at low (E) and high (F) magnification. G, H, Mean ± SEM GLT-1 labeling intensity [arbitrary units (A.U.)/tissue volume-μm3) across total hippocampus (G) and in the immediate vicinity (H) of Aβ deposits of AAV-treated 5xFAD mice. I, J, Representative Western blots (I) and mean ± SEM hippocampal protein levels (J, in A.U.) for GLT-1 in CT mice and VIVIT-treated 5xFAD mice. (n = 3/group). K, Fluorescent (Fluo) and phase contrast micrographs of a whole-cell patch micropipette sealed to a primary astrocyte infected with adenovirus expressing ΔCN-DsRed2. L, Representative inward currents recorded in primary astrocytes (voltage clamped to −70 mV) during extracellular perfusion with 10 μm l-glutamate. Treatment conditions: CT (Ad-CMV-LacZ-GFP), ΔCN (Ad-CMV-ΔCN-DsRed); VIVIT (Ad-CMV-VIVIT-EGFP); and TBOA (glutamate transporter inhibitor). M, Mean ± SEM glutamate-mediated inward current density (pA/pF) in astrocytes treated with control adenovirus (Ad-LacZ) or with adenovirus expressing ΔCN and VIVIT. CT group, 8 cells/group; ΔCN group, 9 cells/group; VIVIT group, 4 cells/group. AAV effects in B–D and G–J were determined with Student's t test. Adenovirus treatment effects in M were determined with ANOVA and Fisher's LSD test.
To determine whether hyperactive astrocytic CN/NFAT signaling directly affects glutamate uptake, we used whole-cell voltage clamp (Fig. 4K) to measure glutamate transport currents in primary rat astrocytes expressing an activated CN proteolytic fragment (ΔCN), similar to that found in 5xFAD astrocytes (Fig. 1C,F,G). Astrocytes were infected with control adenovirus (Ad-LacZ-GFP, n = 8) or adenoviruses expressing ΔCN or VIVIT (Ad-CMV-ΔCN-Ds-Red2, n = 9; Ad-CMV-VIVIT-EGFP, n = 4) at an MOI of 100, as described previously (Sama et al., 2008). Perfusion of primary astrocytes with l-glutamate (10 μm) resulted in an inward current that was largely mediated by TBOA-sensitive glutamate transporters (Fig. 4L). ANOVA detected a significant effect of virus treatment (F(2,18) = 6.25, p = 0.009). Inward currents were significantly reduced in astrocytes expressing ΔCN (p = 0.03, Fisher's LSD vs CT), but not VIVIT (Fig. 4M). The results suggest that glutamate dysregulation in 5xFAD mice is attributable to the CN/NFAT-mediated downregulation of GLT-1-dependent glutamate uptake in astrocytes.
AAV-Gfa2-VIVIT normalizes spontaneous synaptic activity in 5xFAD mice
We next determined whether astrocytic CN/NFATs were involved in hyperexcitability at the synaptic level. Brain slices were prepared from AAV-treated WT and 5xFAD mice, and spontaneous EPSCs were recorded across a 3 min period from individual CA1 neurons held at −80 mV using whole-cell voltage clamp (Fig. 5A,B; WT-CT group, 39 cells from 16 mice; WT-VIVIT group, 28 cells from 10 mice; 5xFAD-CT group, 33 cells from 11 mice; 5xFAD-VIVIT group, 14 cells from 7 mice). Under these conditions, neurons exhibited highly variable activity rates (Fig. 5B), which could be sorted into four broad categories: low (0–499 events), low-normal (500–999 events), high-normal (1000–1499 events), and high (>1500 events). As shown in Figure 5C, a significantly greater proportion of cells in the 5xFAD-CT group exhibited normal-high to high activity rates compared with WT-CT mice (p = 0.0007, Fisher's exact test) and 5xFAD mice (p = 0.004, Fisher's exact test). Amplitude histograms (Fig. 5D) showed that the majority of EPSCs occurred within the 10–20 μA range across all groups, suggesting that miniature EPSC amplitudes were unaffected by genotype or virus treatment. However, relative to both WT groups, 5xFAD-CT mice exhibited a higher peak and a broader distribution, which is indicative of overall greater activity. Similarly, the cumulative EPSC frequency distribution (Fig. 5E) for 5xFAD-CT mice exhibited a significant rightward shift compared with WT-CT mice (p < 1 × 10⁻¹⁵, Kolmogorov–Smirnov test) and 5xFAD-VIVIT mice (p < 1 × 10⁻¹⁵, Kolmogorov–Smirnov test). When the total number of EPSCs was counted (regardless of amplitude), ANOVA detected a significant AAV treatment effect (Fig. 5F; F(1,36) = 7.11, p = 0.02). Post hoc tests showed a significantly higher activity rate in 5xFAD-CT mice relative to WT-CT mice (p = 0.05, Fisher's LSD test) and 5xFAD-VIVIT mice (p = 0.03, Fisher's LSD test). EPSC distributions (Fig. 5D) and frequency (Fig. 5E,F) in 5xFAD-VIVIT mice were statistically comparable to those of WT-CT mice. Together, the results suggest that astrocytic CN/NFAT helps to drive hyperactive spontaneous synaptic activity associated with AD-like pathology.

AAV-Gfa2-VIVIT-EGFP quells synaptic hyperexcitability in 5xFAD mice. A, Schematic illustration showing whole-cell voltage-clamp recordings from individual CA1 neurons in ex vivo brain slices. B, Representative traces showing spontaneous EPSCs recorded from CA1 neurons held at −80 mV. Traces are from cells that showed low, normal, and high (hyperactive) levels of spontaneous synaptic activity. C, Pie charts of the percentage of cells in each treatment group sorted by activity levels (i.e., number of EPSCs) during the 3 min recording window: low (0–499, dark green), low-normal (500–999, light green); high-normal (1000–1499, yellow), and high (>1500, red). The proportion of cells at each activity level was compared across genotype/AAV groups using Fisher's exact test. D, Mean EPSC amplitude histograms from WT (left) and 5xFAD mice (right) treated with AAV-Gfa2-EGFP (CT) or AAV-Gfa2-VIVIT-EGFP (VIVIT). E, Mean cumulative frequency distributions for WT mice (left) and 5xFAD mice (right) under CT and VIVIT treatment conditions. Significant shifts in the frequency distributions between 5xFAD-CT vs WT-CT cells (*) and 5xFAD-VIVIT vs 5xFAD-CT cells (#) were determined using the Kolmogorov–Smirnov test. F, Mean ± SEM EPSC frequency (events/min) in AAV-treated WT and 5xFAD mice. WT-CT group, 39 cells from 16 mice; WT-VIVIT group, 28 cells from 10 mice; 5xFAD-CT group, 33 cells from 11 mice; 5xFAD-VIVIT group, 14 cells from 7 mice. Genotype and AAV effects in F were determined with ANOVA and Fisher's LSD test.
AAV-Gfa2-VIVIT prevents dendritic degeneration and improves basal synaptic strength
CA1 neuronal loss and dendritic abnormalities commonly arise with AD (Spires and Hyman, 2004; Padurariu et al., 2012), similar to what is observed following glutamate dysregulation associated with excitotoxic insults (Andrew and MacVicar, 1994; Hasbani et al., 1998; Greenwood et al., 2007). To determine whether changes in the number and/or structural integrity of hippocampal neurons is altered in 5xFAD mice, we counted NeuN-positive CA1 pyramidal neurons (Fig. 6A,B; WT-CT group, 9 mice/group, WT-VIVIT group, 7 mice/group; 5xFAD-CT group, 11 mice/group; 5xFAD-VIVIT group, 6 mice/group) and investigated the morphology of proximal apical dendrites in postmortem tissue from the same mice (n = 6 mice/group) used in MEA studies (Fig. 3). Although no genotype- or AAV-dependent differences were observed for the number of CA1 neurons (Fig. 6B), there were differences in dendritic morphology (detected via MAP2b-labeling; Fig. 6C,D). The average dendrite diameter showed considerable diversity within each group (range, ∼1 to >3 μm) but did not differ across groups (data not shown). However, dendrites from the 5xFAD-CT group were less uniform in diameter, showing signs of swelling and atrophy (Fig. 6C, yellow arrows and arrowheads). When apical dendrites across CA1 were sorted based on diameter, Gaussian distribution parameters differed significantly across groups (Fig. 6D). The distribution for the 5xFAD-CT group (Fig. 6D) was broader, with a smaller peak, compared with that of both WT-CT mice (p = 3 × 10⁻¹³, Kolmogorov–Smirnov test) and 5xFAD-VIVIT mice (p = 7.8 × 10⁻¹⁰, Kolmogorov–Smirnov test), which is indicative of a greater number of very wide (>3 μm) and very narrow (<1.2 μm) dendrites, consistent with dendrite swelling and atrophy. In contrast, the distribution of dendrite diameters in the 5xFAD-VIVIT group was statistically comparable to that in the WT groups.

AAV-Gfa2-VIVIT-EGFP reduces dendritic degeneration and population synaptic deficits in 5xFAD mice. A, Photomicrographs showing NeuN immunolabeling in hippocampus of a WT mouse. Left panel is a low-power micrograph of the CA1 pyramidal cell layer. The right panel shows a high-power micrograph of CA1. B, Mean ± SEM CA1 neuron count in AAV-treated WT and 5xFAD mice (CT and VIVIT). n.s., Nonsignificant. WT-CT group, 9 mice/group; WT-VIVIT group, 7 mice/group; 5xFAD-CT group, 11 mice/group; 5xFAD-VIVIT group, 6 mice/group. C, High-power fluorescent photomicrographs of MAP2 immunolabeling in CA1 pyramidal neurons and apical dendrites from AAV-treated WT and 5xFAD mice. In the 5xFAD-CT panel, dendrites are clearly swollen (yellow arrow) or atrophied (yellow arrowheads). D, Mean Gaussian distributions of dendrite diameters in AAV-treated WT mice and 5xFAD mice (n = 6/group). Significant shifts in the dendrite diameter distributions between the 5xFAD-CT and WT-CT groups (*) and 5xFAD-VIVIT vs 5xFAD-CT groups (#) were determined using the Kolmogorov–Smirnov test. E, F, Synaptic strength curves in WT mice (E) and 5xFAD mice (F) shown as the mean ± SEM field EPSP slope amplitudes (vertical error bars) plotted against the mean ± SEM FV amplitudes (horizontal error bars) across 12 stimulus intensities. Insets, Representative field potentials recorded from each treatment condition. Within each genotype, waveforms are matched to similar FV amplitudes. Calibration: 0.5 mV, 5 ms. G, Mean ± SEM maximal EPSP to FV ratio in AAV-treated WT mice and 5xFAD mice. (H) Mean ± SEM PS threshold in AAV-treated WT and 5xFAD mice. The PS threshold is defined as the EPSP slope measured during the first appearance of a PS in the ascending limb of the field potential. Inset, Representative field potential from a 5xFAD-CT mouse. Arrow points to an upward-going PS in the ascending limb of the field potential. Calibration: 0.5 mV, 5 ms. For E–H: WT-CT group, 10 mice/group; WT-VIVIT group, 9 mice/group; 5xFAD-CT group, 11 mice/group; 5xFAD-VIVIT group, 8 mice/group. For B and E–H, genotype and AAV treatment effects were determined with ANOVA and Fisher's LSD test.
Many disease models that exhibit neuronal/dendritic degeneration also exhibit deficits in evoked synaptic transmission. Previously, we found that AAV-Gfa2-VIVIT protected against synaptic deficits in a double-transgenic (APP/PS1) mouse model of AD (Furman et al., 2012). To determine whether VIVIT is associated with similar synaptoprotection in the more aggressive 5xFAD model of AD, we investigated basal CA3–CA1 synaptic strength curves in acutely prepared slices from AAV-treated WT and 5xFAD mice (Fig. 6E,F; WT-CT group, 10 mice/group; WT-VIVIT group, 9 mice/group; 5xFAD-CT group, 11 mice/group 5xFAD-VIVIT group, 8 mice/group). Curves were calculated by plotting the field EPSP versus the corresponding presynaptic FV amplitude across a series of increasing stimulus intensities. A three-parameter sigmoidal equation was used to fit FV curves (data not shown) and synaptic strength curves (Fig. 6E,F) for each slice.
In WT mice, VIVIT treatment was associated with a small downward shift in the synaptic strength curve (Fig. 6E), which was attributable to a modest reduction in the CA3 FV amplitude (data not shown). However, the maximal EPSP/FV ratio in WT-VIVIT-treated mice was statistically comparable to that in WT-CT mice, suggesting that VIVIT effects on basal synaptic strength in WT mice were minimal (Fig. 6G). While FV amplitudes were similar in WT-CT and 5xFAD mice, 5xFAD-CT mice exhibited a marked downward shift in the synaptic strength curve amplitude (Fig. 6F). For the EPSP/FV ratio, ANOVA detected a significant interaction between genotype and AAV treatment (F(1,39) = 6.8, p = 0.001). Post hoc tests revealed a significant (>60%) reduction in 5xFAD-CT mice relative to WT-CT mice (p = 0.0002, Fisher's LSD test). In contrast, the EPSP/FV ratio for 5xFAD-VIVIT mice did not differ from that for WT-CT mice but was significantly elevated by >90% compared with that for 5xFAD-CT mice (p = 0.007, Fisher's LSD test). A significant transgene by AAV treatment interaction was also observed for the evoked PS threshold, which is a measure of overall neuronal excitability (Fig. 6H; F(1,39) = 9.9, p = 0.003). In most slices, an upward-going PS (indicative of a synchronous population action potential in CA1) appeared in the ascending limb of the field potential with increasing stimulus intensities (Fig. 6H, inset, arrow). Relative to WT-CT mice, the PS for 5xFAD-CT mice occurred in response to significantly lower levels of postsynaptic activation (i.e., smaller EPSP slopes; p = 1.1 × 10⁻⁵, Fisher's LSD test), suggesting that CA1 neurons from 5xFAD-CT mice are hyperexcitable, even though evoked synaptic responses are reduced. Although the PS threshold was also reduced in 5xFAD-VIVIT mice relative to WT-CT mice (Fig. 6H; p = 0.02, Fisher's LSD), VIVIT treatment resulted in a significant elevation in the PS threshold relative to the 5xFAD-CT control group (p = 0.04, Fisher's LSD test), indicative of reduced excitability. Together, the results suggest that inhibition of astrocytic CN/NFAT signaling helps protect against neurite abnormalities and basal synaptic strength deficits in 5xFAD mice.
AAV-Gfa2-VIVIT normalizes NMDAR/AMPAR activity in CA1 pyramidal neurons in 5xFAD mice, but does not prevent synapse silencing
Reductions in the CA1 field potential in 5xFAD mice may be attributable to functional deficits at individual synapses and/or to the silencing of individual synapses. To test these possibilities, EPSC amplitudes and synaptic failure rates were investigated using a minimal stimulation paradigm and whole-cell voltage clamp (see Materials and Methods; Isaac et al., 1995; Liao et al., 1995). Inward-going EPSCs were orthodromically elicited from CA1 pyramidal neurons held at −80 mV (i.e., 120 stimulus pulses, five second interpulse interval). Stimulation intensity was lowered until transmission failures were observed on at least 50% of stimulus trials. Because of the voltage-dependent Mg2+ block, NMDA receptor (NMDAR) currents are negligible at −80 mV, resulting in a purely AMPA-driven EPSC. The membrane potential was then stepped to +40 mV and outward-going EPSCs, consisting of both AMPA and NMDAR-mediated currents (due to relief of the voltage-dependent Mg2+ block), were elicited across 120 additional trials at the same stimulus intensity.
Figure 7A shows a representative time plot of the minimal stimulation paradigm. For some cells, the NMDAR antagonist, Ro-25-6981, or APV, was washed in ∼10–20 min after stepping to +40 mV to confirm that outward going-EPSCs were dependent on functional NMDARs. No effects of genotype or AAV were observed for the average amplitude of evoked inward-going EPSCs recorded at −80 mV (Fig. 7B,C; WT-CT group, 16 cells from 15 mice; WT-VIVIT group, 10 cells from 9 mice; 5xFAD-CT group, 16 cells from 11 mice; 5xFAD-VIVIT group, 9 cells from 7 mice). This result suggests that unitary AMPAR currents are intact at surviving synapses of 5xFAD mice and insensitive to astrocytic CN/NFAT activity. In contrast, ANOVA detected a significant genotype by AAV treatment interaction for outward-going EPSC amplitudes recorded at +40 mV (Fig. 7B,C; F(1,47) = 4.08, p = 0.04). Post hoc tests showed that 5xFAD-CT exhibited elevated outward currents relative WT-CTs (p = 0.005, Fisher's LSD test) and 5xFAD-VIVIT mice (p = 0.04, Fisher's LSD test) consistent with a proportional increase in NMDAR function. The 5xFAD-VIVIT group was statistically comparable to both WT groups.

AAV-Gfa2-VIVIT-EGFP normalizes NMDAR activation in 5xFAD mice but does not affect the appearance of functionally silent synapses. A, Time plot of EPSCs recorded from a CA1 pyramidal neuron in response to minimal electrical stimulation of CA3 Schaffer collaterals. EPSCs were downward going when the cell was voltage clamped to −80 mV but were outward-going when the holding potential was switched to +40 mV. Application of the NR2B inhibitor Ro-25-6981 (0.5 μm) reduced the amplitude of outward-going EPSCs, confirming that these events included a strong NMDAR-dependent component. B, Representative EPSCs recorded at −80 mV (inward-going currents) and +40 mV (outward-going currents) in AAV-treated WT and 5xFAD mice. C, Mean ± SEM EPSC amplitudes recorded at −80 mV (inward) and +40 mV (outward) in AAV-treated WT and 5xFAD mice. WT-CT group, 16 cells from 15 mice; WT-VIVIT group, 10 cells from 9 mice; 5xFAD-CT group, 16 cells from 11 mice; 5xFAD-VIVIT, 9 cells from 7 mice. D, Change in the synaptic transmission failure rate (%) in individual cells held at −80 vs +40 mV from AAV-treated WT and 5xFAD mice. E, Mean ± SEM change in the failure rate in cells held at −80 vs +40 mV from AAV-treated WT and 5xFAD mice. F–I, Time plots and bar graphs illustrate genotype/AAV differences in isolated NMDAR potentials. Time plots in F and H show normalized field EPSP recordings during washin of CNQX, picrotoxin, and the NR2A blocker PPPA to isolate NR2B EPSPs (F) or CNQX, picrotoxin, and the NR2B blocker Ro-25-6981 to isolate NR2A EPSPs (H). Bar graphs show the mean ± SEM amplitude of NR2B (G) and NR2A (I) EPSPs (measured at time point 2 in F and H) as a proportion (%) of the corresponding drug-free EPSP (measured at time point 1 in F and H). WT-CT group, 11 mice/group; WT-VIVIT group, 10 mice/group; 5xFAD-CT group, 12 mice/group; 5xFAD-VIVIT group, 10 mice/group. F, H, Insets, Representative field potentials recorded before (1) and after (2) drug washin. Calibration: 1 mV, 5 ms. For C, G, and I, genotype and AAV treatment effects were determined with ANOVA and Fisher's LSD test. For E, genotype and AAV treatment effects were determined with rmANOVA and Fisher's LSD test.
ANOVA also detected a genotype effect for synaptic transmission failure rate at +40 mV vs −80 mV (Fig. 7D,E; F(1,47) = 7.82, p = 0.008). Post hoc tests showed a significant decrease in the failure rate for both 5xFAD-CT and 5xFAD-VIVIT mice relative to WT-CT mice (5xFAD-CT vs WT-CT p = 0.03; 5xFAD-VIVIT vs WT-CT p = 0.03, Fisher's LSD test) indicative of a higher proportion of functionally silent synapses (Isaac et al., 1995; Liao et al., 1995) in 5xFAD mice. No effect of VIVIT treatment within the 5xFAD group was observed. The results suggest that population synaptic deficits in 5xFAD-CT mice are at least partially due to the silencing of functional synapses, but, this silencing appears to be independent of hyperactive CN/NFAT signaling in astrocytes.
The increased amplitude of outward-going EPSCs in 5xFAD-CT, but not 5xFAD-VIVIT mice (Fig. 7C), suggests that NMDAR function at surviving synapses is proportionally increased in a CN/NFAT-dependent manner. To test this possibility, field EPSPs were recorded in CA1 stratum radiatum under normal perfusion conditions and 10–20 min after the pharmacological isolation of NMDAR potentials (Fig. 7F–I; WT-CT, 11 mice/group; WT-VIVIT, 10 mice/group; 5xFAD-CT, 12 mice/group; 5xFAD-VIVIT, 9 mice/group). NMDAR-dependent EPSPs were isolated by including AMPAR and GABAR blockers (CNQX and picrotoxin) in the perfusion media. The NR2A antagonist (PPPA) or the NR2B antagonist (Ro-25-6981) were also added to further isolate the NR2B (Fig. 7F,G) and NR2A (Fig. 7H,I) components of the NMDAR-mediated EPSP. For WT mice, both the NR2B and NR2A components were ∼20% of the baseline field EPSP (Figs. 7G,I). There were no genotype or AAV treatment effects for NR2B-dependent EPSPs (Fig. 7G). In contrast, there were significant effects of both genotype and AAV treatment on the isolated NR2A-mediated EPSP (Fig. 7I; genotype: F(1,38) = 6.7, p = 0.01; AAV: F(1,38) = 3.9, p = 0.05). Post hoc tests revealed a proportional increase in the NR2A-dependent EPSP in 5xFAD-CT mice relative to WT-CT mice (p = 0.009, Fisher's LSD test). In contrast, the NR2A EPSP in 5xFAD-VIVIT mice was statistically comparable to that in WT-CT mice and was significantly reduced relative to that in the 5xFAD-CT group (p = 0.04, Fisher's LSD test). Thus, astrocytic CN/NFAT signaling appears to alter the balance of NMDAR sensitivity in CA1, which could further contribute to excitotoxic damage.
Discussion
Our results directly implicate activated astrocytes in the emergence of pathologic glutamate signaling in AD. Neuronal hyperexcitability in 5xFAD mice was revealed using several independent approaches, including in vivo glutamate sampling, in situ whole-cell patch-clamp analysis of spontaneous EPSCs, and in situ field recordings of NMDA-dependent EPSPs. For each approach, the blockade of astrocytic CN/NFAT activity normalized glutamate signaling, providing critical insights into the mechanisms that drive neuronal dysfunction/deterioration during the progression of AD.
Activated astrocytes are permissive for hyperactive CN signaling
Although featured prominently in nearly every neurodegenerative disorder, activated astrocytes have a complex phenotype, and their roles in pathophysiology remain unclear. However, the appearance of activated astrocytes at early stages of AD (Carter et al., 2012; Schöll et al., 2015) suggests an important role in the emergence of later pathophysiological changes. We have exploited specific changes in the CN/NFAT pathway to determine how activated astrocyte signaling specifically affects neural function (Furman et al., 2012, 2016; Pleiss et al., 2016). Several lines of evidence in human AD and AD mouse models suggest that CN/NFAT signaling is elevated during disease progression (Liu et al., 2005; Norris et al., 2005; Reese et al., 2008; Abdul et al., 2009; Wu et al., 2010; Lim et al., 2013). Levels of cytosolic Ca2+, the primary endogenous activator of CN, show higher and more rapid fluctuations in astrocytes of amyloidogenic mice (Kuchibhotla et al., 2009). Moreover, Ca2+-dependent proteases, which show increased expression in activated astrocytes (Gray et al., 2006; Kim et al., 2016), can cleave CN into highly active proteolytic fragments (Wu et al., 2004). Thus, activated astrocytes seemingly provide a very permissive environment for hyperactive CN signaling. In the present study, CN proteolysis occurred almost exclusively in 5xFAD mice and increased in direct proportion with GFAP levels. Similar observations were recently made for activated astrocytes associated with Aβ deposits and microinfarcts in humans (Pleiss et al., 2016). NFAT4 expression in 5xFAD mice paralleled that of ΔCN, confirming that the NFAT4 isoform is an excellent marker for activated astrocytes (Lim et al., 2013; Furman et al., 2016). NFATs are well known for their pivotal roles in phenotype switching in a variety of tissues (Furman and Norris, 2014). The present results suggest that ΔCN/NFAT4 is central to a deleterious astrocyte phenotype that is responsible for glutamate dysregulation.
Activated astrocytes, CN/NFATs, and network excitability
Glutamate is an essential neurotransmitter but can cause hyperexcitability and excitotoxic damage if key regulatory mechanisms are disrupted. Symptoms of neuronal hyperexcitability develop in up to 40% of patients in whom AD has been diagnosed (e.g., subclinical epileptiform activity), and patients with AD and epileptiform comorbidities show accelerated cognitive decline (Vossel et al., 2016). Moreover, therapeutics that reduce excitability, including the NMDAR blocker memantine, slow the progression of dementia when administered to subjects with mild, moderate, or severe AD (Reisberg et al., 2003; Tariot et al., 2004; Peskind et al., 2006). Hyperexcitability is also a key phenotypic feature of many common AD mouse models (Palop et al., 2007; Busche et al., 2008; Grienberger et al., 2012; Bomben et al., 2014; Kellner et al., 2014; Šišková et al., 2014; Hefendehl et al., 2016; Fontana et al., 2017). Although we did not see genotype- or AAV-dependent changes in basal glutamate in CA1, other dynamic properties of glutamate regulation/signaling, including glutamate transient rate and duration in vivo and spontaneous synaptic activity ex vivo, showed significant elevations in 5xFAD mice. Further signs of hyperexcitability included a reduced PS threshold and a proportional increase in NMDAR function. The delivery of VIVIT to astrocytes significantly ameliorated nearly all of these changes, suggesting that alterations in astrocyte signaling play a major role in the development of hyperactive neuronal circuits during AD.
Critical glutamate regulatory mechanisms in astrocytes are lost and/or disrupted with AD, in parallel with astrocyte activation (Masliah et al., 1996; Abdul et al., 2009; Simpson et al., 2010). Levels and/or function of the astrocytic glutamate transporter EAAT2/GLT-1 decline in human hippocampus at the onset of cognitive dysfunction (Abdul et al., 2009) and are similarly disrupted in numerous AD mouse models (Masliah et al., 2000; Mookherjee et al., 2011; Schallier et al., 2011; Scimemi et al., 2013; Meeker et al., 2015; Audrain et al., 2016; Hefendehl et al., 2016; Xu et al., 2016). Reduced EAAT2/GLT-1 levels have also been linked to excitotoxicity via increased activation/sensitivity of NMDARs (Fleming et al., 2011; Aida et al., 2012; Armbruster et al., 2016; Gong et al., 2016). Moreover, several reports have shown that network excitability in AD mouse models (Zumkehr et al., 2015; Hefendehl et al., 2016) and other disease models (Prow and Irani, 2008; Harvey et al., 2011; Karklin Fontana et al., 2016) are greatly reduced by increasing the expression and/or function of EAAT2/GLT-1.
The EAAT2/GLT-1 promoter has multiple putative binding sites for NFATs and other transcription factors linked to glial activation and neuroinflammation (Kim et al., 2003; Su et al., 2003; Mallolas et al., 2006). Transcription of EAAT2/GLT-1 may be upregulated or downregulated by these factors, depending on the conditions involved in cellular activation (Su et al., 2003). We previously found that GLT-1 levels were reduced in primary rat astrocytes in a CN/NFAT-dependent manner during treatment with IL-1β (Sama et al., 2008) or Aβ (Abdul et al., 2009), both of which are found at high levels in human AD and many AD mouse models. Here, we found that the inhibition of astrocytic CN/NFATs in astrocytes with VIVIT led to elevated GLT-1 expression in 5xFAD mice, particularly in the vicinity of Aβ deposits. The results suggest that astrocytic CN/NFATs, and their impact on EAAT2/GLT-1 expression, is a major mechanism for glutamate dysregulation and hyperexcitability arising with AD.
Astrocytic CN/NFAT and synaptic deficits
Excess glutamate causes dendritic degeneration and synapse loss in numerous injury and disease models. Consistent with glutamate toxicity, 5xFAD mice showed signs of dendritic degeneration, in parallel with reduced population EPSPs in CA1 stratum radiatum. While the amplitude of miniature AMPAR currents was not reduced in 5xFAD mice, we did observe a significant drop in the synaptic transmission failure rate when EPSCs were minimally evoked at +40 vs −80 mV, suggesting a higher proportion of functionally silent synapses (Isaac et al., 1995; Liao et al., 1995). To our knowledge, this evidence is the first to directly implicate synapse silencing as a mechanism for synapse loss/dysfunction with AD. Astrocytic CN/NFATs do not appear to be involved in the conversion of functional-to-silent synapses in 5xFAD mice because transmission failure rates were not significantly affected by AAV treatment. The beneficial effects of AAV-Gfa2-VIVIT on evoked population EPSPs, therefore, most likely reflect the structural preservation of dendrites and synapses.
Interestingly, 5xFAD-CT mice exhibited a proportional increase in NR2A function, and this effect was significantly reduced by VIVIT. This increase may reflect a compensatory response to synapse loss or impaired synaptic efficacy (Nudmamud-Thanoi et al., 2006; Lacey et al., 2012), which nonetheless could ultimately lead to synapse instability. For instance, earlier work reported that Aβ triggers dendritic spine loss and synapse dysfunction specifically through the increased activation of NR2A receptors (Tackenberg et al., 2013). NR2A receptors also appear to be highly sensitive to glutamate transport at the synapse and exhibit greater function when GLT-1-mediated transport is reduced (Armbruster et al., 2016), which is consistent with the present findings. Together, the results suggest that the CN/NFAT-dependent loss of GLT-1, and the impaired uptake of synaptic glutamate, could adversely augment NR2A function, leading to dendritic damage and synapse dysfunction.
Effects of VIVIT in other cell types during progression of AD-related pathology
In addition to astrocytes, hyperactive NFAT signaling linked to AD pathology has also been targeted in microglia and neurons using VIVIT. In primary microglia, where NFATs 1 and 2 play a predominant role, VIVIT reduced the expression of several cytokines linked to chronic neuroinflammation, including TNF-α and monocyte chemoattractant protein-1 (Nagamoto-Combs and Combs, 2010). Follow-up studies from the Combs laboratory showed that intraventricular delivery of VIVIT peptide suppressed microglial activation and reduced Aβ plaque load in intact APP/PS1 mice (Rojanathammanee et al., 2015), similar to what we have observed following VIVIT delivery to astrocytes (Furman et al., 2012; Fig. 4A–C). However, unlike the present findings and our earlier work, intraventricular delivery of VIVIT did not improve cognition in the study by Rojanathammanee et al. (2015), perhaps because of the timing (post-Aβ pathology vs pre-Aβ pathology) and/or duration of treatment (1 month treatment vs multiple months). In neurons, targeted delivery of a constitutively active form of NFAT3, which is upregulated with human AD (Abdul et al., 2009; Wu et al., 2010), recapitulated dendritic spine loss and dendritic degeneration, typically associated with elevated Aβ levels (Hudry et al., 2012). Conversely, AAV-mediated delivery of VIVIT directly to neurons of an intact mouse model of AD reduced dendritic spine loss, particularly in the vicinity of Aβ deposits. Thus, VIVIT appears to protect the integrity of neurites whether targeted to astrocytes or neurons. Together, these results suggest that pharmacologic agents specifically targeting NFAT activity—regardless of cell type—could provide clinical efficacy in cases of human AD, either as an individual therapy or when given in conjunction with newly developed Aβ-inhibiting treatments.
Footnotes
This work was supported by National Institutes of Health Grants AG027297 and AG051945 to C.M.N. and Grant AG000242-20 to P.S.; and The Hazel Embry Research Trust. We thank Drs. Eric M. Blalock and Richard Kryscio for conceptual and statistical input.
G.A.G. is the sole proprietor of Quanteon, LLC, which makes the FAST mkII recording system used for glutamate measures. The authors declare no other competing financial interests.
- Correspondence should be addressed to Dr. Christopher M. Norris, Department of Pharmacology and Nutritional Sciences, University of Kentucky College of Medicine, 224 Sanders-Brown Building, 800 South Limestone Street, Lexington, KY 40536. cnorr2{at}uky.edu


