

Abstract
β-Secretase [β-site amyloid precursor protein-cleaving enzyme 1 (BACE1)] is the key rate-limiting enzyme for the production of the β-amyloid (Aβ) peptide involved in the pathogenesis of Alzheimer's disease (AD). BACE1 levels and activity are increased in AD brain and are likely to drive Aβ overproduction, but the cause of BACE1 elevation in AD is unknown. Interestingly, cerebral glucose metabolism and blood flow are both reduced in preclinical AD, suggesting that impaired energy production may be an early pathologic event in AD. To determine whether reduced energy metabolism would cause BACE1 elevation, we used pharmacological agents (insulin, 2-deoxyglucose, 3-nitropropionic acid, and kainic acid) to induce acute energy inhibition in C57/B6 wild-type and amyloid precursor protein (APP) transgenic (Tg2576) mice. Four hours after treatment, we observed that reduced energy production caused a ∼150% increase of cerebral BACE1 levels compared with control. Although this was a modest increase, the effect was long-lasting, because levels of the BACE1 enzyme remained elevated for at least 7 d after a single dose of energy inhibitor. In Tg2576 mice, levels of the BACE1-cleaved APP ectodomain APPsβ were also elevated and paralleled the BACE1 increase in both relative amount and duration. Importantly, cerebral Aβ40 levels in Tg2576 were increased to ∼200% of control at 7 d after injection, demonstrating that energy inhibition was potentially amyloidogenic. These results support the hypothesis that impaired energy production in the brain may drive AD pathogenesis by elevating BACE1 levels and activity, which, in turn, lead to Aβ overproduction. This process may represent one of the earliest pathogenic events in AD.
- Alzheimer's disease pathogenesis
- β-secretase
- BACE1
- β-amyloid peptide
- APP transgenic mice
- energy metabolism
Introduction
Alzheimer's disease (AD) is characterized by senile plaques composed of β-amyloid (Aβ) peptide (Glenner and Wong, 1984; Masters et al., 1985). The 42 aa Aβ (Aβ42) may induce AD pathogenesis, because early-onset familial AD (FAD) mutations increase Aβ42 production (Younkin, 1998; Hardy and Selkoe, 2002). Although the molecular pathophysiology in sporadic cases of AD (SAD) is unknown, it is likely to also involve Aβ42.
Aβ is cleaved from the amyloid precursor protein (APP) by two enzymes, the β- and γ-secretases (Sisodia et al., 1999; Esler and Wolfe, 2001). First, APP is cut by β-secretase to produce the secreted APPsβ ectodomain and the membrane-bound C-terminal fragment C99. Next, C99 is cleaved by γ-secretase, which releases Aβ. The β-secretase, β-site amyloid precursor protein-cleaving enzyme 1 (BACE1), is the key rate-limiting enzyme for the generation of Aβ (Hussain et al., 1999; Sinha et al., 1999; Vassar et al., 1999; Yan et al., 1999; Lin et al., 2000). FAD cases caused by the APP Swedish mutation (K670N, M671L) (Mullan et al., 1992), which enhances cleavage by BACE1 (Citron et al., 1992), imply that increased activity of BACE1 may be sufficient to induce AD pathogenesis. Interestingly, levels of BACE1 protein and activity are elevated in SAD brains (Fukumoto et al., 2002; Holsinger et al., 2002; Tyler et al., 2002; Yang et al., 2003; Li et al., 2004), suggesting that high BACE1 activity may drive Aβ overproduction and thus promote AD. However, the underlying physiological mechanism responsible for BACE1 elevation in SAD is unknown.
In the search for mechanisms that increase BACE1 levels in SAD, impaired energy production emerged as a likely candidate. Positron emission tomography imaging studies have shown that glucose utilization is lower in AD brains than in age-matched controls (de Leon et al., 1983a,b; Rapoport et al., 1991; Rapoport, 1999). Furthermore, reduced brain glucose metabolism has also been reported in patients with mild cognitive impairment, suggesting that insufficient energy production may be a factor in preclinical AD (Reiman et al., 1996; Small et al., 2000; De Santis et al., 2001; Mosconi et al., 2004; Mosconi, 2005). In addition, energy metabolism inhibition increases amyloidogenic APP processing in vitro (Gabuzda et al., 1994; Gasparini et al., 1997, 1999; Webster et al., 1998).
Although the functions of BACE1 and APP are unclear, both have been implicated in stress/injury response. Importantly, BACE1 levels are elevated after traumatic brain injury (TBI) (Blasko et al., 2004), ischemia (Wen et al., 2004), and oxidative stress (Tamagno et al., 2002; Tong et al., 2005). These observations suggest that stress caused by energy insufficiency may stimulate BACE1 and Aβ production, thus triggering SAD. To test this hypothesis, we examined the effects of energy production inhibition on BACE1 levels and APP processing in mouse brain. We found that acute energy inhibition with pharmacological agents in wild-type and APP transgenic mice increased cerebral levels of BACE1, APPsβ, and Aβ40. These results suggest that impaired brain energy metabolism may be one of the earliest proamyloidogenic events in the pathogenesis of SAD.
Materials and Methods
Animals and drug treatments. C57/B6 and Tg2576 mice were purchased from Taconic Farms (Germantown, NY). The APPSWE (Tg2576) mouse model (Hsiao et al., 1996) carries a transgene coding for the 695 aa isoform of human APP with the Swedish mutation (K670N, M671L; 770 aa isoform numbering) (Mullan et al., 1992). All animals were 2-3 months of age at the time of treatments and were randomized by age, weight, and gender into five experimental groups (n = 4-9 animals per group per time) with three recovery times (4 h, 2 d, and 7 d): vehicle (0.9% isotonic saline), insulin (18 U/kg), 2-deoxyglucose (2DG) (1 g/kg), 3-nitropropionic acid (3NP) (100 mg/kg), and kainic acid (KA) (30 mg/kg). All agents were administered by a single intraperitoneal injection. Regular insulin was purchased from Henry Schein (Melville, NY), and 2-deoxyglucose, 3-nitropropionic acid, and kainic acid were obtained from Sigma (St. Louis, MO). These procedures were performed with approval from the Northwestern University Animal Use and Care Committee.
Tissue preparation. At 4 h, 2 d, or 7 d after injection, animals were anesthetized with an intraperitoneal injection of pentobarbital (100 mg/kg). When respiration was stable and the mouse no longer responded to foot pinch, skin was rinsed with 70% ethanol, and an incision was made exposing the heart for transcardial perfusion with 20 ml of cold perfusion buffer: (in mm 10 HEPES, 137 NaCl, 4.6 KCl, 1.1 KH2PO4, 0.6 MgSO4, and 1.1 EDTA) containing protease inhibitors (20 μg/ml PMSF, 0.5 μg/ml leupeptin, 20 μm sodium orthovanadate, and 100 μm DTT). After perfusion, brains were harvested and divided down the midline. Left hemibrains were placed in 4% paraformaldehyde overnight at 4°C for histology, and right hemibrains were snap frozen in liquid N2 for biochemical analyses. Left hemibrains were stored in cryopreserve [20% sucrose (w/v), 0.01% Na-azide (w/v), 0.23 m NaH2PO4, and 0.2 m Na2HPO4] at 4°C, and right hemibrains were stored at -80°C until analysis.
Hemibrains were homogenized in cold PBS containing protease inhibitors, centrifuged at 2000 × g for 10 min at 4°C, supernatant was removed, and total protein concentration was determined by the BCA method (Pierce, Rockford, IL).
Immunoblot analysis. Hemibrain homogenates (3 mg/ml) were diluted 1:1 with sample boiling buffer (60 mm Tris, 10% glycerol, 5% SDS), pH 6.8, and 3.5% loading dye, and boiled for 5 min. Protein (15 μg) was run on 10% SDS-PAGE (Criterion Gel System; Bio-Rad, Hercules, CA) and transferred onto polyvinylidene difluoride (PVDF) membranes (0.45 μm pore; Millipore, Bedford, MA). Membranes were blocked at room temperature for 1 h in 5% nonfat milk in Tris-buffered saline containing 0.1% Tween 20 (TBST) and were then incubated with primary antibody against BACE1 (PA1-757; 1:1000 dilution; Affinity BioReagents, Golden, CO), APP (22C11; 1:5000 dilution; Chemicon, Temecula, CA), APPsβ(sw) neoepitope (1:5000 dilution) (Seubert et al., 1993; Vassar et al., 1999; Cole et al., 2005), or β-actin (1:15000 dilution; Sigma) at 4°C overnight. Subsequently, horseradish peroxidase-conjugated secondary antibodies (Jackson ImmunoResearch, West Grove, PA) were applied to blots for 1 h at room temperature and detected using enhanced chemiluminescence (ECL+; Amersham Biosciences, Piscataway, NJ). Immunoblot signals for specific proteins were then visualized and measured using an Eastman Kodak (Rochester, NY) CF440 imager and normalized against the β-actin signal in the same sample for relative quantification. When necessary, blots were stripped (100 mm 2-mercaptoethanol, 2% SDS, and 62.5 mm Tris-HCl, pH 7.6) for 30 min at 65°C and were then washed in TBST before reincubation with fresh primary antibody.
Aβ40 ELISA. Aβ40 levels in hemibrain homogenates were determined using an Aβ40-specific sandwich ELISA (BioSource International, Camarillo, CA) according to the recommendations of the manufacturer. Briefly, hemibrains were homogenized in 4 vol of PBS, 500 μm 4-(2-aminoethyl)benzenesulfonylfluoride (AEBSF; Calbiochem, La Jolla, CA), and total protein concentrations were determined using BCA assay (Pierce, Rockford, IL). Triton X-100 was added to a final concentration of 1%, and samples were sonicated for ∼20 s and adjusted to the same protein concentration (0.45 or 0.7 μg/μl) and then diluted 4.3× with ELISA kit diluent buffer plus 500 μm AEBSF. Equal protein amounts of each sample (22.5 or 35 μg/well) and Aβ40 standards (diluted in the same ELISA buffer; 500 μm AEBSF) were added to ELISA plate wells in duplicate and were then processed for colorimetric development according to the protocol of the manufacturer. Optical densities at 450 nm of each well were read on a Victor 1420 plate reader (PerkinElmer Life and Analytical Sciences, Turku, Finland), and sample Aβ40 concentrations were determined by comparison with the Aβ40 standard curve. All readings were in the linear range of the assay. Finally, sample Aβ40 concentration values were normalized to total brain protein concentrations and expressed in picograms per milligram of protein. The average of the duplicates was determined, and then the mean and SEM for a given treatment was calculated.
RNA isolation and real-time PCR. Hemibrains from C57/B6 mice were homogenized in QIAzol Lysis Reagent and RNA was isolated using the RNeasy Lipid Mini kit (Qiagen, Valencia, CA). After RNA concentration determination, 1 μg of total RNA from each sample was used for first-strand cDNA synthesis using the Advantage RT for PCR kit (Clontech, Mountain View, CA). cDNA was amplified using quantitative real-time PCR with Assays-on-Demand premixed Taqman primer/probe set for mouse BACE1 mRNA (catalog #Mm00478664_m1; Applied Biosystems, Foster City, CA) and analyzed using an Applied Biosystems 7900HT sequence analyzer with the relative quantification method normalized against 18S rRNA (Applied Biosystems catalog #4333760F). Samples were run in triplicate, sample averages were determined, and then means and SEMs were calculated based on the sample averages. All procedures were performed according to the recommendations of the manufacturer.
Histology. Hemibrains were sectioned parasagittally on a freezing microtome at 30 μm. Alternate serial sections were floated in 0.1 m phosphate buffer, pH 7.6, and then were either stained in cresyl violet or incubated with rabbit anti-glial fibrillary acidic protein (GFAP) primary antibody (1:10,000; Sigma) overnight at room temperature. After subsequent washes, the sections were incubated with secondary biotinylated goat anti-rabbit at 1:2000 for 2 h at room temperature. The Vector Laboratories (Burlingame, CA) ABC kit was used with DAB as chromagen to visualize the reaction product. Sections were then mounted on charged slides, dehydrated in a series of alcohols, cleared in xylene, and coverslipped. Hematoxylin was used as a counterstain for GFAP immunohistochemistry. Differential interference contrast microscopy was performed using a Nikon (Tokyo, Japan) E800 microscope with a Spot advanced digital camera (Diagnostic Instruments, Sterling Heights, MI) for capturing images.
Statistical methods. Immunoblot and ELISA quantifications are presented as the mean ± SEM. Comparisons between groups were made using one-way ANOVA and Prism (Graph Pad Software, San Diego, CA) with post hoc analysis by Neuman-Keuls test. An effect of treatment was defined as significant if p < 0.05 by the F test in the ANOVA.
Results
Pharmacological inhibition of energy production in the brain
To initially test the hypothesis that cerebral energy impairment may be proamyloidogenic, we examined whether transient reductions in energy production in vivo would increase BACE1 and Aβ levels. To do so, we treated 2- to 3-month-old wild-type C57/B6 and transgenic Tg2576 mice by single intraperitoneal injection with several pharmacological agents that inhibit energy metabolism by different mechanisms: (1) insulin (18 U/kg), which induces rapid, severe hypoglycemia; (2) 2DG (1 g/kg), a competitive inhibitor of glucose that binds and reversibly inactivates hexokinase, thus reducing glucose flux through glycolysis; (3) 3NP (100 mg/kg), an irreversible inhibitor of succinate dehydrogenase, thus inhibiting carbon flux through the Krebs' cycle; (4) KA (30 mg/kg), a glutamate analog that induces seizure and evokes a large energy demand on glutaminergic neurons. These agents and doses have been shown in previous studies to induce acute reduction in brain energy production without causing significant neurodegeneration (Auer et al., 1984; McKhann et al., 2003; Brownell et al., 2004).
All treated mice displayed typical behaviors associated with inhibition of energy metabolism, including low or no motor activity, lethargy, and lack of response to touch. For insulin-induced hypoglycemia, these behaviors correlated with extremely low blood glucose levels (20-30 mg/dl in insulin-injected mice compared with ∼130 mg/dl in vehicle-injected mice). For KA-treated animals, reduced motor activity preceded the onset of mild-to-moderate seizures (stages 2-4) (McKhann et al., 2003). Behavioral onset was rapid after injections with 2DG, 3NP, and KA (∼5-10 min) and more delayed for insulin treatment (∼45-60 min). All mice generally recovered within 4 h, and no additional abnormal behaviors were observed for up to 7 d (the last time point analyzed).
To determine whether neurodegeneration occurred as a result of treatments, after 7 d of recovery, brains from representative treated mice were harvested, and alternate brain sections were stained with either cresyl violet or anti-GFAP antibody counterstained with hematoxylin. GFAP immunoreactivity was not elevated in brains from treated mice compared with vehicle controls (Fig. 1), indicating that the energy inhibitors did not induce significant astrogliosis, a well known response to trauma or stress in the brain (for review, see Little and O'Callaghan, 2001). Importantly, the treatments did not appear to cause obvious signs of neurodegeneration after examination of cresyl violet (data not shown) or hematoxylin-stained (Fig. 1) brain sections. Together, our observations indicated that treatment with all of the pharmacological agents led to acute reduction of energy metabolism in the brain without significant neurodegeneration or astrogliosis over the time period tested.
Cerebral BACE1 levels are elevated after energy inhibition
After administration of energy inhibitors, mice were allowed to recover for 4 h, 2 d, or 7 d. Brains were then harvested and bisected, and hemibrains were prepared for histology or SDS-PAGE/immunoblot analysis and Aβ40 ELISA. First, we investigated whether reduced energy metabolism in the brain would cause an increase in BACE1 levels, as determined by immunoblot analysis. It has been our experience that many anti-BACE1 antibodies label nonspecific bands on immunoblots, thus, to determine the specificity of the anti-BACE1 antibody (PA1-757; Affinity Bioreagents) used in this study, we performed immunoblot analysis of brain homogenates from BACE1+/+ and BACE1-/- control mice (Luo et al., 2001). PA1-757 recognizes the C termini of both human and mouse BACE1 and identifies a band of ∼70 kDa on immunoblots (Fig. 2). This ∼70 kDa band was present in BACE1+/+ brain samples but was absent in the BACE1-/- brain homogenate (Fig. 2, - lane). Moreover, lysate from a human BACE1-overexpressing 293 cell line showed a strong band at ∼70 kDa (Fig. 2, + lane). Minor nonspecific bands of various sizes were also observed but could easily be distinguished from the BACE1 signal. Together, these results demonstrated that the PA1-757 anti-BACE1 antibody recognized authentic BACE1 in mouse brain homogenates by immunoblot.

Acute energy inhibition does not cause overt neurodegeneration or astrogliosis. A-J, Two- to 3-month-old Tg2576 mice were given a single intraperitoneal injection of 18 U/kg insulin (INS; C, D), 1 g/kg 2DG (E, F), 100 mg/kg 3NP (G, H), 30 mg/kg KA (I, J), or vehicle (VEH; A, B) and were then allowed to recover for 7 d. Brains were harvested, parasagittal sections were cut, and immunohistochemistry was performed using an anti-GFAP antibody and hematoxylin counterstaining. A, C, E, G, I, Low-magnification images of the hippocampus showing pyramidal cell layers of CA1/2, CA3, and the dentate gyrus (DG). No significant reduction in cell-layer thickness was observed with any of the treatments compared with vehicle control, demonstrating that energy inhibitors did not cause gross neuronal loss or neurodegeneration. B, D, F, H, J, High-magnification images of hippocampal astrocytes near CA3 stained with anti-GFAP antibody. Arrowheads show representative astrocytes. Note that comparable numbers of GFAP-immunopositive astrocytes are present in energy-inhibitor-treated and vehicle control hippocampi, indicating that agents did not induce significant astrogliosis. Scale bars: A, B, 200μm.
Having proven the specificity of the anti-BACE1 antibody, we then investigated the effects of acute energy inhibition on BACE1 levels in wild-type C57/B6 mouse brain homogenates by immunoblot. In vivo inhibition of energy production induced by each of the four pharmacological agents resulted in significant increases in BACE1 protein levels (∼150% of vehicle control values) within 4 h [Fig. 3A,B (***p < 0.001; one-way ANOVA)]. Moreover, BACE1 levels continued to be significantly elevated (∼125-150% of vehicle control) after 2 and 7 d of recovery (Fig. 3C-F). These results demonstrated that the increase in BACE1 protein levels is an early and long-lasting response to in vivo inhibition of energy production in the brains of wild-type C57/B6 mice.

Representative BACE1 immunoblot of brain homogenates from treated Tg2576 mice. Two- to 3-month-old Tg2576 mice were given a single intraperitoneal injection of 18 U/kg insulin, 1 g/kg 2DG, 100 mg/kg 3NP, 30 mg/kg KA, or vehicle and were then allowed to recover for 4 h. Brains were harvested and homogenized, and 15 μg of total protein per lane for each sample was separated on 10% SDS-PAGE and transferred onto PVDF membrane. Blots were then incubated with anti-BACE1 antibody PA1-757 (directed against the C-terminal 17 aa), and signals were detected with ECL+, followed by visualization on a Kodak imager (top panel). Blots were then stripped and reincubated with anti-β-actin antibody (bottom panel). Included on the blot was a BACE1-/- brain homogenate as a negative control (- lane) and a lysate (1 μg) from a human BACE1-overexpressing HEK293 (human embryonic kidney 293) cell line (+ lane). Molecular mass markers are indicated by arrows on the right. Note that the intensities of the BACE1 bands are significantly increased in brain samples from nearly all of the mice treated with energy inhibitors, compared with those that received vehicle only.
To determine whether the BACE1 protein elevation was attributable to increased gene transcription or mRNA stability, we performed acute energy inhibition experiments on additional C57/B6 mice and measured BACE1 mRNA levels in the brain by quantitative real-time PCR (TaqMan; Applied Biosystems) analysis. Importantly, BACE1 mRNA levels did not appear to change significantly after any treatment or recovery period, compared with vehicle controls (data not shown), suggesting that BACE1 elevations after energy inhibition were unlikely to be the result of increased BACE1 gene expression or mRNA stability.
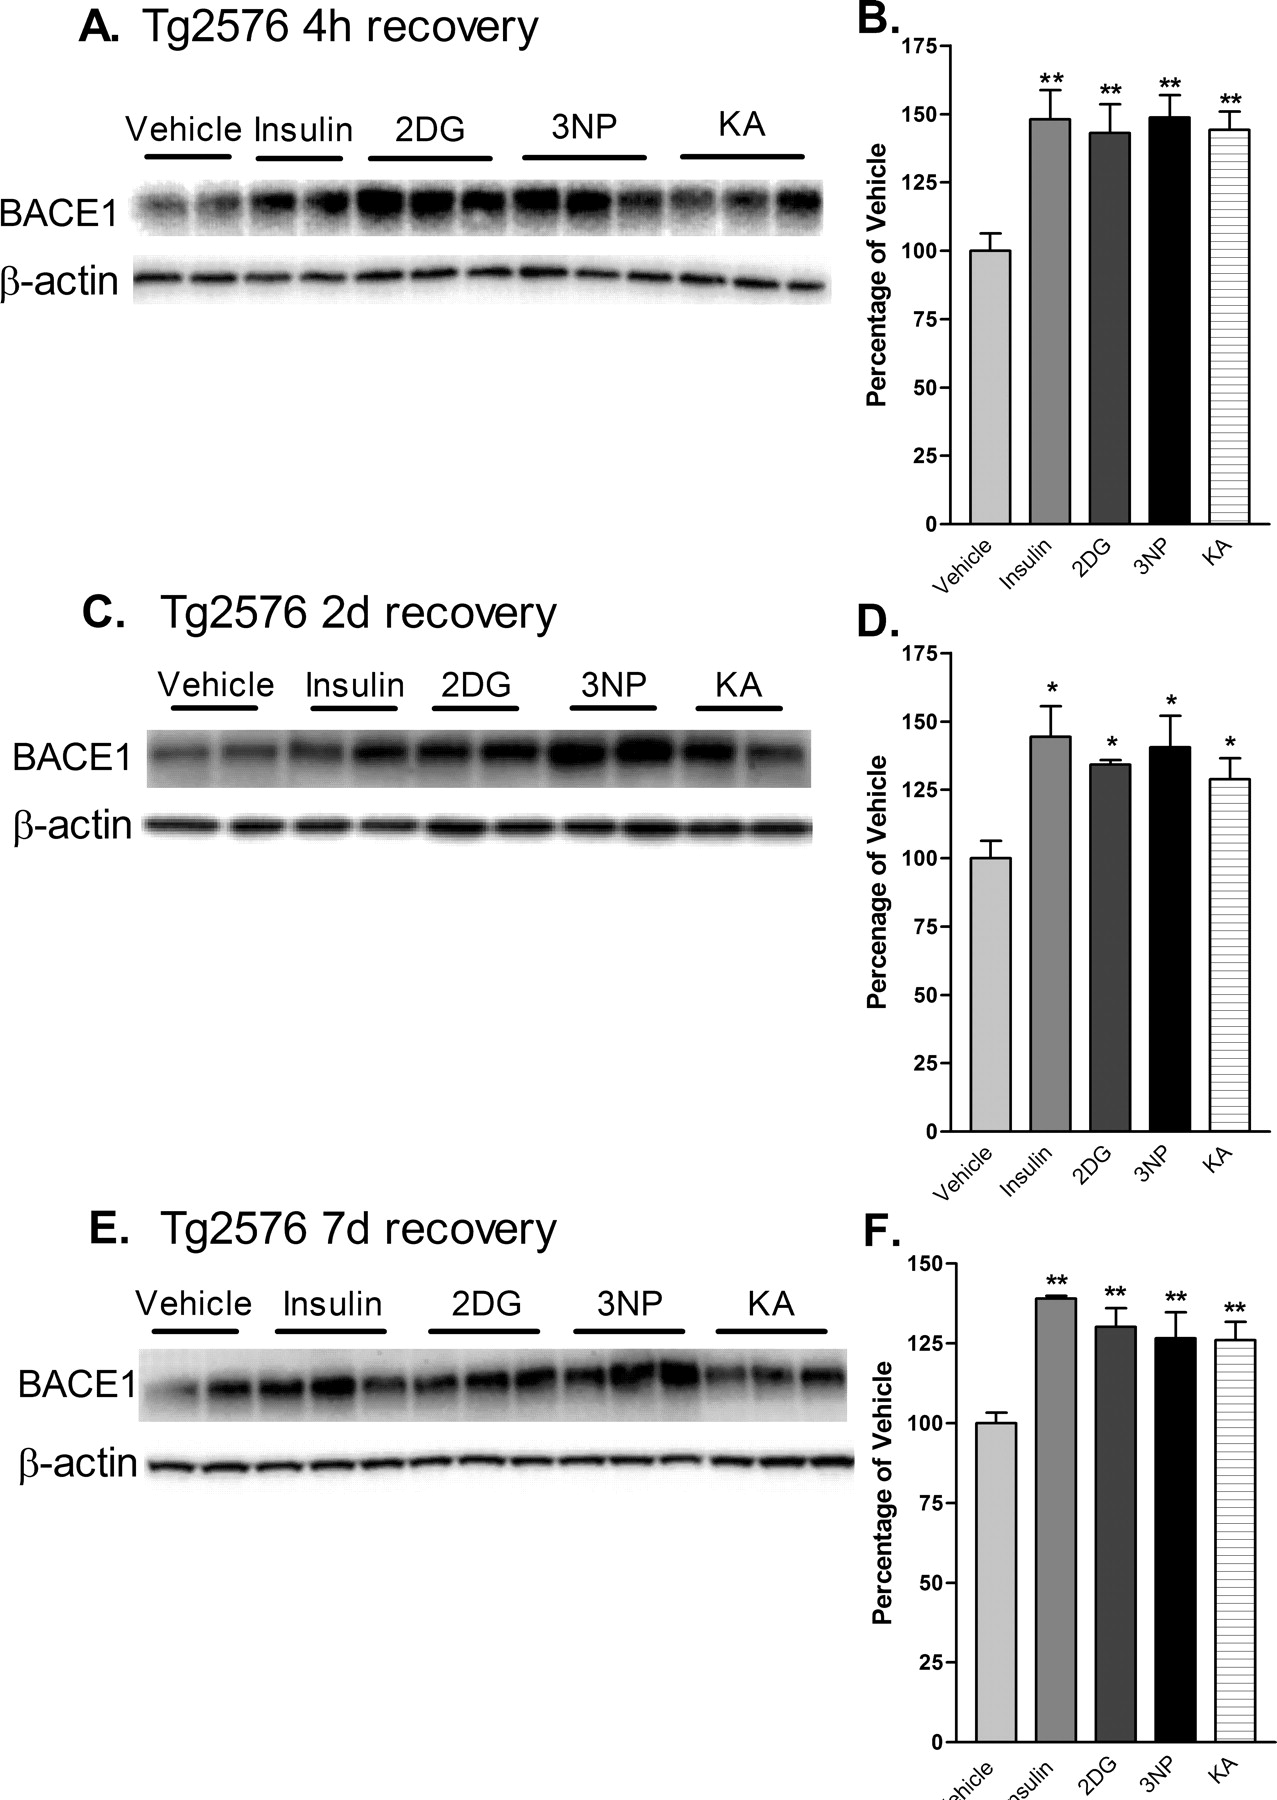
Tg2576 is a well studied transgenic mouse model of AD that overexpresses APP with the Swedish mutation (APPsw) (Mullan et al., 1992) and develops amyloid plaques at ∼9-12 months of age (Hsiao et al., 1996). To determine the effects of acute energy inhibition on cerebral BACE1 levels and proamyloidogenic APP processing in vivo, we treated Tg2576 with single doses of the four energy inhibitors and allowed mice to recover for 4 h, 2d, and 7d, as before. At 4 h after injection, all treatments resulted in increases of brain BACE1 protein levels that were similar in magnitude to those observed in C57/B6 mice (∼150% of vehicle control values; p < 0.001, one-way ANOVA) (Figs. 2, 4A,B). As a control for the transgene, Tg2576 negative littermates were also treated and responded to all treatments in a manner similar to C57/B6 and Tg2576 positive mice (data not shown). When Tg2576 mice were allowed to recovery for 2 or 7 d, BACE1 levels continued to be elevated to ∼130-145% and ∼127-140% of vehicle control values, respectively (Fig. 4C-F). Thus, BACE1 protein levels appeared to increase as a result of impaired brain energy metabolism regardless of mouse strain or the presence of the APP transgene, and levels remained elevated for at least 1 week after single-dose treatments.
Cerebral amyloidogenesis is increased after energy inhibition
Because BACE1 is the key rate-limiting enzyme for Aβ production, we next determined whether acute cerebral energy inhibition would also increase the level of proamyloidogenic processing of APP in Tg2576 mice. The level of APPsβ, the ectodomain produced after β-secretase cleavage of APP, reflects the amount of BACE1-induced processing of APP and parallels the level of Aβ (Hussain et al., 1999; Sinha et al., 1999; Vassar et al., 1999; Yan et al., 1999; Lin et al., 2000). Therefore, we measured APPsβ levels in the brains of treated mice by immunoblot analysis using a neoepitope antibody that recognizes the cleaved C terminus of APPsβ ending in the Swedish mutation [APPsβ(sw)] but that reacts only weakly with full-length APP (Seubert et al., 1993; Vassar et al., 1999; Cole et al., 2005). We found that energy inhibition caused APPsβ(sw) levels to increase by as much as ∼175% compared with vehicle controls after 4 h of recovery (Fig. 5A,B), indicating that treatment-induced BACE1 elevation led to a rise in β-secretase cleavage of APP in vivo. APPsβ(sw) levels continued to be elevated for 2 and 7 d after treatments (Fig. 5C-F), again demonstrating a long-lasting effect. Immunoblot analysis with anti-APP antibodies did not reveal a significant increase in full-length APP levels after energy inhibition (data not shown), excluding the possibility that an increase in APPsw transgene expression was responsible for the elevated APPsβ(sw) levels.
To determine whether the apparent increase in β-secretase cleavage of APP resulted in elevated Aβ levels, we measured cerebral Aβ40 in treated Tg2576 mice by Aβ40-specific sandwich ELISA. After 4 h and 2 d of recovery, Aβ40 levels showed a trend toward elevation for several of the treatments, although significant differences were not found by ANOVA (Fig. 6A,B). However, by 7 d of recovery, Tg2576 brains had dramatically elevated Aβ40 levels, rising to ∼200% of vehicle control values (Fig. 5C). Although we did not measure Aβ42, production of both Aβ40 and Aβ42 change proportionally in parallel after alterations in BACE1 activity (Sinha et al., 1999; Vassar et al., 1999; Yan et al., 1999); thus, it is likely that Aβ42 levels were also elevated in the brains of treated Tg2576 mice. Together, these results demonstrated that reduction of cerebral energy metabolism, although acute, produced a long-lasting elevation of both BACE1 and Aβ levels in the brain.
Discussion
Energy inhibition and amyloidogenic APP processing
In this study, single acute pharmacological treatments that inhibited energy production caused prolonged elevations in cerebral levels of BACE1 in both wild-type and Tg2576 mice and in levels of APPsβ and Aβ40 in Tg2576. Importantly, we used compounds that inhibited energy production by different mechanisms, yet all showed similar effects, indicating that reduced energy metabolism was likely to underlie the elevation in BACE1 and Aβ levels. The agents did not induce visible neurodegeneration or astrogliosis at the doses used, although we cannot exclude the possibility of less obvious alterations, such as the release of subtoxic levels of reactive oxygen species (ROS) or inflammatory cytokines.
Although the BACE1 elevations were modest (∼150% of control), they were long lasting (at least 7 d). We do not yet know the maximum duration that BACE1 levels remain high after acute energy inhibition. As expected, increases in the levels of the product, Aβ40, temporally followed those of the enzyme, BACE1. Importantly, at 7 d after treatment, Aβ40 levels reached ∼200% of control, thus exceeding the maximum percent increase for BACE1. Given the catalytic activity of BACE1, prolonged elevation of BACE1 levels could lead to large, cumulative increases of Aβ over time.
Recent reports have demonstrated that levels of BACE1 protein and activity are elevated in SAD (Fukumoto et al., 2002; Holsinger et al., 2002; Tyler et al., 2002; Yang et al., 2003; Li et al., 2004). In one study, Aβ load positively correlated with BACE1 level in SAD brain (Li et al., 2004), suggesting that BACE1 elevation may drive Aβ overproduction. Although these studies have clearly shown high BACE1 levels in SAD, they have not determined the underlying physiological processes that are involved in these effects. Here, our results strongly suggest that impaired cerebral energy production causes the BACE1 increase, which may, at least in part, be responsible for the Aβ elevation in SAD.
Unexpectedly, we observed a long lag period between the BACE1 and APPsβ elevation and the Aβ40 increase. The temporal relationship between β- and γ-secretase cleavage in neurons in vivo is not well understood, and we speculate that C99 intracellular trafficking to γ-secretase or the activity of γ-secretase may be limiting. Interestingly, recent work indicates that γ-secretase generation of Aβ may be ATP dependent (Netzer et al., 2003). If so, lower ATP levels resulting from energy inhibition could temporarily decrease γ-secretase cleavage of C99 to cause a lag in Aβ formation. Future experiments should allow the determination of which, if any, of these hypotheses is correct.

Acute energy inhibition increases BACE1 protein levels in the brains of C57/B6 mice. A-F, Two- to 3-month-old C57/B6 mice were given a single intraperitoneal injection of 18 U/kg insulin, 1 g/kg 2DG, 100 mg/kg 3NP, 30 mg/kg KA, or vehicle and were then allowed to recover for 4 h (A, B), 2 d (C, D) or 7 d (E, F). Brains were then isolated and homogenized, and samples (15μg/lane) were subjected to immunoblot analysis for BACE1 protein using anti-BACE1 antibody PA1-757. Blots were stripped and reprobed with anti-β-actin antibody as a loading control. A, C, E, Representative BACE1 (top panels) and β-actin (bottom panels) immunoblots for the various treatments and recovery times are shown. B, D, F, The intensities of BACE1 band signals were quantified on a PhosphorImager (Eastman Kodak), normalized against the β-actin immunosignals for each sample, and then expressed as percentages of the mean of the vehicle control for a given recovery time. Note that the energy-inhibitor treatments elevated cerebral BACE1 protein levels to ∼125-150% of vehicle control values for all recovery times (*p < 0.05, **p < 0.01, and ***p < 0.001, one-way ANOVA with Newman-Keuls multiple-comparison test). A-D, Data represent mean ± SEM; n = 9 mice/treatment (A, B), n = 5 mice/treatment (C, D), and n = 4 mice/treatment (E, F).
Recently, we performed preliminary energy inhibition experiments with APPsw-overexpressing 293 cells in vitro and observed increased amyloidogenic processing (our unpublished results). Similar to the results of Gabuzda et al. (1994), energy inhibition caused an increase in the levels of intracellular amyloidogenic APP fragments. In addition, we observed an increase of secreted Aβ levels during recovery from treatment. We did not determine whether Aβ levels were elevated intracellularly or extracellularly in our in vivo experiments (e.g., by measuring Aβ levels in CSF); however, our in vitro experiments imply that extracellular Aβ levels may have been increased during recovery after energy inhibition. Clearly, more work remains to determine the effects of energy inhibition and recovery on the temporal and spatial characteristics of Aβ production in vivo.

Acute energy inhibition increases BACE1 protein levels in the brains of Tg2576 mice. A-F, Two- to 3-month-old Tg2576 mice were injected with 18 U/kg insulin, 1 g/kg 2DG, 100 mg/kg 3NP, 30 mg/kg KA, or vehicle and were allowed to recover for 4 h (A, B), 2 d (C, D), or 7 d (E, f). A, C, E, Representative immunoblots of brain samples for BACE1 (top panels) and β-actin (bottom panels). B, D, F, BACE1 immunosignals were quantified, normalized against β-actin signals, and expressed as percentages of vehicle controls, as before. Similar to the effects observed in C57/B6 mice, energy-inhibitor treatments in Tg2576 mice caused cerebral BACE1 levels to increase to ∼125-150% of vehicle controls for all recovery times (*p < 0.05 and **p < 0.01, one-way ANOVA with Newman-Keuls multiple-comparison test). Data represent mean ± SEM; n = 6 mice/treatment (A, B), and n = 4 mice/treatment (C-F).
The cell type in which the persistent BACE1 increase occurs is also an important unanswered question. The absence of significant treatment-induced astrogliosis argues against a rise in astrocytic BACE1, although the possibility exists that the level of BACE1 expression per astrocyte may increase without gliosis or GFAP elevation. We did not perform anti-BACE1 immunohistochemistry because, in our experience, anti-BACE1 antibodies produce nonspecific staining of BACE1 knock-out brain sections (R. Vassar and J. Zhao, unpublished results). In future studies, the availability of anti-BACE1 antibodies that provide specific staining in immunohistochemistry will allow unambiguous identification of the cell type(s) in which the BACE1 increase occurs.
We predict that energy inhibition should exacerbate both the amyloid deposition and behavioral impairment that occurs in Tg2576 mice (Hsiao et al., 1996). Plaques form after ∼9-12 months in Tg2576; therefore, it is likely that periodic energy-inhibitor treatments spanning several months will be necessary to exacerbate amyloid deposition in this model. In addition, certain memory deficits in APP transgenic mice appear associated with soluble Aβ oligomers (Lambert et al., 1998; Hartley et al., 1999) rather than plaques (Holcomb et al., 1999; Dodart et al., 2002; Westerman et al., 2002; Ohno et al., 2004), and it will be important to investigate whether energy inhibition specifically elevates Aβ oligomers.
Although our work suggests that energy inhibition may increase Aβ production, at present, we cannot exclude the possibility that chronic energy insufficiency in SAD may decrease Aβ clearance or degradation, therefore allowing steadystate levels of Aβ to rise. It is conceivable that both the production and clearance limbs of the Aβ economy balance may be altered in SAD so that cerebral Aβ levels become elevated in an additive manner. Future studies aimed at examining Aβ turnover after energy-inhibitor treatments should determine the effects of energy failure on Aβ clearance.
Potential mechanisms underlying the persistent BACE1 increase
The mechanism of the energy-inhibition-induced BACE1 increase is unclear and will be challenging to elucidate. However, we speculate that translational control may be involved because (1) we do not observe a significant BACE1 mRNA increase after treatment; (2) BACE1 protein half-life is too long (8-16 h) (Haniu et al., 2000; Huse et al., 2000) to account for the rapid rise in BACE1 levels; and (3) recent studies show that the 5′ untranslated region (5′UTR) of BACE1 mRNA influences translational efficiency (De Pietri Tonelli et al., 2004; Lammich et al., 2004; Rogers et al., 2004). BACE1 mRNA contains a long, GC-rich 5′UTR with three upstream open reading frames (uORFs) that is similar to 5′UTRs that regulate the translation of certain growth factors, cytokines, hormone receptors, protein kinases, transcription factors, polyamine biosynthesis enzymes, and regulators of the cell cycle and apoptosis (for review, see Clemens and Bommer, 1999). Translational control via these 5′UTRs is not well understood; however, it appears that the GC-rich sequence confers secondary structure that inhibits cap-dependent translation, and the uORFs reduce the translation of the downstream ORF. Moreover, translational inhibition may be relieved in a variety of circumstances, including growth and development, specific cells and tissues, and cellular stresses. These conditions activate a number of signaling pathways, including the MAPK (mitogen-activated protein kinase), PKC, PI3 (phosphoinositide 3), and p38 kinase cascades. Downstream consequences of signaling include the phosphorylation of the translation initiation factor eIF4E and its binding protein 4E-BP1, which increases the rate of cap-dependent translation. Other processes may also occur, such as increased unwinding activity of 5′UTR secondary structure and activation of RNA-binding proteins that overcome uORF inhibition. Although it has not yet been demonstrated that energy deficiency increases translational efficiency via structured, uORF-containing 5′UTRs, the stress-activated p38 pathway has been shown to control translation through these 5′UTRs and is likely activated by energy metabolic stress. Therefore, we propose that energy insufficiency, perhaps through the p38 pathway, may elevate BACE1 mRNA translational efficiency via its 5′UTR. Clearly, much work remains to solve this important problem, but once it is fully understood, it may suggest novel therapeutic approaches for AD.
One issue with the hypothesis that energy insufficiency causes SAD is the lack of association between cerebral infarcts and amyloid pathology (Schneider et al., 2004; Honig et al., 2005). The reason for this is unclear, although we speculate that infarcts may result in neuronal death before increased Aβ production can occur, or that the time between successive infarcts may be sufficient for clearance of excess Aβ. Although macroscopic infarcts do not correlate with amyloidosis, recent studies have revealed an association between amyloid pathology and microinfarcts (Yip et al., 2005), some of which are found in brain regions that are prone to hypoperfusion (Suter et al., 2002). The correlation between amyloid, microinfarcts, and hypoperfusion is suggestive, because we favor the hypothesis that chronic hypoperfusion may establish long-term, sublethal energy insufficiency that causes sustained elevation of BACE1 and Aβ levels. This chronic hypoperfusion may be the result of atherosclerosis, which appears to be greater in AD cerebrovasculature (Roher et al., 2003).
The hypoperfusion-induced molecular signals that trigger the BACE1 increase may be similar to those involved in ischemiareperfusion injury, including ROS and inflammatory cytokines. Recent reports that oxidative stress elevates BACE1 levels in cultured neurons (Tamagno et al., 2002, 2003) support a potential role for ROS in the BACE1 increase in SAD. Similar mechanisms are likely to operate in diseases of other tissues, such as renal failure, in which chronic hypoperfusion of the kidney as a result of atherosclerosis appears to play a critical role, and oxidative stress and inflammation are important factors in progression (for review, see Textor, 2004). Testing the effects of models of hypoperfusion versus ischemia on BACE1 and Aβ levels in APP transgenic mice would allow evaluation of the respective roles of oxidative stress and inflammation in the persistent BACE1 increase.

Cerebral levels of APPsβ(sw) are elevated after acute inhibition of energy production in Tg2576 mice. Brain homogenates from Tg2576 mice treated with 18 U/kg insulin, 1 g/kg 2DG, 100 mg/kg 3NP, 30 mg/kg KA, or vehicle were subjected to immunoblot analysis using an antibody raised against the C-terminal neoepitope generated by BACE1 cleavage of APPsw, which recognizes APPsβ(sw) (Seubert et al., 1993; Vassar et al., 1999; Cole et al., 2005). A, C, E, Representative APPsβ(sw) (top panels) andβ-actin (bottom panels) immunoblots of brain samples from treated Tg2576 mice. Recovery times were for 4 h (A, B), 2 d (C, D) or 7 d (E, F). B, D, F, APPsβ(sw) immunosignals were normalized against β-actin signals and expressed as percentages of vehicle controls. Note that cerebral APPsβ(sw) levels were increased to ∼125-175% of vehicle controls after 4 h of recovery from energy inhibition (B), and they continued to be significantly elevated after 2 d (D) and 7 d (F) of recovery (*p < 0.05, **p < 0.01, and ***p < 0,001, one-way ANOVA with Newman-Keuls multiple-comparison test). Data represent mean ± SEM; n = 6 mice/treatment (A, B), and n = 4 mice/treatment (C-F).
AD brains show decreased cerebral blood flow (Barclay et al., 1984; de la Torre, 1999; Matsuda, 2001; Matsuda et al., 2002), and glucose metabolism is reduced in both preclinical and clinical AD (de Leon et al., 1983a,b; Cutler et al., 1985; Rapoport et al., 1991; Meier-Ruge et al., 1994; Reiman et al., 1996; Rapoport, 1999; Small et al., 2000; De Santis et al., 2001; Ibach et al., 2004; Mosconi et al., 2004; Mosconi, 2005), suggesting that impaired energy metabolism may be an early pathological event in SAD. Moreover, cardiovascular diseases appear to increase the risk of AD (Breteler, 2000; Shi et al., 2000; de la Torre, 2004) and the incidence of cerebrovascular atherosclerosis is higher in AD (Roher et al., 2003; Kalback et al., 2004). Thus, cerebral blood flow and the delivery of glucose and oxygen to the brain may become progressively impaired during aging in some individuals to cause BACE1 elevation, Aβ overproduction, and SAD pathogenesis. Reduced clearance and/or degradation of Aβ may also contribute to amyloid load in SAD.

Acute energy inhibition increases cerebral Aβ40 levels in Tg2576 mice. Brain homogenates from Tg2576 mice treated with 18 U/kg insulin, 1 g/kg 2DG, 100 mg/kg 3NP, 30 mg/kg KA, or vehicle were subjected to Aβ40-specific sandwich ELISA. Recovery times were for 4 h (A), 2 d (B), or 7 d (C). Aβ40 levels were expressed as picograms per milligram of total brain protein (determined by BCA assay). Note that brain Aβ40 levels showed a trend toward elevation for several of the treatments after 4 h and 2 d of recovery but did not reach significance. However, by 7 d of recovery, brain Aβ40 levels were increased approximately twofold by all treatments. Data represent mean ± SEM (**p < 0.01 and ***p < 0.001, one-way ANOVA with Newman-Keuls multiple-comparison test; n = 4 per treatment).
Physiological role of BACE1 elevation
The physiological role of BACE1 elevation after energy inhibition is not yet known, but we speculate that it may involve a response to injury or stress. Indeed, BACE1 levels increase after noxious stimuli, including oxidative stress (Tamagno et al., 2002, 2003; Tong et al., 2005), TBI (Blasko et al., 2004), ischemia (Wen et al., 2004), and AD (Fukumoto et al., 2002; Holsinger et al., 2002; Tyler et al., 2002; Yang et al., 2003; Li et al., 2004). Now, we add energy inhibition to the growing list of stressors that induce BACE1. We speculate that stress/injury-induced BACE1 elevation facilitates recovery after acute stress/injury and that cleavage of BACE1 substrates is necessary for this function. However, chronic stress/injury results in pathologic BACE1 levels and amyloid formation.
BACE1 substrates thus far identified include APP, APP-like proteins (APLPs) 1 and 2 (Eggert et al., 2004; Li and Sudhof, 2004; Pastorino et al., 2004), P-selectin glycoprotein ligand-1 (PSGL-1) (Lichtenthaler et al., 2003), α2,6-sialyltransferase (ST6Gal I) (Kitazume et al., 2001, 2003, 2005), voltage-gated sodium channel β-subunit (Wong et al., 2005), and low-density lipoprotein receptor-related protein (LRP) (von Arnim et al., 2005). Interestingly, evidence suggests that these BACE1 substrates may be involved in the responses to stress and/or injury, such as recovery from excitotoxicity (Aβ) (Kamenetz et al., 2003), Aβ clearance (LRP) (Hyman et al., 2000), synapse formation (APP, APLP1, and APLP2) (Herms et al., 2004; Wang et al., 2005), neuroprotection (secreted APP ectodomain) (Panegyres, 2001), and immune functions (PSGL-1 and ST6Gal I) (Kitazume et al., 2001; Lichtenthaler et al., 2003). It is essential to investigate the role of BACE1 elevation and substrate cleavage, because these processes likely affect the balance between health and disease.
Together, this evidence suggests that elevated BACE1 substrate processing may be beneficial during recovery after acute stresses/injuries. However, chronic stress/injury could cause long-term BACE1 elevation and have harmful effects attributable to cerebral Aβ overproduction. This is suggested by our observation that BACE1 and Aβ levels remain elevated for at least 1 week after a single episode of energy inhibition. If cerebral Aβ42 production overwhelms clearance/degradation mechanisms, Aβ42 levels will increase and likely trigger SAD, just as it does in FAD. Finally, knowledge of the molecular mechanisms of BACE1 elevation during SAD may facilitate the development of novel therapeutic strategies to prevent or treat this devastating neurodegenerative disorder.
Footnotes
This work was supported by Northwestern University start-up funds (to R.V.). R.A.V. is a postdoctoral fellow and is supported by a training grant from the Center for Drug Discovery and the Chemical Biology Training Grant; T.O. is a graduate student in the Northwestern University Integrated Graduate Program and is supported by the Mechanisms of Aging and Dementia Training Grant. We thank Holly Oakley and Erika Maus for mouse colony maintenance and the Vassar laboratory for helpful advice and discussions. BACE1-/- mice used as negative controls were a gift from Amgen (Thousand Oaks, CA).
Correspondence should be addressed to Dr. Robert Vassar, Department of Cell and Molecular Biology, Northwestern University, The Feinberg School of Medicine, 303 East Chicago Avenue, Chicago, IL 60611. E-mail: r-vassar{at}northwestern.edu.
Copyright © 2005 Society for Neuroscience 0270-6474/05/2510874-10$15.00/0


