

Abstract
Previous studies indicate that boutons from the same axon exhibit distinct Ca2+ dynamics depending on the postsynaptic targets. Mossy fibers of hippocampal granule cells innervate synaptic targets via morphologically distinct boutons. We investigated mitochondrial involvement in the generation of post-tetanic residual Ca2+ (Cares) at large and small en passant mossy fiber boutons (MFBs). Mitochondria limited the [Ca2+]i build-up during high-frequency stimulation (HFS) at large MFBs, but not at small MFBs. The amount of Cares, quantified as a time integral of residual [Ca2+]i, was significantly larger at large MFBs than at small MFBs, and that at large MFBs was substantially attenuated by inhibitors of mitochondrial Ca2+ uniporter and mitochondrial Na+/Ca2+ exchanger (mitoNCX). In contrast, blockers of mitoNCX had no effect on the Cares at small MFBs. Post-tetanic Cares has been proposed as a mechanism for post-tetanic potentiation (PTP). We examined mitochondrial involvement in PTP at mossy fiber synapses on hilar mossy cells (MF→MC synapse) and on hilar interneurons (MF→HI synapse), which are presumably innervated via large and small MFBs, respectively. Consistent with the differential contribution of mitochondria to Cares at large and small MFBs, mitoNCX blockers significantly reduced the PTP at the MF→MC synapse, but not at the MF→HI synapse. In contrast, protein kinase C (PKC) inhibitors significantly reduced the PTP at MF→HI synapse, but not at the MF→MC synapse. These results indicate that mitochondria- and PKC-dependent PTP are expressed at distinct hilar mossy fiber synapses depending on postsynaptic targets.
- post-tetanic potentiation
- residual calcium
- mitochondria
- hippocampal mossy fiber
- hilar mossy cell
- hilar interneuron
Introduction
Short-term plasticity is supposed to play a crucial role in synaptic computation (Abbott and Regehr, 2004). The hippocampal mossy fiber (MF) synapse exhibits high failure rate at resting firing frequency of granule cells (GCs), but high frequency stimulation (HFS) can induce a plastic change with wide dynamic range (Salin et al., 1996; Mori et al., 2007). Previous studies indicate that presynaptic facilitation is prerequisite for reliable transmission at MF synapse, and now MF synapses are regarded as “conditional detonator” (Henze et al., 2002; Mori et al., 2004; Bischofberger et al., 2006). Computational events occurring at MF synapses could be better understood in light of knowledge about presynaptic mechanisms underlying short-term enhancement of MF synaptic activity such as frequency facilitation and post-tetanic potentiation (PTP).
A post-tetanic elevation of presynaptic [Ca2+]i lasting for tens of seconds, referred to as post-tetanic residual Ca2+ (Cares), has long been suggested as a mechanism for PTP. Close correlation between PTP and Cares has been demonstrated at numerous synapses including neuromuscular junctions (NMJs) and MF synapses (Kamiya and Zucker, 1994; Regehr et al., 1994; Habets and Borst, 2005; Korogod et al., 2005) (for review, see Zucker and Regehr, 2002). Although mitochondrial contribution to generation of Cares and PTP has been demonstrated at NMJs (Tang and Zucker, 1997; Garcia-Chacon et al., 2006), there is little evidence for mitochondrial involvement at central synapses (Storozhuk et al., 2005). Instead, activation of protein kinase has been proposed as underlying mechanisms for PTP in hippocampus and cerebellum, suggesting that PTP mechanism at central synapses may be different from that at NMJs (Alle et al., 2001; Brager et al., 2003; Beierlein et al., 2007; Wierda et al., 2007).
The evidence accumulated over the last decade supports the view that short-term plasticity from the same axon is different according to the identity of postsynaptic target (for review, see Toth and McBain, 2000). At neocortical and MF synapses it has been suggested that target-cell specific presynaptic Ca2+ dynamics underlies the heterogeneity in the release probability and long-term plasticity (Rozov et al., 2001; Koester and Johnston, 2005; Pelkey et al., 2006). Dentate GCs have more than one type axon terminals, each with a distinct morphology depending on the postsynaptic target (Acsady et al., 1998), but target cell-specific differences in the Ca2+ dynamics at different type of hippocampal mossy fiber boutons (MFBs) have not been studied.
We investigated Ca2+ transients induced by HFS from single MFBs and compared the mitochondrial involvement in the generation of Cares between large and small MFBs, which presumably terminate onto hilar mossy cells and interneurons, respectively. We found that Na+-dependent Ca2+ efflux (NCE) from presynaptic mitochondria contributes to Cares specifically at large but not small MFBs. In agreement with our observations of presynaptic Ca2+ signals, mitochondrial NCE inhibitors reduced PTP selectively at MF synapses onto hilar mossy cells, indicating that mitochondria-dependent Cares is responsible for PTP specifically at synapse of large MFBs. In contrast, protein kinase C (PKC) inhibitors reduced PTP exclusively at MF synapses onto hilar interneurons (HIs).
Materials and Methods
Preparation of brain slices.
Transverse hippocampal brain slices were prepared from 18- to 28-d-old Sprague Dawley rats as described previously (Lee et al., 2004) under the animal welfare guideline of Seoul National University. Rats were anesthetized with isoflurane and decapitated. Brains were chilled in ice-cold low-calcium artificial CSF (aCSF) containing the following (in mm): 124 NaCl, 26 NaHCO3, 3.2 KCl, 0.5 CaCl2, 7 MgCl2, 1.25 NaH2PO4, 10 glucose, 2 Na-pyruvate, 3 ascorbate, with pH 7.4 adjusted by saturating with carbogen (95% O2, 5% CO2), and with an osmolarity of ∼320 mOsm. Isolated brain was glued onto the stage of a vibratome (ZERO 1; Dosaka, Kyoto, Japan), and 300-μm-thick transverse hippocampal slices were cut and incubated at 34°C for 30 min in the same solution and thereafter maintained at room temperature until required.
Drugs.
All chemicals were obtained from Sigma (St. Louis, MO), except Ru360 and Ro-31-8220 from Calbiochem (La Jolla, CA), (2S, 1′R, 2′R, 3′R)-2-(2′,3′-dicarboxycyclopropyl) glycine (DCG-IV) and CGP37157 from Tocris (Ellisville, MO), and fluorescent dyes from Invitrogen (Eugene, OR). All inhibitor drugs including tetraphenylphosphonium (TPP+) and PKC inhibitors were prepared as concentrated stock (1000×) in distilled water, except carbonylcyanide m-chlorophenylhydrazone (CCCP) and CGP37157 in DMSO, and antimycin A1 and oligomycin in ethanol. Stock solutions were stored at −20°C, and diluted to desired concentration in aCSF just before use.
Electrophysiological recordings.
For Ca2+ imaging at MFBs, whole-cell patch-clamp mode was attained on the soma of a GC under visual control using differential interference illumination in an upright microscope (BX51WI; Olympus, Tokyo, Japan) while perfusing a slice with normal aCSF (the composition is the same as low-calcium aCSF except 1.3 mm MgCl2,2.5 mm CaCl2 and without pyruvate and ascorbate). The whole-cell recordings were made using an EPC-10 amplifier (HEKA Elektronik, Lambrecht, Germany) with a pipette solution containing the following (in mm): 140 K-gluconate, 5 di-Tris-phosphocreatin, 5 NaCl, 4 MgATP, 0.4 Na2GTP, 15 HEPES, 2.5 Na-pyruvate at pH 7.3 (adjusted with KOH) together with Oregon Green 488 BAPTA-1 (OGB1) and/or Oregon Green 488 BAPTA-5N (OG5N). In most experiments, 50 μm OGB1 was used unless specified. When OG5N alone was used as a Ca2+-indicator dye, 20 μm Alexa Fluor 633 hydrazide was added to visualize and trace the axon fibers. Action potentials (APs) were evoked by applying depolarizing pulses from −80 to 0 mV in a voltage-clamp mode.
For recordings of EPSC at MF synapses, whole-cell recordings were made from hilar neurons at a holding potential of −70 mV. Patch pipettes (2–4 MΩ) were filled with an internal solution containing the following (in mm): 120 K-gluconate, 6 KCl, 5 di-Tris-phosphocreatin, 4 MgATP, 0.4 Na2GTP, 15 HEPES, 10 BAPTA at pH 7.3 (adjusted with KOH). To obtain the images of dendritic morphology, 20 μm Alexa633 or Alexa488 was included in the pipette solution. Synaptic responses were evoked by extracellular stimulation techniques (100 μs duration; 2–25 V intensity) via a voltage stimulator (MASTER-8; AMPI, Jerusalem, Israel) connected to a patch electrode filled with aCSF solution, and placed near the hilar border (Lysetskiy et al., 2005). EPSCs were evoked by applying paired pulses (50 ms interval) at 0.2 Hz for 3–15 min and then HFS (25 Hz, 5 s) was applied. Changes in EPSC amplitude were monitored for another 5–10 min.
To monitor series resistance, negative voltage steps (−2 mV from holding potential, 50 ms) were applied after each evoked EPSC and the recordings were discarded whether the series resistance changed by >20%. At the end of each experiment, 1 or 2 μm DCG-IV was bath-applied to confirm the mossy fiber stimulation. The EPSC data were included in the analysis only when the average EPSCs were reduced by at least 80% by DCG-IV. After each experiment dendritic images of hilar neurons were taken under a confocal microscope. All experiments were done at 32 ± 2°C.
Cytosolic Ca2+ measurements.
Ca2+ imaging was performed using a confocal laser-scanning system (FV300; Olympus) and a 60× water-immersion objective (numerical aperture, 0.9; LUMPlanFl/IR; Olympus). After establishing a whole-cell recording mode, a Ca2+- indicator dye was allowed to be loaded for at least 25 min, which provides enough time for the dye in the GC soma to be equilibrated with its axon terminals, located in the range of 100–400 μm from the soma. Ca2+ transients (CaTs) evoked by a single AP were recorded in a line scan mode at 200 Hz. Fluorescence responses evoked by a HFS were imaged by scanning a small region of interest (ROI) including a bouton in XY scan mode at 1 Hz for 100 s for recording Cares with OGB1. Scanning time per image was <0.2 s. For imaging a CaT during HFS with OG5N, we scanned an ROI at 2 Hz for 15 s. To minimize photo-bleaching, minimal intensity of the laser power (< 2.5 μW for 488 nm Ar laser, < 2 μW for 633 nm He/Ne laser measured under the objective) and maximal pinhole size (300 μm) were used. Emission light was separated by a 630 nm dichroic mirror and passed 545/75 and 675/50 bandpass filters ahead of detection by photomultiplier tubes for green and red fluorescence.
In the experiments using OGB1 [Ca2+]i was calculated from background-subtracted fluorescence (F) as follows:
 where R
f = F
max/F
min, and F
max value was measured in situ during experiment from a plateau value in the fluorescence induced by HFS (Maravall et al., 2000). All the estimates of [Ca2+] were presented as a difference between excursion of [Ca2+] from its resting level (Δ[Ca2+]i). The upper bound of dynamic range (R
f) and the dissociation constant (K
d) of OGB1 were determined in vitro using intracellular solution plus 10 mm Ca2+ or 10 mm EGTA (for R
f of OGB1) and that plus 4 mm K+-EGTA and 6 mm Ca2+-EGTA, [Ca2+] of which was calculated as 231 nm (for Kd of OGB1; assuming the K
d of EGTA = 95 nm at pH = 7.3). The K
d and the upper bound value of R
f were estimated as 206 nm and 8.5, respectively, which are very close to the values reported by others (Maravall et al., 2000). R
f cannot be accurately determined in cytosolic environment. To determine approximate value for R
f in the cell, we whole-cell patched seven pairs of dentate GCs of similar size located at the surface of the slice with the same solutions used for in vitro calibration, and measured F
min and F
max from the cytosol of different cells. The mean value for R
f was estimated as 5.9 (in the range of 4.6 ∼ 6.7). In the following analysis, we assumed R
f to be 6 (Sabatini et al., 2002). When R
f is in-between 6 and 8, the uncertainty in R
f can cause errors in estimating integral of Cares by <5% (Maravall et al., 2000). In addition to R
f, erroneous estimation of Fmax and/or incorrect assumption of K
d values of the Ca2+ indicator dye in the cytosol can cause much larger error for Δ[Ca2+] estimates (Maravall et al., 2000). In experiments using OG5N, [Ca2+]i was estimated by assuming resting [Ca2+]i of 50 nm. K
d of OG5N was taken as 50 μm and R
f was taken as 50 (David et al., 1997). Because we used very low intensity of laser power for long-term scanning, a few pixels having zero value at the baseline were included in the case that bouton was located deeper than 30 μm. In most of experiments, we scanned boutons near the surface of a slice to minimize the calculation error.
where R
f = F
max/F
min, and F
max value was measured in situ during experiment from a plateau value in the fluorescence induced by HFS (Maravall et al., 2000). All the estimates of [Ca2+] were presented as a difference between excursion of [Ca2+] from its resting level (Δ[Ca2+]i). The upper bound of dynamic range (R
f) and the dissociation constant (K
d) of OGB1 were determined in vitro using intracellular solution plus 10 mm Ca2+ or 10 mm EGTA (for R
f of OGB1) and that plus 4 mm K+-EGTA and 6 mm Ca2+-EGTA, [Ca2+] of which was calculated as 231 nm (for Kd of OGB1; assuming the K
d of EGTA = 95 nm at pH = 7.3). The K
d and the upper bound value of R
f were estimated as 206 nm and 8.5, respectively, which are very close to the values reported by others (Maravall et al., 2000). R
f cannot be accurately determined in cytosolic environment. To determine approximate value for R
f in the cell, we whole-cell patched seven pairs of dentate GCs of similar size located at the surface of the slice with the same solutions used for in vitro calibration, and measured F
min and F
max from the cytosol of different cells. The mean value for R
f was estimated as 5.9 (in the range of 4.6 ∼ 6.7). In the following analysis, we assumed R
f to be 6 (Sabatini et al., 2002). When R
f is in-between 6 and 8, the uncertainty in R
f can cause errors in estimating integral of Cares by <5% (Maravall et al., 2000). In addition to R
f, erroneous estimation of Fmax and/or incorrect assumption of K
d values of the Ca2+ indicator dye in the cytosol can cause much larger error for Δ[Ca2+] estimates (Maravall et al., 2000). In experiments using OG5N, [Ca2+]i was estimated by assuming resting [Ca2+]i of 50 nm. K
d of OG5N was taken as 50 μm and R
f was taken as 50 (David et al., 1997). Because we used very low intensity of laser power for long-term scanning, a few pixels having zero value at the baseline were included in the case that bouton was located deeper than 30 μm. In most of experiments, we scanned boutons near the surface of a slice to minimize the calculation error.
Calculation of mitochondrial Ca2+ release.
Although the decay phase of a single AP-induced Ca2+-transient was better fitted with a biexponential function than a monoexponential function by 14% (the ratio of χ2 values for monoexponential and biexponential fits was 1.14 ± 0.2, n = 13), we assumed that (1) an MFB is a single compartment and (2) Ca2+ extrusion rate is linear to Δ[Ca2+] for mathematical simplicity. Under these assumptions, the time-derivative of the time-dependent change in Δ[Ca2+]i, y(t), is a balance between Ca2+ influx, j(t), and Ca2+ clearance, so that
 where Σκ represents the sum of the Ca2+ binding ratios of all Ca2+ buffers in the cell and γ is a Ca2+ extrusion rate constant (Neher and Augustine, 1992; Lee et al., 2000; Kim et al., 2003). Rearrangement of equation 2 yields the following:
 The same relationship can be obtained by deconvolution of y(t) with an impulse response of the linear system, which can be reasonably obtained from a single AP-induced Ca2+ transient (see Appendix). Note that γ represents the sum of activities of all the Ca2+ clearance mechanisms including the Ca2+ transporters in the plasma membrane and in intracellular organelles, which drive Δ[Ca2+]i back to zero. The CaT evoked by a single AP at t = 0, which induces an impulse-like Ca2+ influx, is a special case where j(t) = 0 during its decay phase. When Ca2+ extrusion and Ca2+ release from internal stores occur simultaneously, the Ca2+ release from internal stores can be calculated from y(t) and γ using equation 3. Note that both Ca2+ influx through the plasma membrane and Ca2+ release from intracellular organelles can contribute to j(t) with the same sign. Because we are interested in j(t) during a post-tetanic period, Ca2+ release rather than Ca2+ influx is assumed to constitute j(t). Thus, we refer to j(t) as “Ca2+ release” in the present study.
Data analysis.
Data were analyzed using IgorPro (version 4.1; WaveMetrics, Lake Oswego, OR). Statistical data are expressed as mean ± SEM, and n indicates the number of cells studied. The significance of differences between two experimental conditions was evaluated using paired or nonpaired Student's t test using a significance level of 0.05.
Results
We investigated the CaTs evoked by HFS at the MFBs of hippocampal dentate GCs loaded via a patch pipette with an internal solution containing 50 μm OGB1. ∼5 min after the patch break-in, the mossy fiber, an axon of a dentate GC, became visible under the confocal microscope, and we could follow the mossy fiber up to ∼ 400 μm (Fig. 1 A). The MFBs with a cross-sectional area larger than 5 μm2 were distinct from the smaller MFBs with regard to the time integral of Cares (Fig. 2 D). Thus, we chose 5 μm2 as the criterion for dividing MFBs into large MFBs and small en passant MFBs. The large MFBs, ranging in the cross-sectional area from 5.27 μm2 to 18.46 μm2 (8.50 ± 0.34 μm2 in average, n = 61), were irregularly shaped, and some of them had filopodial extensions and/or a region with a rarefaction of fluorescence within the bouton, probably indicative of an area in contact with postsynaptic thorny excrescence or large pool of synaptic vesicles (Hallermann et al., 2003) (Fig. 2 A, inset). In contrast, the small MFBs were oval-shaped with cross-sectional area ranging from 1.24 to 4.67 μm2 (2.63 ± 0.15 μm2; n = 38) and had neither rarefaction of fluorescence nor filopodia (Fig. 2 B, inset).

A representative time course of post-tetanic residual [Ca2+] (Δ[Ca2+]res) at the large MFB. A , A z-stack projection of laser-scanned images obtained from a dentate GC loaded with 50 μm OGB1 via a whole-cell patch pipette on the soma. The fluorescence image shows axon collaterals and MFBs. The boxed area is shown at higher magnification in the inset. B , Ca2+ transients were evoked by TS (33 Hz for 5 s). Background-subtracted fluorescence in a region of interest encompassing an MFB was averaged, converted into [Ca2+]i and plotted as a function of time. Red and blue lines indicate the time courses of [Ca2+]i recorded before and after application of 2 μm TPP+, respectively (same traces used in Fig. 5 Aa). Raw images numbered from 1 to 4 correspond to the indicated time points on the red trace. The part of the TS-CaTs indicated by the horizontal bar is shown on expanded time scale (inset, thick lines), on which single AP-CaTs obtained from the same MFB are superimposed (noisy traces; red, in control conditions; blue, in the presence of TPP+). To compare areas under the AP-CaT and Δ[Ca2+]res, a monoexponential fit (τ −1 = 386 ms) to the AP-CaTs was superimposed on B , with the AP-CaT peak aligned at t = 0 (arrowhead). The vertical dotted line indicates the time point at t = 0. C , AP-CaTs were evoked before and after TS (33 Hz for 5 s). The bouton image and line scan images at the indicated time points are shown (top). The white line (5 μm) in the bouton image represents a scan line. Background-subtracted fluorescence (ΔF) transients evoked by single APs were converted to Ca2+ transients (CaTs), and superimposed (red, 10 s before TS; green, 5 s after TS; blue, 15 s after TS). The horizontal dotted line indicates the zero Δ[Ca2+]i level. D , Decay time constants of these AP-CaTs were plotted as a function of whole-cell recording time (open triangles). The time at the end of TS was set as t = 0. Time constants obtained from other two MFBs were superimposed with different markers.

Differences in the amount of post-tetanic Cares between large MFBs and small en passant MFBs. A , B , Three superimposed CaTs were evoked by HFS comprised of 33, 99, or 165 APs at 33 Hz. The fluorescence of an MFB in each image was spatially averaged, and converted into [Ca2+]. Insets, Laser-scanned fluorescence images of the large MFB and the small en passant MFB, respectively. C , Plot of values for time integral of post-tetanic Δ[Ca2+]res (∫Cares dt) as a function of the duration of HFS (at 33 Hz). Open circles, large MFBs (n = 5); filled circles, small en passant MFBs (n = 5). Error bars indicate SEM. *p < 0.05. D , Values for ∫Cares dt were measured from CaTs evoked by HFS (33 Hz for 5 s) at large MFBs (open squares; n = 13) and at small en passant MFBs (filled squares; n = 16). The ∫Cares dt value was plotted as a function of cross-sectional area of the MFBs. The vertical dotted line represents an arbitrary border that categorizes boutons into large and small MFBs. E , The dependence of ∫Cares dt on the amplitude of AP-CaT. Different lines were fitted to the grouped data of large MFBs and to those of small en passant MFBs. F , Values for τ −1 of AP-CaT at large and small MFBs (large MFBs, 3.6 ± 0.2 s−1, n = 13; small MFBs: 3.8 ± 0.3 s−1, n = 16).
Validity of the linear relationship between the total amount of post-tetanic calcium release and ∫Caresdt
At large MFBs, the fast decay phase of a tetanic stimulation (TS)-induced CaT (TS-CaT) was followed by a period of elevated [Ca2+]i for tens of seconds after cessation of the HFS (Fig. 1 B). At 2 s after cessation of HFS (33 Hz for 5 s), the Ca2+ decay phase became distinctly slower (decay time constant, 30 ± 2 s, n = 13; referred to as a slow decay phase) in comparison with the preceding fast-decay phase (Fig. 1 B). Henceforth, we define the post-tetanic Δ[Ca2+]res as Δ[Ca2+] during the slow decay phase after 2 s after the end of HFS, which is set as t = 0 in the following analysis.
The decay rate of a single AP-induced CaT (AP-CaT) during the slow decay phase (Fig. 1
C, green and blue traces) was not different from that before HFS (Fig. 1
C, red trace, summarized in D). From this observation, we inferred that the slow-decay phase was generated by continuing Ca2+ influx or release from internal stores after the HFS rather than by a decrease of Ca2+ clearance. We can calculate the time course of Ca2+ release from internal store [denoted by j(t)] during the slow-decay phase according to equation 3, where the time course of Δ[Ca2+]res is denoted by y(t). When HFS at 33 Hz was applied for 5 s, the Δ[Ca2+]i measured at t = 0 [y(0)] was 235 ± 24 nm (n = 13). The sum of Ca2+ binding ratios (denoted by Σκ) was assumed to be constant within the dynamic range of y(t). This together with no significant change in the decay rate constant (τ
−1) of AP-CaTs imply that Ca2+ clearance (γ) is largely constant during the slow decay phase (Eq. A3). When Σκ and γ are constant, the time integral of j(t) from t = 0 to infinity yields [denoted by J(∞)] (see Appendix):
 indicating that J(∞)/γ is the difference between the time integral of Δ[Ca2+]res (denoted by ∫Cares
dt) and that of a single AP-CaT (or an impulse response; denoted by Aτ) with initial amplitude of y(0). To evaluate the magnitudes of the two terms in equation 4, we compared the ∫Cares
dt with the Aτ at the same MFB. Figure 1
B demonstrates that the area under the AP-CaT is negligible compared with that under the TS-CaT [Incidentally, the amplitude of the AP-CaT in Figure 1
B was similar to y(0).] The mean time constant of AP-CaTs (τ) in the presence of internal 50 μm OGB1 was 290 ± 14 ms (n = 13). When HFS at 33 Hz was applied for 5 s, the estimates for ∫Cares
dt were 6.4 ± 0.7 μm · s (n = 13) and 2.3 ± 0.2 μm · s (n = 16) at large and small MFBs, respectively. The Aτ was calculated to be 0.066 ± 0.007 μm · s (n = 13) at large MFBs and 0.034 ± 0.003 μm · s (n = 16) at small MFBs, which are smaller than the second term by factors of ∼100 and 70 at large and small MFBs, respectively. Therefore, we can approximate J(t) as follows:
indicating that J(∞)/γ is the difference between the time integral of Δ[Ca2+]res (denoted by ∫Cares
dt) and that of a single AP-CaT (or an impulse response; denoted by Aτ) with initial amplitude of y(0). To evaluate the magnitudes of the two terms in equation 4, we compared the ∫Cares
dt with the Aτ at the same MFB. Figure 1
B demonstrates that the area under the AP-CaT is negligible compared with that under the TS-CaT [Incidentally, the amplitude of the AP-CaT in Figure 1
B was similar to y(0).] The mean time constant of AP-CaTs (τ) in the presence of internal 50 μm OGB1 was 290 ± 14 ms (n = 13). When HFS at 33 Hz was applied for 5 s, the estimates for ∫Cares
dt were 6.4 ± 0.7 μm · s (n = 13) and 2.3 ± 0.2 μm · s (n = 16) at large and small MFBs, respectively. The Aτ was calculated to be 0.066 ± 0.007 μm · s (n = 13) at large MFBs and 0.034 ± 0.003 μm · s (n = 16) at small MFBs, which are smaller than the second term by factors of ∼100 and 70 at large and small MFBs, respectively. Therefore, we can approximate J(t) as follows:
 The above equation indicates that the amount of total Ca2+ release during a post-tetanic slow-decay phase [J(∞) or J
tot] is linear with regard to ∫Cares
dt with a proportionality factor, γ. Therefore, in the following analysis, we quantified the effect of a drug, X, on Cares at an MFB as the ratio of J
tot measured at the same bouton before and after the drug treatment, after confirming that X does not alter AP-CaTs (see Fig. 5
Ac).
The above equation indicates that the amount of total Ca2+ release during a post-tetanic slow-decay phase [J(∞) or J
tot] is linear with regard to ∫Cares
dt with a proportionality factor, γ. Therefore, in the following analysis, we quantified the effect of a drug, X, on Cares at an MFB as the ratio of J
tot measured at the same bouton before and after the drug treatment, after confirming that X does not alter AP-CaTs (see Fig. 5
Ac).
Dependence of Cares on the strength of the HFS
We tested whether the amount of Cares (quantified as ∫Cares dt) was dependent on the number of APs evoked during the HFS. When the stimulation frequency was fixed at 33 Hz, a greater number of APs (33, 99, and 165 APs) resulted in a larger amount of Cares at the same MFB (Fig. 2 A,B). The dependence of ∫Cares dt on the duration of HFS at large MFBs was steeper compared with that at small MFBs (Fig. 2 C). When the HFS duration was 3 or 5 s, the amount of Cares at the large MFBs was significantly higher than that at the small MFBs (n = 5 for each type of MFB; p < 0.05).
To assess the dependence of ∫Cares dt on the size of the MFB, the same HFS (33 Hz, 5 s) was applied to MFBs of various sizes, and the values for ∫Cares dt were plotted as a function of the bouton area (Fig. 2 D), showing that the value for ∫Cares dt is clearly greater at large MFBs (bouton area, > 6.2 μm2; open squares) than at small MFBs (bouton area, < 4.4 μm2; filled squares). However, no clear correlation between ∫Cares dt and bouton area was found within each group. To test whether the lower ∫Cares dt at small MFB resulted from a lower Ca2+-increment induced by a single AP, the values for ∫Cares dt were plotted as a function of the peak amplitude of AP-CaTs (Δ[Ca2+]AP) (Fig. 2 E). We found no difference in Δ[Ca2+]AP between two types of MFB (207 ± 20 and 188 ± 21 nm for large and small MFBs, respectively; p = 0.52). Therefore, the lower ∫Cares dt value at small MFBs may have resulted from the smaller amount of post-tetanic Ca2+ release into the cytosol (J tot), a high Ca2+ extrusion rate (γ), or both (Eq. 5). To differentiate these possibilities, mean values for decay rate constant (τ −1) of AP-CaTs at large and small MFBs were compared. Figure 2 F shows that τ −1 at large MFBs (3.6 ± 0.2 s−1; n = 13) was not different from that of small MFBs (3.8 ± 0.3 s−1; n = 16; p = 0.47), indicating that Ca2+ extrusion rate (γ) at the two types of MFBs may be similar under the assumption that Σk is not different at both type of boutons. This result suggests that the lower ∫Cares dt at the small MFBs can be largely attributed to lower J tot. It is noteworthy that no correlation was observed between ∫Cares dt and Δ[Ca2+]AP at small MFBs, whereas ∫Cares dt was largely proportional to Δ[Ca2+]AP at large MFBs (Fig. 2 E).
Differential contribution of mitochondria to Ca2+ buffering during HFS at large and small MFBs
Mitochondria have been suggested as a Ca2+ sequestration mechanism at the axon terminals of many synapses (Tang and Zucker, 1997; David et al., 1998; David and Barrett, 2000; Billups and Forsythe, 2002; Suzuki et al., 2002; Kim et al., 2005; Garcia-Chacon et al., 2006). To test whether presynaptic mitochondria sequester cytosolic Ca2+ during HFS, we studied the effects of mitochondrial inhibitors on the build-up of [Ca2+]i during HFS measured with a low-affinity Ca2+-indicator dye, OG5N (200 μm). At the large MFB, HFS at 20∼33 Hz for 5 s triggered an initial rapid increase in [Ca2+]i followed by a slowly rising or plateau phase, reaching a peak [Ca2+]i level of ∼1 μm (Fig. 3 Aa,Ab, black traces). Dissipation of the mitochondrial membrane potential (ΔΨm) using 1 μm CCCP (Fig. 3 Aa) or 2 μm antimycin A1 (Fig. 3 Ab) together with 1 μm oligomycin, augmented the peak Δ[Ca2+]i amplitude by approximately twofold (gray traces), indicating that mitochondrial Ca2+ uptake contributes to limiting the HFS-induced increase in presynaptic [Ca2+]i. In contrast, at small MFBs, the application of CCCP had little effects on the [Ca2+]i build-up during HFS (Fig. 3 B). We measured the peak Δ[Ca2+]i of TS-CaTs before and after the treatment of each drug at the same bouton, and quantified the effect of a drug as the ratio of the two peak Δ[Ca2+]i values (Fig. 3 C). These results suggest that mitochondria buffer the presynaptic Ca2+ build-up during HFS by taking up Ca2+ at large MFBs, but not at small MFBs.

Mitochondrial buffering of the [Ca2+] build-up during HFS. OG5N (200 μm) was included in the pipette solution to monitor CaTs during HFS (20∼33 Hz, 5 s). Aa , The two superimposed CaTs were recorded at the same large MFB before (black line) and after application of 1 μm CCCP + 1 μm oligomycin (gray line). Ab , Similar experiments were done using 2 μm antimycin A1 (AA1) + 1 μm oligomycin at the large MFB. B , At small en passant MFBs, CaTs were evoked by HFS (33 Hz for 5 s) under the control conditions (black line) and in the presence of 1 μm CCCP + 1 μm oligomycin (gray line). C , Mean values for the ratios of the peak Δ[Ca2+] of HFS-induced CaTs in the presence of mitochondrial uncoupler with respect to that in control conditions measured at the same MFBs. Gray and white bars represent large and small MFBs, respectively. **p < 0.01.
Dependence of Cares on mitochondrial Ca2+ uptake via the Ca2+ uniporter during HFS at large MFBs
Mitochondrial Ca2+ uptake occurs via the mitochondrial Ca2+ uniporter located in the mitochondrial inner membrane (Bernardi, 1999). To elucidate whether mitochondrial Ca2+ uniporter is responsible for Ca2+-uptake during HFS, we studied the effects of Ru360 (60 μm in the patch pipette together with 200 μm OG5N), a specific blocker of mitochondrial Ca2+ uniporter, on the Ca2+-buildup during HFS at 33 Hz for 1, 3 or 5 s (Fig. 4 A). When the duration of HFS was 1 s, Ru360 did not affect the mean peak [Ca2+]i values of the CaTs both at large and small MFBs. At the HFS duration of 3 or 5 s, however, Ru360 significantly augmented the mean peak values of CaTs at the large MFBs, but not at the small MFBs. These results suggest that Ca2+ uniporter is responsible for Ca2+ uptake into mitochondria during HFS at large MFBs, but not at small MFBs. Moreover, both dependence of ∫Cares dt and that of Ru360-induced augmentation of the Ca2+-peak on the duration of HFS were steeper at large MFBs than at small MFBs, implying that mitochondrial Ca2+-uptake is closely associated with the generation of Cares (Figs. 2 C, 4 A).

Role of mitochondrial Ca2+ uniporter in limiting Ca2+ buildup during HFS and in the generation of Cares at large MFBs. A , CaTs at large MFBs ( Aa ; n = 5 for control and n = 7 for Ru360) and those at small MFBs ( Ab ; n = 7 for control and n = 9 for Ru360) induced by HFS (33 Hz) for 1, 3, and 5 s were monitored without (left) or with (center) 60 μm Ru360, a blocker of mitochondrial uniporter, in the pipette solution. Peak values of the CaTs were normalized relative to that for 1 s and then mean values for peak [Ca2+]i were plotted against the duration of HFS (right). Ba , Bb , Representative CaTs recorded at large MFBs evoked by HFS (33 Hz for 5 s). CaTs were recorded with 10 μm ruthenium red ( a ) or 30 μm Ru360 ( b ) included in the pipette solution. Bc , Mean values for ∫Cares dt in control conditions (6.4 ± 0.7 μm · s; n = 13) and in the intracellular presence of ruthenium red (RRi, 2.0 ± 0.5 μm · s; n = 3) or Ru360 (Ru360i, 1.9 ± 0.1 μm · s; n = 3). Bd , Dependence of ∫Cares dt values under control conditions (open circles) and in the intracellular presence of ruthenium red (filled squares) or Ru360 (filled triangles) on the amplitude of AP-CaT (Δ[Ca2+]AP). Note no dependence of ∫Cares dt on Δ[Ca2+]AP in the presence of ruthenium red or Ru360. *p < 0.02. OG5N (200 μm) or OGB1 (50 μm) was used as a Ca2+-indicator dye in A and B , respectively.
Next, we tested whether Ca2+ uptake via the mitochondrial Ca2+ uniporter is required for the generation of Cares. We recorded CaTs at the large MFBs using OGB1 in the presence of ruthenium red (10 μm) or Ru360 (30 μm) in the patch pipette (Fig. 4 Ba,Bb). Both ruthenium red and Ru360 reduced the ∫Cares dt to ∼30% of the control value (1.93 ± 0.57 μm · s, n = 6) (Fig. 4 Bc), which was comparable with the mean value for ∫Cares dt at small MFBs (2.27 ± 0.65 μm · s; n = 16; p = 0.26). The plot of ∫Cares dt values as a function of Δ[Ca2+]AP shows that the distribution of Δ[Ca2+]AP in the presence of the drugs was not different from that in control (Fig. 4 Bd). In contrast to the control condition, no correlation was observed between ∫Cares dt and Δ[Ca]AP when the mitochondrial Ca2+ uniporter was inhibited. These results suggest that Ca2+ uptake via the mitochondrial Ca2+ uniporter during HFS is a prerequisite for the generation of Cares at large MFBs.
Mitochondrial NCE after HFS contributes to the Cares at large MFBs, but not at small MFBs
Two pathways for mitochondrial Ca2+ efflux have been recognized based on cytosolic Na+ dependence, with the primary efflux pathway of brain mitochondria being Na+-dependent (probably mitoNCX) (Crompton et al., 1978). We investigated whether NCE from presynaptic mitochondria is involved in the generation of Cares at MFBs. Although TPP+ dissipates ΔΨm at concentrations >10 μm, it is a potent and selective inhibitor of mitochondrial NCE at low concentrations (IC50, 0.2 μm) with little adverse effect on mitochondrial respiration (Aiuchi et al., 1985; Karadjov et al., 1986; Wingrove and Gunter, 1986).
The bath application of 2 μm TPP+ attenuated the amount of Cares to 47% of the control value (0.47 ± 0.02; n = 5) (Fig. 5 Aa,Ac). Another specific NCE inhibitor, CGP37157 (10 or 20 μm), decreased the amount of Cares to a similar extent (0.41 ± 0.02; n = 4) (Fig. 5 Ab,Ac), indicating that the NCE from mitochondria is responsible for the generation of Cares at the large MFBs. To determine whether TPP+ or CGP37157 affected the peak of TS-CaTs during HFS, the MFBs were loaded with OG5N together with OGB1 at the same molar concentration (50 μm). Under control conditions, not only the residual ΔF/F 0, but also the peak ΔF/F 0 values increased in proportional to the frequency of HFS, indicating that the peak ΔF/F 0 values were not saturated during HFS (Fig. 5 Ba). Using the same techniques, we examined the effects of TPP+ and CGP37157 on the peak and residual ΔF/F 0 values. The HFS-induced ΔF/F 0 transients before and after application of 2 μm TPP+ (Fig. 5 Bb) or 20 μm CGP37157 (Fig. 5 Bc) were superimposed, showing that TPP+ and CGP37157 attenuated the post-tetanic residual ΔF/F 0 without altering the peak ΔF/F 0 during HFS. These results, summarized in Figure 5 Bd, suggest that mitochondrial Ca2+ uptake during HFS and subsequent post-tetanic Ca2+ release by the mechanism of NCE generate the Cares at large MFBs.
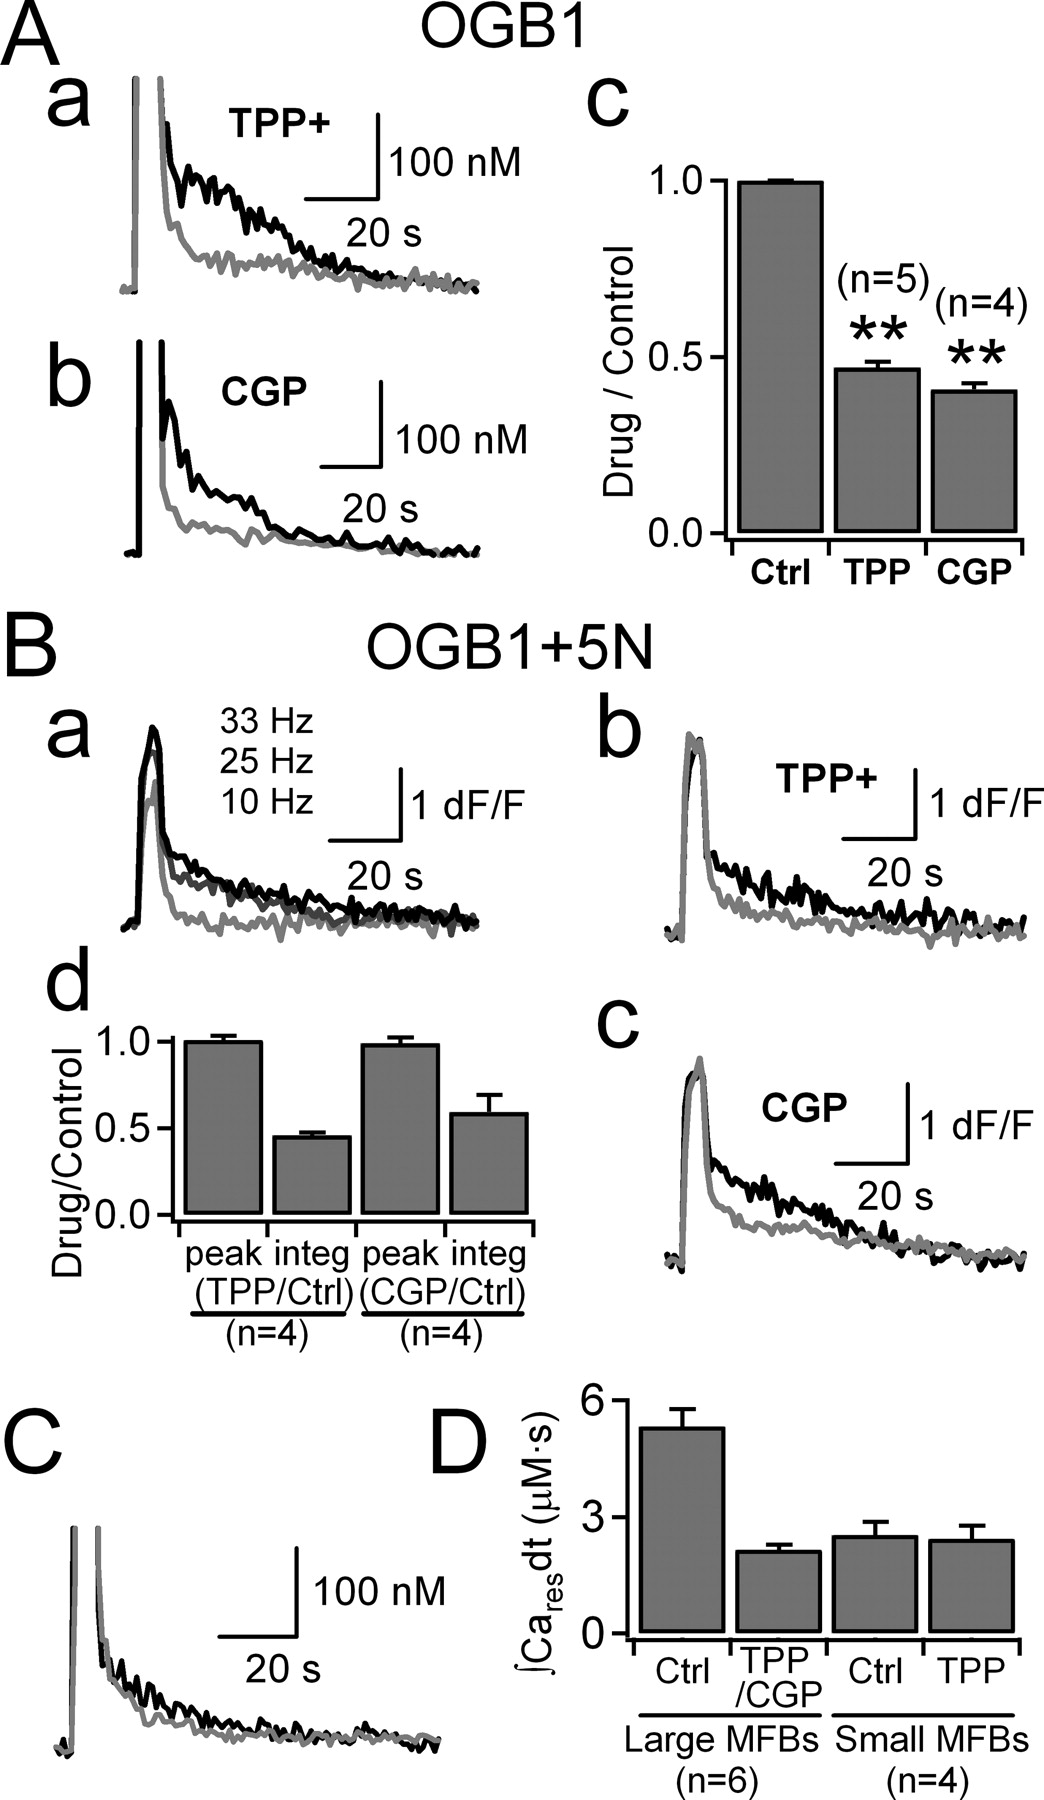
Effects of mitoNCX inhibitors on the post-tetanic Cares. Aa , Ab , The two superimposed CaTs were evoked at a large MFB by HFS (33 Hz, 5 s) under control conditions (black line) and in the presence of 2 μm TPP+ ( a , gray line) or 10 μm CGP37157 ( b , gray line). Ac , ∫Cares dt values were calculated from CaTs evoked by HFS (25 Hz or 33 Hz for 5 s), and mean values for the ratio of ∫Cares dt in the presence of mitoNCX blocker (2 μm TPP+ or 10∼20 μm CGP37157) to that in control conditions were plotted in the bar graph. **p < 0.01 B , Large MFBs were loaded with 50 μm OG5N together with 50 μm OGB1. Ba , The three superimposed ΔF/F 0 transients were evoked by 5 s HFS at different frequencies (10 Hz, 25 Hz or 33 Hz). Bb , Bc , Two superimposed ΔF/F 0 transients were evoked by HFS (33 Hz for 5 s) before (black line) and after bath application of 2 μm TPP+ (gray line, Bb ) or 20 μm CGP37157 (gray line, Bc ). Bd , Relative values for peak ΔF/F 0 (peak) and integrals of post-tetanic ΔF/F 0 (integ) in the presence of TPP+ or CGP37157 normalized to those under control conditions. C , Experiments similar to A were done at small en passant MFBs. The two superimposed CaTs were evoked by HFS (33 Hz, 5 s) before (black line) and after application of 2 μm TPP+ (gray line). D , Mean values for ∫Cares dt evoked by the same HFS (33 Hz for 5 s) at large and small en passant MFBs before and after bath application of 2 μm TPP+. Note that ∫Cares dt at small MFBs is not different from that at large MFBs in the presence of mitoNCX blockers.
The mean value for ∫Cares dt measured at large MFBs in the presence of TPP+ or CGP37157 (2.14 ± 0.12 μm · s; n = 6) was comparable with that induced by the same HFS (33 Hz, 5 s) at small MFBs under control conditions (2.28 ± 0.16 μm · s; n = 16) (Fig. 5 D). Furthermore, the bath application of 2 μm TPP+ had no significant effect on the amount of Cares at the small MFBs (2.53 ± 0.33 vs 2.43 ± 0.33 μm · s; p = 0.818; n = 4) (Fig. 5 C,D). These results suggest two different mechanisms, mitochondria-dependent and nonmitochondrial, for the generation of Cares at MFBs, with the mitochondria-dependent mechanism occurring exclusively at large MFBs.
Effect of Ca2+ buffers on the time course of Δ[Ca2+]res at large MFBs
Whole-cell recording of a GC alters the Ca2+ dynamics of MFBs because of gradual washout of endogenous Ca2+ buffers including calbindin-D28K and the introduction of a Ca2+-indicator dye (Müller et al., 2005). It is important whether altered presynaptic Ca2+ buffering substantially influences the time course of Δ[Ca2+]res. We can predict the possible effects of Ca2+ buffer on the time course of Δ[Ca2+]res based on the differentiation of equation 5, which yields the following:
 This equation implies that y(t) closely reflects that of j(t), and does not depend on the properties of intracellular Ca2+ buffer. Exogenous Ca2+ buffers may alter Δ[Ca2+]i during HFS, and thus mitochondrial Ca2+ uptake during HFS, which in turn can affect j(t). The linear superposition model for a TS-CaT, however, predicts that Ca2+ buffers alter only the time course to reach steady-state [Ca2+]i during HFS with no effect on the steady-state [Ca2+]i (Regehr et al., 1994). The linear superposition model together with equation 6 predict that intracellular Ca2+ buffers have a limited effect on y(t) at large MFBs. To test this hypothesis, we measured the decay time courses of AP-CaTs and TS-CaTs at various concentrations of a Ca2+-indicator dye, which acts as a Ca2+ buffer, at the same large MFB, while it was being loaded with 200 μm OGB1 through a pipette to the soma (supplemental Fig. 1A, available at www.jneurosci.org as supplemental material). The increase in [OGB1] accompanied the decrease in the peak amplitude of AP-CaT and the increase in its decay time constant, indicative of increase in the Ca2+ buffer concentration at the MFB (Neher and Augustine, 1992; Kim et al., 2003) (supplemental Fig. 1B, available at www.jneurosci.org as supplemental material). In contrast to the altered kinetics of AP-CaTs, the time course of Δ[Ca2+]res evoked by HFS (33 Hz, 5 s) were not altered (supplemental Fig. 1C,D, available at www.jneurosci.org as supplemental material). This result supports the prediction about the time course of Δ[Ca2+]res based on equation 6. In addition, it is expected that the time course of Δ[Ca2+]res
in vivo, in the absence of an exogenous Ca2+-indicator dye, would be similar to that observed in the present study.
This equation implies that y(t) closely reflects that of j(t), and does not depend on the properties of intracellular Ca2+ buffer. Exogenous Ca2+ buffers may alter Δ[Ca2+]i during HFS, and thus mitochondrial Ca2+ uptake during HFS, which in turn can affect j(t). The linear superposition model for a TS-CaT, however, predicts that Ca2+ buffers alter only the time course to reach steady-state [Ca2+]i during HFS with no effect on the steady-state [Ca2+]i (Regehr et al., 1994). The linear superposition model together with equation 6 predict that intracellular Ca2+ buffers have a limited effect on y(t) at large MFBs. To test this hypothesis, we measured the decay time courses of AP-CaTs and TS-CaTs at various concentrations of a Ca2+-indicator dye, which acts as a Ca2+ buffer, at the same large MFB, while it was being loaded with 200 μm OGB1 through a pipette to the soma (supplemental Fig. 1A, available at www.jneurosci.org as supplemental material). The increase in [OGB1] accompanied the decrease in the peak amplitude of AP-CaT and the increase in its decay time constant, indicative of increase in the Ca2+ buffer concentration at the MFB (Neher and Augustine, 1992; Kim et al., 2003) (supplemental Fig. 1B, available at www.jneurosci.org as supplemental material). In contrast to the altered kinetics of AP-CaTs, the time course of Δ[Ca2+]res evoked by HFS (33 Hz, 5 s) were not altered (supplemental Fig. 1C,D, available at www.jneurosci.org as supplemental material). This result supports the prediction about the time course of Δ[Ca2+]res based on equation 6. In addition, it is expected that the time course of Δ[Ca2+]res
in vivo, in the absence of an exogenous Ca2+-indicator dye, would be similar to that observed in the present study.
The mitochondrial NCE contributes to PTP specifically at MF synapses onto mossy cell
We showed that NCE from mitochondria is involved in the generation of Cares specifically at large MFBs but not at small MFBs. Large MFBs terminate exclusively on the thorny excrescences of hilar MCs and CA3 pyramidal cells (PCs), while small en passant MFBs target GABAergic interneurons (Claiborne et al., 1986; Acsady et al., 1998). We hypothesized that mitochondria-dependent presynaptic Cares may influence PTP at MF→MC synapses, but not at MF synapses onto HIs. To test this hypothesis, we examined EPSCs evoked by extracellular stimulation of MFs in the MC. MCs were identified by the presence of thorny excrescences on dendrites (see Materials and Methods) (Lübke et al., 1998) (Fig. 6 Aa).
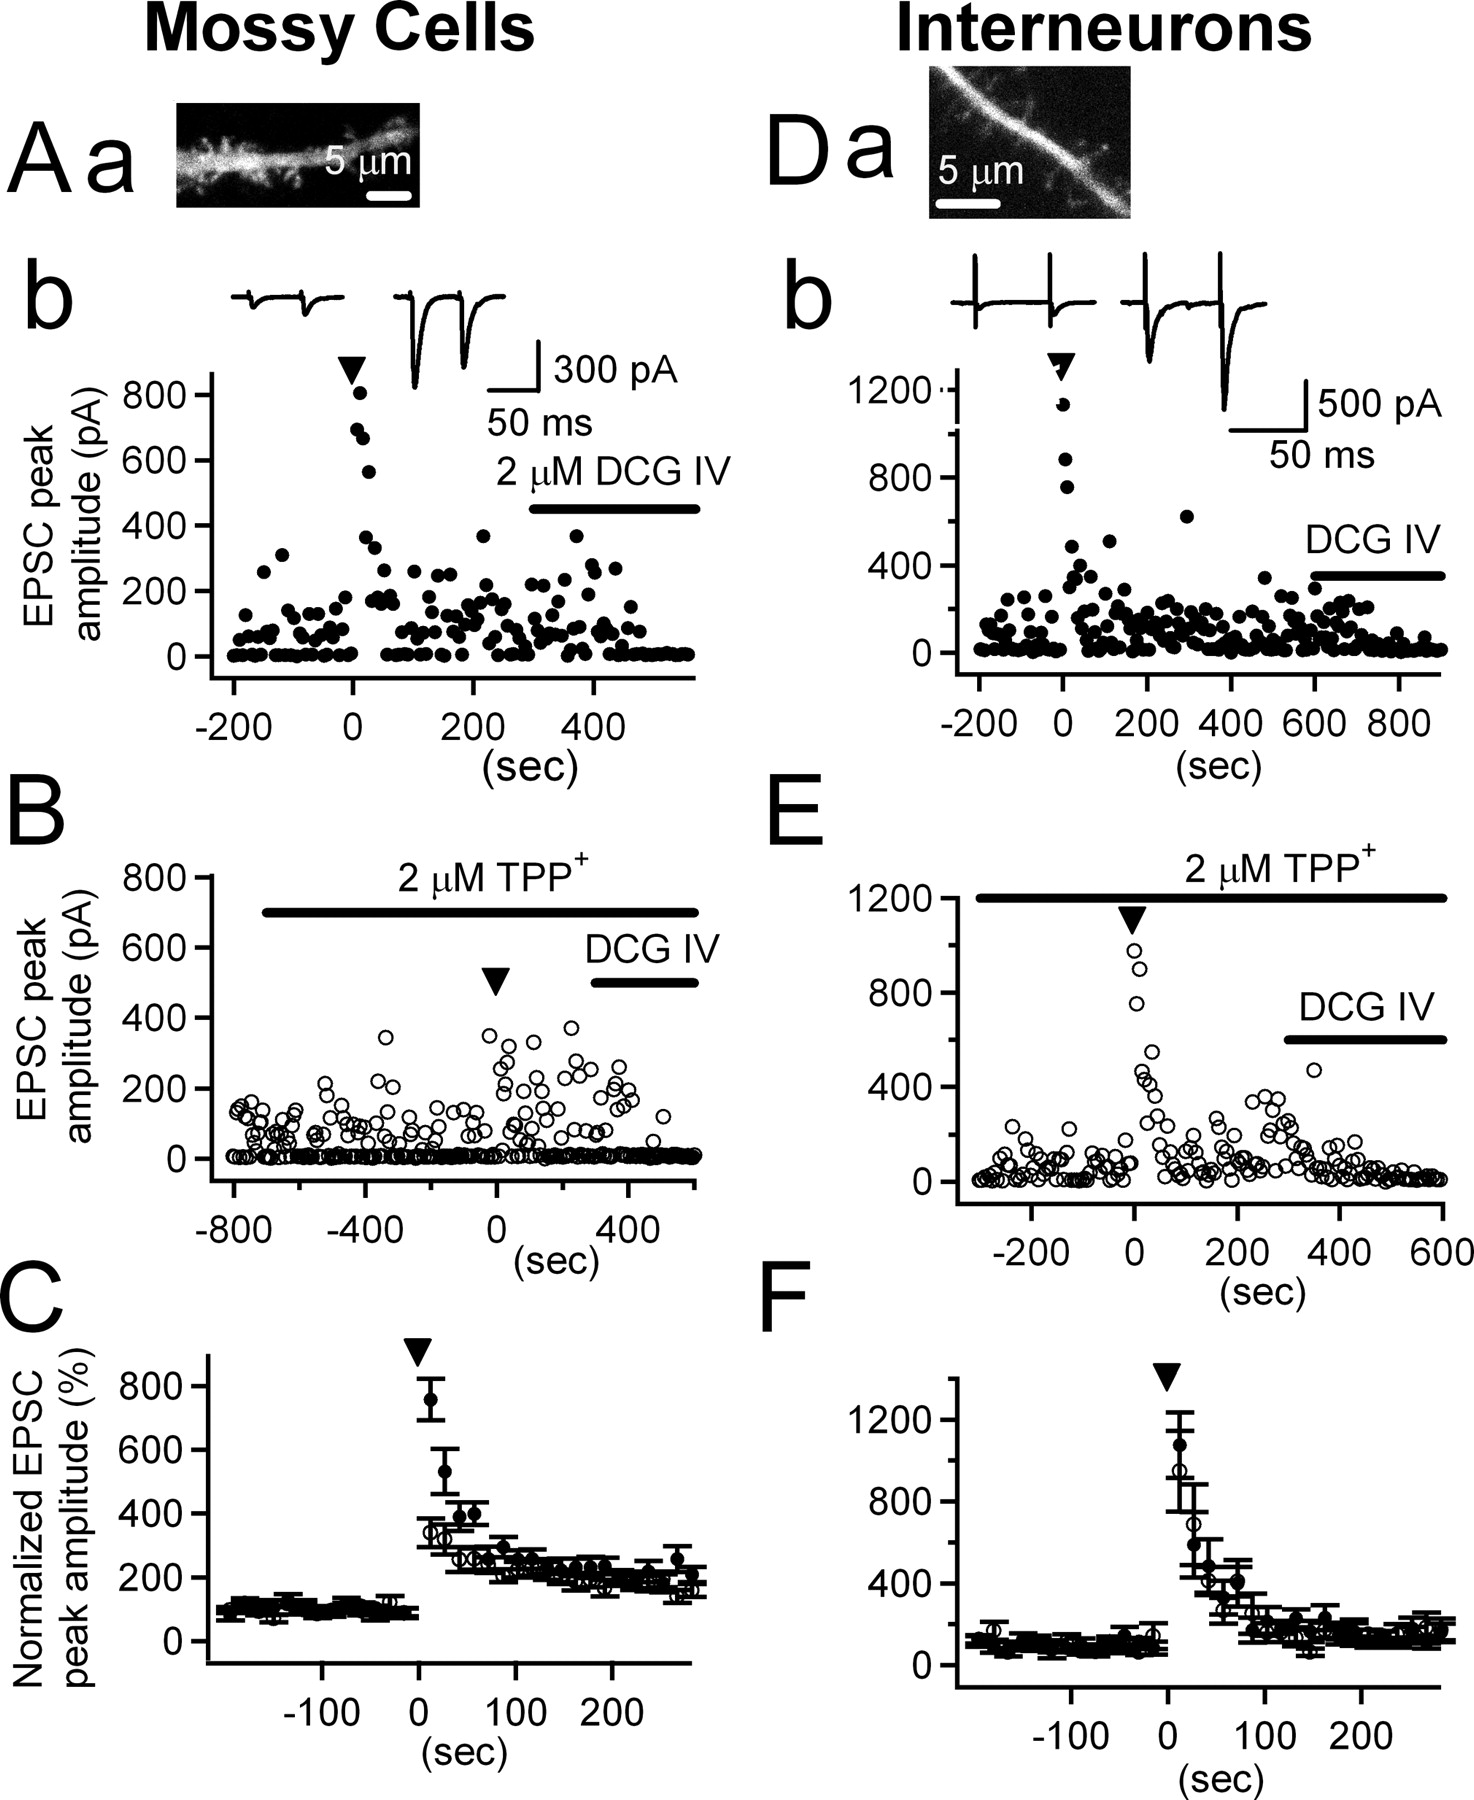
A–F , Effects of mitoNCX inhibitors on PTP at the MF synapse onto the hilar mossy cell (MF→MC synapse, A–C ) and at that onto the hilar interneuron (MF→HI synapse, D–F ). Aa , Da , Fluorescence micrograph of a dendrite of the MC and the HI located in the deep hilar region. Note the thorny excrescences in Aa and thin spines on the dendritic shaft in Da . Ab , Db , EPSCs were recorded from the MC ( Ab ) or the HI ( Db ) by applying paired pulses (50 ms interval) stimulation (2–25 V) at a rate of 0.2 Hz. After baseline transmissions (BTs) were recorded for 5–10 min, HFS at 25 Hz was applied for 5 s (inverted triangle) and the time-dependent changes in the EPSC amplitude were recorded. DCG-IV (2 μm) was applied at the end of experiments to confirm MF stimulation. Insets of Ab and Db show averaged traces of 36 EPSCs during BT (left) and of six EPSCs during the PTP phase (right). B , E , Experiments similar to Ab and Db were conducted in the presence of 2 μm TPP+, which was applied for at least 10 min before applying a HFS (25 Hz, 5 s) while monitoring BT. C , F , Three consecutive EPSCs from each cell were averaged, and then the resulting means were averaged again over the cells recorded. The time course of PTP under control conditions (filled circles; n = 15 for MC and n = 7 for HI) and in the presence of 2 μm TPP+ (open circles; n = 12 for MC and n = 5 for HI) are shown.
After assessing the baseline amplitudes of EPSCs evoked by extracellular paired stimuli (interstimulus interval, 50 ms) at 0.2 Hz for 5–10 min, we applied HFS at 25 Hz for 5 s, and then resumed the paired stimuli at 0.2 Hz to monitor the change in synaptic strength. A time course of the change in EPSC amplitudes was depicted from ensemble averages over mean amplitudes of three consecutive EPSCs of each cell (Fig. 6 C,F). PTP was measured as the average of the first three EPSC amplitudes (7, 12, and 17 s after the end of HFS) compared with the control EPSC amplitude.
The HFS invariably induced immediate and short-lasting PTP of EPSCs, which was usually followed by a longer-lasting synaptic potentiation (probably MF long-term potentiation). The average PTP of EPSCs was 756 ± 64% (n = 15) (Fig. 6 A,C, filled circles). The mean paired pulse ratio (PPR) significantly decreased from 2.22 ± 0.12 in basal transmission to 1.09 ± 0.08 during PTP (n = 15; p < 0.01). Furthermore, PTP was accompanied by a significant decrease in the failure rate, from 0.23 ± 0.04 to 0.01 ± 0.01 (measured during 30 s immediately after HFS; n = 15; p < 0.01), indicative of a presynaptic locus of PTP at the MF→MC synapse.
Previous simultaneous recordings of presynaptic [Ca2+] and excitatory field potential at mossy fiber synapse in CA3 revealed that the magnitude of PTP is well correlated with that of Δ[Ca2+]res, but PTP outlasts Cares (Regehr et al., 1994). Consistently, we found that the decay time constant of ensemble-averaged PTP at MF→MC synapse (31.8 s) was slower than that of Δ[Ca2+]res (17.7 ± 2.5 s; n = 5) at large MFBs, when the time course was analyzed 7 s after the end of HFS (25 Hz, 5 s).
To investigate the dependence of PTP on presynaptic mitochondrial NCE, similar experiments were performed in the presence of 2 μm TPP+. The baseline EPSC size was not significantly affected by the TPP+ treatment for >10 min (59.8 ± 8.7 vs 57.3 ± 5.7 pA; n = 5; p = 0.817). However, PTP induced by the same HFS (25 Hz, 5 s) was significantly reduced in the presence of TPP+ (338 ± 45%; n = 12; p < 0.01) (Fig. 6 B,C, open circles). The summary plot of normalized peak amplitudes of EPSCs depicted in Figure 6 C shows that 2 μm TPP+ lowered the PTP by 55.2%. We also examined the effects of another mitochondrial NCE inhibitor, CGP37157 on the PTP of EPSCs at the MF→MC synapse. Consistent with the effects of TPP+, 20 μm CGP37157 significantly reduced the PTP evoked by the same HFS (512 ± 84%; n = 12; p < 0.05) (supplemental Fig. 2, gray circles, available at www.jneurosci.org as supplemental material).
To test the dependence of PTP on the mitochondrial NCE at the synapses of small MFBs, we performed a similar set of experiments in hilar interneurons, onto which small MFBs terminate (Acsady et al., 1998). Because we have done majority of Ca2+ imaging experiments at MFBs located >100 μm apart from the subgranular border, we avoided interneurons in the subgranular layer, and examined EPSCs at MF synapses on the interneurons located in the deep hilar region. We considered deep hilar neurons devoid of thorny excrescence, which were usually found to have the dendrites covered with long and thin spines (Fig. 6 Da), as HIs. The same HFS (25 Hz, 5 s) induced the PTP at the MF→HI synapses (Fig. 6 Db), which was accompanied by decreases in PPR (from 2.30 ± 0.21 to 1.46 ± 0.16, n = 7, p < 0.01) and in the failure rate (from 0.37 ± 0.01 to 0.08 ± 0.01; n = 7; p < 0.01), indicative of the presynaptic locus of PTP. The decay time constant of PTP at the MF→HI synapse (29.2 s) was slower than that of residual [Ca2+] (15.0 ± 1.9 s, n = 11) at small MFBs. In spite that the amount of Cares was lower at small MFBs (Fig. 2), the magnitude of PTP at the MF→HI synapses was larger (1075 ± 161%; n = 7) (Fig. 6 Db,F, filled circles) than at the MF→MC synapses (p < 0.05). Furthermore, PTP at the MF→HI synapse was not altered by 2 μm TPP+ (948 ± 197%) (Fig. 6 E,F, open circles), implying that mitochondria-dependent Cares does not contribute to the PTP at the MF→HI synapse.
These results suggest that the presynaptic mechanism of PTP at MF→MC synapses is distinct from that at MF→HI synapses and that mitochondria-dependent Cares is responsible for the PTP selectively at MF→MC synapses.
Protein kinase C contributes to PTP specifically at MF synapses onto hilar interneuron
Previously, activation of PKC has been proposed as underlying mechanisms for PTP at the synapses in hippocampus and in cerebellum (Alle et al., 2001; Brager et al., 2003; Beierlein et al., 2007; Wierda et al., 2007). We studied whether PKC is differentially involved in PTP at MF→MC and MF→HI synapses.
To investigate the dependence of PTP on PKC activation, slices were perfused with aCSF containing a PKC inhibitor at least 1 h ahead of each recording in the recording chamber. The pretreatment with 5 μm chelerythrine exclusively attenuated PTP at the MF→HI synapse (Fig. 7 D), but not at the MF→MC synapse (Fig. 7 A). Summary plots indicate that chelerythrine diminished PTP at the MF→HI synapse (365 ± 87%; n = 7; p < 0.01) (Fig. 7 F, open circles), although it had no effect on PTP at the MF→MC synapse (683 ± 123%; n = 5) (Fig. 7 C, open circles).

Differential involvement of PKC in PTP at the MF→MC and at the MF→HI synapses. A , B , D , E , Experiments similar to Figure 6 were done in the presence of 5 μm chelerythrine ( A and D ) or 1 μm Ro-31-8220 ( B and E ). C and F , Time courses of ensemble-averaged EPSC amplitudes (obtained in the same way as in Fig. 6 C,F) under control conditions (filled circles; same traces from Fig. 6 C,F) and in the presence of chelerythrine (open circles, n = 5 for MC and n = 7 for HI) or Ro-31-8220 (gray circles; n = 6 for MC and n = 7 for HI) are shown.
To further narrow down the identity of PKC involved in the mossy fiber PTP, we tested the effects of another PKC inhibitor Ro-31-8220, which selectively inhibits Ca2+-dependent PKC isoforms plus PKCε. After at least 1 h perfusion of the slice with aCSF containing 1 μm Ro-31-8220, similar experiments were performed both at MF→MC synapse (Fig. 7 B) and at MF→HI synapse (Fig. 7 E). Ro-31-8220 exclusively diminished PTP at the MF→HI synapse (306 ± 79%; n = 7; p < 0.01) (Fig. 7 F, gray circles), but not at the MF→MC synapse (630 ± 136%; n = 6) (Fig. 7 C, gray circles). These results suggest that activation of PKC is involved in PTP at the MF→HI synapse, but not at the MF→MC synapse, and that PKC and mitochondria are involved at complementary MF synapses in the hippocampal hilar region.
Discussion
The present study demonstrated that mitochondria- and PKC-dependent PTP occurs at MF synapses onto the hilar mossy cells and interneurons, respectively. The differential PTP mechanisms depending on target cells can be ascribed to the differences between large and small MFBs with regard to the activity-dependent regulation of Ca2+ dynamics and signaling pathways involving PKC. Mossy fibers innervate hilar interneurons not only via small MFBs but also via bulbous endings of hair-like filopodial extension from large MFBs (Acsady et al., 1998). Because of technical difficulty, we could not address the question whether mitochondrial Cares occurs at bulbous endings. Our finding that TPP+ had no effect on the PTP at MF→HI synapses suggests that mitochondria little contribute to Cares at bulbous endings.
Exclusive mitochondrial involvement in PTP at the synapse of large MFBs is consistent with our observation of different Ca2+-dynamics at two types of MFBs. It is obscure, however, what is responsible for differential activation of PKC at two types of MFB. Figure 4 A showed that lack of mitochondrial uptake at small MFBs resulted in the higher Ca2+ build-up during HFS compared with the large MFBs. The differential Ca2+ build-up in response to the same HFS in turn may cause differential activation of PKC at the two types of MFBs. Alternatively, PKC or its targets may be differentially distributed at two types of MFBs.
Pathways for post-tetanic Ca2+ release from mitochondria
The present study suggests that mitochondrial Ca2+-uniporter and mitoNCX are major pathways for Ca2+ uptake during HFS and post-tetanic Ca2+ release, respectively. The buildup of [Ca2+]i activates the Ca2+-uniporter, through which calcium ions pass down the electrochemical gradient across the mitochondrial inner membrane (Kirichok et al., 2004). Invasion of high-frequency APs to the axon terminal accompanies an increases in [Na+]i (Zhong et al., 2001). Given that the decay of [Na+]i is rather slower than that of [Ca2+]i after cessation of HFS (Regehr, 1997), the ionic conditions after a rapid Ca2+ decay phase (high [Na+]i and relatively low [Ca2+]i) may provide an electrochemical gradient favorable for sequestrated Ca2+ to be released into cytosol via mitoNCX.
It should be noted that TPP+ has reduced PTP both at the NMJ of crayfish and at MF→MC synapses, but at different concentrations (Tang and Zucker, 1997). TPP+ dissipates the Δψm in a dose-dependent manner. Such adverse effects become overt at concentrations >10 μm. At lower concentrations, however, TPP+ had little effect on mitochondrial respiration, and it had no adverse effect when pyruvate is provided as a substrate (Aiuchi et al., 1985). The Cares at the NMJ was blocked by 10 μm TPP+, and this was accompanied by a significant increase in the peak of TS-CaT, indicative of compromised mitochondrial Ca2+ uptake (Tang and Zucker, 1997). Moreover, mitochondrial Ca2+ release was not blocked by CGP37157, a specific blocker of mitoNCX, implying that the Na+-independent efflux of Ca2+ is a major route for mitochondrial Ca2+ release (Zhong et al., 2001). In the present study, 2 μm TPP+ or 10 μm CGP37157 significantly reduced ∫Cares dt, but neither had an effect on the [Ca2+]i build-up during HFS, indicating that mitochondrial Ca2+ uptake was not inhibited by these drugs (Fig. 5). These results support the idea that TPP+ at low concentrations is relatively specific for mitoNCX with little effect on mitochondrial respiration (Aiuchi et al., 1985; Wingrove and Gunter, 1986).
Mitochondrial and nonmitochondrial mechanisms of Cares
At large MFBs, inhibitors of mitochondrial NCE did not completely abolish the Cares. One explanation is the possible involvement of Na+-independent mitochondrial Ca2+ release pathway such as Ca2+/H+ exchanger, reversal of Ca2+ uniporter or mitochondrial permeability transition pore (Bernardi, 1999). However, these possibilities are not likely because the amount of Cares insensitive to blockers of Ca2+ uniporter was comparable with that insensitive to mitoNCX blockers (compare Figs. 4 Bc, 5 D). This result indicates that the Cares at a large MFB is generated by mitochondrial and nonmitochondrial mechanisms. To investigate whether Ca2+ release from endoplasmic reticulum (ER) or an extracellular Ca2+ influx via presynaptic kainate channels play a role in the generation of the nonmitochondrial Cares, we tested the effect of CNQX and thapsigargin on the Cares and the peak amplitude of TS-CaTs, respectively. Neither of them had significant effects (data not shown), implying that ER and kainate receptor may not be responsible for the nonmitochondrial Cares.
The nonmitochondrial Cares at large MFBs shares several characteristics with the Cares at small MFBs with regard to the amount of Cares (compare Figs. 2 with 4 C, 5 D) and its independence of the Δ[Ca2+]AP (Figs. 2 E, 4 Bd), indicating that nonmitochondrial Cares exists at both types of boutons, whereas mitochondrial Cares occurs specifically at large MFBs.
Downstream mechanisms for mitochondria-dependent PTP at MF synapses
Growing body of evidence support that activation of PKC is required for PTP at many synapses in hippocampus and cerebellum (Alle et al., 2001; Brager et al., 2003; Beierlein et al., 2007). Previously, a new downstream target of PKC has been suggested as a mechanism for PTP in hippocampal cultured cells (Wierda et al., 2007). Although mitochondrial involvement in PTP remains to be investigated at these synapses, these studies suggest that PKC-mediated PTP occurs more widely at central synapses than mitochondria-dependent PTP. Similar to PTP at large MFBs, we found that PTP at immature calyx of Held is mediated by mitochondria-dependent Cares (our unpublished observations), suggesting that mitochondrial involvement in PTP may be preferentially observed at large presynaptic terminals in CNS and raising a question whether mitochondria- and PKC-dependent PTP are expressed in a mutually exclusive manner at central synapses.
Although the key role of Cares has been demonstrated at NMJs, downstream mechanisms underlying PTP are still elusive. It is widely accepted that simple summation of Cares is not sufficient to induce significant facilitation because of large difference in the amplitudes of residual [Ca2+] and microdomain [Ca2+]. Given that GCs express a high concentration of calbindin-D28K (Müller et al., 2005), which buffers cytosolic Ca2+ fast sufficient to limit the size of a Ca2+ microdomain, it is of particular interest that partial saturation of endogenous Ca2+ buffers play a role in synaptic facilitation at mossy fiber synapses (Blatow et al., 2003). Recent simulation results predict that appreciable magnitude of facilitation occurs through buffer saturation within fairly narrow ranges of buffering parameters (Matveev et al., 2004). Therefore, it remains to be elucidated whether post-tetanic residual [Ca2+] level is high enough to saturate calbindin and to induce PTP by the mechanism of buffer saturation.
Significance of PTP in hippocampal synaptic computation
A previous electron microscopy study revealed that the cross-sectional area of the large MFBs was 7 μm2 on average at the end of the third postnatal week, when large MFBs display full morphological features of adult large MFBs (Amaral and Dent, 1981). The physical dimension of large MFBs is comparable with what we observed in the present study (8.50 ± 0.34 μm2). Even after the third postnatal week, large MFBs increase in size and complexity throughout life, especially in response to enriched environment (Galimberti et al., 2006). These changes may accompany an increased mitochondrial contribution to PTP at synapses of large MFBs.
Large MFBs are found at MF→MC and MF→CA3 pyramidal cells (CA3-PCs) synapses, both of which share the unique postsynaptic morphology of a thorny excrescence. Previously, MF→MC synapses were reported to exhibit short- and long-term synaptic plasticity, which is generally similar to the MF→CA3 pyramidal cell synapses (Lysetskiy et al., 2005). Furthermore, no electron microscopic difference was found between the large MFBs in the hilar region and those in the CA3 field (Amaral and Dent, 1981). Thus, it is plausible that mitochondria-dependent Cares also occurs at large MFBs terminating onto CA3 pyramidal cell.
Mossy fiber synapses are unique in that they show a wide dynamic range of plasticity (Nicoll and Schmitz, 2006). The in vivo study has revealed that single spike in a GC is not sufficient but the train of spikes is required to discharge the target CA3-PC, suggesting that a synaptic facilitation is crucial for the detonator role of large MFBs (Henze et al., 2002). Facilitation of an MF synapse onto CA3-PCs accompanies profound increase in network inhibition because of overriding number of synaptic termination onto interneurons (Acsady et al., 1998; Mori et al., 2007). The network inhibition may limit the time window for integration of excitatory inputs in a CA3-PC by the mechanism of feedforward inhibition. Therefore, propagation of a neuronal spike from a GC into a CA3-PC heavily depends on the balance between direct excitatory MF input onto CA3-PCs and bisynaptic inhibitory input via feedforward inhibitory circuit. If the results of the present study can be extrapolated to MF synapses in CA3, it can be postulated that PTP at MF→PC and MF→interneuron (IN) synapses in CA3 may occur by mechanisms of mitochondrial Ca2+ release and PKC, respectively. Differential mechanisms of PTP at MF→CA3-PC and MF→IN may provide an important basis for studying network excitability in the hippocampal CA3 field.
Appendix
The single compartment model predicts mono-exponential decay of cytosolic [Ca2+]i in response to Ca2+ influx evoked by a single AP (Helmchen et al., 1997; Lee et al., 2000). The model assumes the cytosolic space to be a single compartment whose Ca2+ extrusion rate is linear to cytosolic [Ca2+] excursion from its resting level (Δ[Ca2+]i) with a rate constant γ. The impulse response of this linear system is as follows:
 By definition, the time integral of an input δ function, ∫δ(t)dt, or the increment of total Ca2+ concentration (Δ[Ca]T) is unity. Assuming that incoming Ca2+ instantaneously equilibrates with Ca2+ buffers, the amplitude of the impulse response and decay rate constant are inversely proportional to the Ca2+-binding ratio (κ). Thus,

 where Σκ represents the sum of the Ca2+ binding ratios of all Ca2+ buffers in the cell (Lee et al., 2000).
The time-dependent change in Δ[Ca2+]i, y(t), of this linear system in response to an arbitrary time-dependent Ca2+ influx into the cytosol, j(t), is given by a convolution of the input function j(t) with the impulse response h(t):
 The y(t) can be deconvolved as follows (Cohen et al., 1981; Neher and Sakaba, 2001):
 Substitution of τ and A in equation A5 using equations A2 and A3 yields the following:
 The time integral of equation A6 from t′ = 0 to t yields the following:
 where t > 0 and y(0) > y(t). This equation gives the total amount of Ca2+ release (or influx) during a period t after the start of the slow-decay phase. Using the relationship in equation A3, the above equation can be rewritten as follows:
 The first term of equation A8 is the time integral, with a minus sign, of a CaT with monoexponential decay; the amplitude and time constant are y(0) − y(t) and τ, respectively. Because y(∞) = 0, insertion of t = ∞ into equation A8 yields equation 4.
Footnotes
-
This work was supported by Grant M103KV010008-06K2201-00810 from Brain Research Center of the 21st Century Frontier Research Program funded by the Ministry of Science and Technology of the Republic of Korea. D.L. and K.-H.L. are postgraduate students supported by Program BK21 from the Ministry of Education.
- Correspondence should be addressed to Dr. Suk-Ho Lee, Department of Physiology, Seoul National University College of Medicine, Chongno-Ku, Yongon-Dong 28, Seoul 110-799, Korea. leesukho{at}snu.ac.kr


