

Abstract
ON and OFF visual pathways originate in the retina at the synapse between photoreceptor and bipolar cells. OFF bipolar cells are shorter in length and use receptors with faster kinetics than ON bipolar cells and, therefore, process information faster. Here, we demonstrate that this temporal advantage is maintained through thalamocortical processing, with OFF visual responses reaching cortex ∼3–6 ms before ON visual responses. Faster OFF visual responses could be demonstrated in recordings from large populations of cat thalamic neurons representing the center of vision (both X and Y) and from subpopulations making connection with the same cortical orientation column. While the OFF temporal advantage diminished as visual responses reached their peak, the integral of the impulse response was greater in OFF than ON neurons. Given the stimulus preferences from OFF and ON channels, our results indicate that darks are processed faster than lights in the thalamocortical pathway.
Introduction
ON and OFF pathways are the main encoders of light increments and decrements in a large variety of animals, including flies, fishes, amphibians, birds, and mammals (Joesch et al., 2010). Without the ON pathway, monkeys fail to detect light targets on dark backgrounds (Schiller et al., 1986; Schiller, 1992; Dolan and Schiller, 1994). Similarly, humans with deficient ON pathways fail to see bright dots on dark backgrounds but can have normal visual acuity when tested with standard optometric charts that have dark characters on light backgrounds (Dryja et al., 2005). Traditionally, textbooks treated ON and OFF pathways as reverse versions of each other; however, pronounced departures from symmetry are already present at the level of the retina. ON and OFF retinal ganglion cells differ in number, size of their dendritic fields, size of their receptive fields, intrinsic conductances, threshold nonlinearities, and temporal adaptation to luminance (Peichl et al., 1987; Peichl, 1989; Dacey and Petersen, 1992; Chichilnisky and Kalmar, 2002; Rentería et al., 2006; Liang and Freed, 2010; Margolis et al., 2010; Pandarinath et al., 2010). Moreover, the metabotropic glutamate receptors of ON bipolar cells (mGluR6) use a second-messenger to invert voltage polarity, which has slower kinetics than the ionotropic glutamate receptors used by OFF bipolar cells (Nakajima et al., 1993). Also, the axons are longer in ON than OFF bipolar cells (Euler et al., 1996).
Just based on the receptor kinetics, it has been estimated that ON bipolar cells in salamanders and turtles can be delayed by 30 ms compared with OFF bipolar cells (Baylor and Fettiplace, 1977; Copenhagen et al., 1983; Shiells and Falk, 1995; Burkhardt et al., 1998; Gollisch and Meister, 2008; Burkhardt, 2011). Such temporal differences are likely to be smaller in warm-blooded retinas, particularly if some ON bipolar cells have inotropic AMPA receptors in addition to mGluR6 (Vardi et al., 1998). However, adjusting for a temperature of 37°C would still leave a difference of ∼10 ms in mammals (Burkhardt, 2011), which is large enough to influence the cortical representations of ON and OFF pathways in cortex (McConnell and LeVay, 1984; Zahs and Stryker, 1988; Jin et al., 2008) and could explain why humans process darks faster than lights (Komban et al., 2011).
While there is evidence that the OFF pathway is 30 ms faster than the ON pathway in salamanders (Shiells and Falk, 1995; Burkhardt et al., 1998; Gollisch and Meister, 2008; Burkhardt, 2011), there is no evidence for a faster OFF pathway in mammals. In fact, in vitro measurements in the peripheral retina of primates found faster response time courses in ON than OFF retinal ganglion cells (Chichilnisky and Kalmar, 2002). It is therefore important to investigate whether the delays imposed in early retinal circuits are transmitted through the visual pathway. Here, we address this question by directly measuring the response time course of large populations of ON and OFF thalamic neurons representing central vision and subpopulations of thalamic neurons making monosynaptic connection with the same orientation column of visual cortex.
Materials and Methods
Surgery and preparation.
Details of the surgical procedures have been described previously (Yeh et al., 2009b). Briefly, cats (n = 9 males) were tranquilized with acepromazine and ketamine and anesthetized with propofol. An intravenous catheter was placed in each hindlimb to allow continuous infusions of propofol for anesthesia, vecuronium bromide for muscle paralysis, and saline for hydration. All vital signs were closely monitored and carefully maintained within normal physiological limits. The nictitating membranes were retracted with neosynephrine and the pupils dilated with atropine sulfate. Contact lenses were used to protect the corneas and focus visual stimuli on the retina. In one animal, we used a pupil of 3 mm diameter that was placed in front of the area centralis; in the eight other animals, we did not use a pupil. The average ON–OFF temporal difference could be demonstrated with artificial pupil (latency difference = 4.93 ms, p < 0.001, peak time difference = 2.73 ms, p = 0.007, n = 74 cells, one cat, Mann–Whitney test) and without artificial pupil (latency difference = 3.55 ms, p < 0.001, peak time difference = 2.43 ms, p < 0.001, n = 474 cells, eight cats, Mann–Whitney test). The positions of the optic disk and the area centralis were plotted on a screen placed 114 cm in front of the animal by using a fiber-optic light source. The weight of the animals ranged from 2.4 to 4.2 kg (3.2 ± 0.68) and the ages ranged from 4.2 to 7.8 months (5.8 ± 1.33). All procedures were performed in accordance to the guidelines of the U.S. Department of Agriculture and approved by the Institutional Animal Care and Use Committee at the State University of New York, State College of Optometry.
Electrophysiological recordings and data acquisition.
A matrix of seven independently moveable electrodes arranged circularly (Thomas Recording) was used to simultaneously record from multiple geniculate cells with spatially overlapping receptive fields. In some experiments, we also used an array of 16 vertically arranged electrodes (Neuronexus) to record local field potentials through the depth of visual cortex. The electrode sites in the 16-channel array were separated by 100 μm from each other. The signals from the recording electrodes were amplified, filtered, and collected by a computer running Rasputin (Plexon), as previously described (Jin et al., 2008; Yeh et al., 2009b). Spike waveforms from each cell were initially identified during the experiment and later carefully verified off-line with spike-sorting software (Plexon). Most cells in this study were recorded within 10° of the area centralis. In experiments using spike-triggered source-density analysis, all geniculate cells had receptive fields located within <5° from the area centralis. X and Y geniculate cells were classified based on their linearity of spatial summation, measured with contrast reversing sinusoidal gratings at eight different phases and two different spatial frequencies.
Receptive-field mapping.
Receptive fields were mapped with dense white noise by reverse correlation, as previously described (Reid et al., 1997; Yeh et al., 2009b). The white noise consisted of a series of 32,767 checkerboards made of 16 × 16 light and dark pixels whose size was adjusted for each population of neurons (0.2 × 0.2° to 0.9 × 0.9°). The stimuli were presented at 60 Hz on a CRT monitor (monitor refresh rate: 120 Hz). The mean luminance of the monitor was 61 cd/m2 (light pixel: 120 cd/m2; dark pixel: 2 cd/m2). In one experiment, we measured the impulse responses at an additional mean luminance of 10 cd/m2 (light pixel: 18 cd/m2; dark pixel: 2 cd/m2). The receptive field frame with the response peak (first phase of impulse response) was selected to classify the cell either as ON center or OFF center (Alonso et al., 1996, 2001; Cai et al., 1997; Usrey and Reid, 2000; Usrey et al., 2000). Receptive fields were then normalized by the maximum response and represented as contour plots smoothed with a cubic spline (Matlab; MathWorks). Receptive fields are illustrated as multiple contour lines, with the most external line representing 20% of the maximum response and each additional contour line representing a 20% increment in response strength.
Time course of the visual response.
The time course of the visual response was calculated from the responses to dense white noise. The impulse response was defined as the time course of the response to the most effective stimulus pixel within the receptive-field center (Yeh et al., 2009b). The visual responses to this central pixel are strong and can be reliably reproduced across trials (see Figs. 3a, 4a), which is important to reveal differences in response latency between ON and OFF cells. The central location of this pixel also helps restrict our measurements to the receptive field center and not the surround. Visual responses to white noise from the receptive field surround are much weaker (∼20% of maximum response) and could not be used to reliably measure differences in response latency between ON and OFF neurons.
The impulse response was calculated by two different methods: peristimulus time histograms (PSTHs) and reverse correlation. The PSTH method directly measures the response latency to stimuli with a temporal resolution of 1 ms. The reverse-correlation method measures the latency of the linear filter that best predicts the response with a temporal resolution of 1.66 ms. Both measurements are related but not identical. In the PSTH method, we triggered the spike train of each geniculate cell with the onset of its preferred stimulus (i.e., the pixel that generated the largest response increment, which was dark for OFF geniculate neurons and light for ON geniculate neurons). The PSTH was calculated with 1 ms resolution and then smoothed with a boxcar filter. We tested boxcar filters with different temporal widths by simulating 1000 pairs of impulse responses with the same level of noise as our data and with a latency difference of 1 ms. These simulations demonstrated that the average temporal difference was independent of the boxcar temporal width but the measurements became more variable (i.e., larger standard deviation) with boxcar filters of <30 ms. Therefore, we chose a boxcar filter of 30 ms to minimize the noise variability and increase the significance of the measurements. In the reverse correlation method, the impulse response was calculated by triggering the stimuli with each spike and then averaging the stimuli. The impulse response calculated by reverse correlation was normalized by the maximum absolute value of its first phase and subsampled with a cubic spline at 1.66 ms (Matlab; MathWorks). We have previously shown that this subsampling is very effective at capturing small temporal differences between impulse responses and yield reliable results in repeated measurements from the same cells (Yeh et al., 2009b).
The temporal course of the impulse response was measured at four different time points: (1) the response latency, defined as the time when the first rising phase reached 40% of its maximum absolute value; (2) the peak time, defined as the time when the first phase of the impulse response reached its maximum absolute value; (3) the zero-crossing time, defined as the zero point at the crossing between the first and second phases of the impulse response; and (4) the rebound time, defined as the time when the second phase of the impulse response reached its maximum absolute value. The relative strength of rebound was measured with two different methods, the biphasic index (Cai et al., 1997) and the rebound index (Usrey and Reid, 2000; Alonso et al., 2001). The biphasic index was calculated as a rebound/peak amplitude ratio and the rebound index as a rebound/peak area ratio, the rebound being the second phase of the impulse response and the peak being the first phase.
Spike-triggered current-source density analysis.
Spike-triggered current-source density analysis was used to identify geniculate afferents making monosynaptic connection with the same orientation column in visual cortex (Swadlow et al., 2002; Jin et al., 2008, 2011). The spikes from each geniculate cell were used as triggers to average local field potentials recorded at 16 different cortical depths with a Neuronexus laminar array (the 16 electrodes were vertically arranged and were 100 μm from each other). For this analysis, we selected geniculate afferents that generated a monosynaptic current sinks >40 μv/mm2 in layer 4, 6, or both. The location of cortical layers 4 and 6 were identified with current-source density analysis of the cortical evoked potential to a flashing visual stimulus (Jin et al., 2008, 2011). Thalamocortical conduction times were measured as the difference between the time of the spike onset recorded in the thalamus and the peak of the axonal current sink recorded in cortex.
Results
We used a multielectrode array to simultaneously record from ON and OFF neurons with overlapping receptive fields in the cat lateral geniculate nucleus (LGN). The receptive fields of the geniculate neurons were measured with a sequence of binary white noise images, each stimulus image lasting 16.6 ms (monitor update: 8.3 ms; monitor refresh rate: 120 Hz). We performed spike-triggered averages of the stimulus to map the geniculate receptive fields in space and time. Figure 1 illustrates an example of a pair of ON (red) and OFF (blue) Y geniculate cells that were simultaneous recorded. The receptive fields, plotted at different time delays between stimulus and response (Fig. 1a), show a faster response time course in the OFF than ON geniculate cell. These temporal differences can be best appreciated by plotting the time course of the stimulus pixel that generated the maximum response at the receptive field center (Fig. 1b). In the OFF geniculate cell (Fig. 1b, blue line), the preferred stimulus pixel was dark and drove a response that reached 40% of its maximum at 24.9 ms (latency) and peaked at 41.5 ms (peak). The response reached baseline at 66.4 ms (zero-crossing) and its minimum at 86.3 ms (rebound). In the ON geniculate cell (Fig. 1b, solid red line), the preferred stimulus pixel was light and the response time course was ∼15 ms slower than for the OFF geniculate cell (latency: 39.8 ms, peak: 60 ms, zero-crossing: 86.3 ms, rebound: 134.5 ms).

Example of two simultaneously recorded Y geniculate neurons, illustrating a faster response time course in OFF than ON. a, Spatiotemporal receptive field movies of the two Y cells (solid red lines, ON; dotted blue lines, OFF). Each frame represents the receptive field at a specific time delay between stimulus and response (frame 0 shows the response between 0 and 16 ms, frame 16 shows the response between 16 and 33 ms, and so on). In this example, as in most geniculate cells, the response peak was followed by a strong rebound due to the change in the contrast polarity of the stimulus (solid blue lines, ON rebound in OFF cell; dotted red lines, OFF rebound in ON cell). b, Biphasic response time course of the two LGN neurons (blue, OFF; red, ON). Response time was measured at four different points: at 40% of the peak from the first rising phase (response latency), at the peak of the first phase (peak time), at the zero crossing between phases (zero-crossing), and at the peak of the second phase (rebound time).
These ON/OFF differences in response time course could be demonstrated in a large population of geniculate neurons (55 ON, 60 OFF) recorded with a multielectrode array in multiple closely spaced penetrations (average: six neurons per penetration; Fig. 2). Geniculate neurons responding 16–33 ms after the stimulus onset were almost all of OFF type (42 OFF, 4 ON; p < 0.001, χ2 test). Moreover, the few ON geniculate neurons that responded with fast latency could only be driven by the stimulus pixel located at the most central position of the receptive field (Fig. 2a,c, compare the small-diameter red contours with the larger blue contours). Later, at 33–49 ms after the stimulus onset, the number of ON and OFF geniculate neurons responding was similar (60 OFF, 55 ON; p = 0.64, χ2 test; Fig. 2b,d).

Receptive fields and response latencies of an LGN cell population, illustrating faster OFF than ON visual responses. a, Most cells responding 16–33 ms after stimulus onset were OFF cells. The receptive field of each cell is illustrated by a contour line containing the region that generated responses >20% of the maximum. b, ON and OFF cells responded in equal number at 33–49 ms. c, d, Receptive field center positions (position of visual space that generated the maximum response in each cell). AC, Area centralis.
While the geniculate neurons illustrated in Figure 2 were all recorded in the same animal (azimuth: −2 to −8°, elevation: +2.5 to −4.5°; Fig. 2c,d), a similar result could be obtained with a larger sample of 548 geniculate neurons (ON: 290; OFF: 258) from different animals (n = 9), all recorded within 10° of the area centralis (Fig. 3). To maximize the temporal accuracy of the measurements in this large population, we obtained all temporal values directly from a PSTH (bin = 1 ms) triggered by the preferred white-noise pixel for each cell (the pixel that generated the largest increase in firing rate). This approach is the most direct method to measure response latency with high temporal resolution and it allows us to illustrate the spike rasters triggered by the stimulus onset (see Materials and Methods; Fig. 3a). In this large population, OFF geniculate neurons had response latencies that were 3.8 ms faster, on average, than ON geniculate neurons. The ON/OFF temporal difference became smaller as the response reached its peak (2.6 ms) and it became not significant as the response returned to baseline (zero-crossing and rebound time; Fig. 3b). The distributions of response latency and peak time were shifted toward shorter values in OFF geniculate cells when compared with ON geniculate cells. Overall, most ON and OFF cells had response latencies between 15 and 35 ms and peak times between 30 and 50 ms (Fig. 3c). Similar temporal differences could be demonstrated with spike-trigger averages of the stimulus (latency difference: 3.2 ms, p < 0.001, peak-time difference: 1.18 ms, p = 0.009, Mann–Whitney test). The magnitude of the ON–OFF temporal differences did not seem to depend on the luminance of the stimulus (Shapley and Victor, 1979; Smirnakis et al., 1997; Mante et al., 2005; Weng et al., 2005; Lesica et al., 2007). In a group of simultaneously recorded geniculate cells (seven ON, two OFF) with pronounced ON–OFF temporal differences (ON–OFF latency: 5.8 ms, ON–OFF peak time: 9.5 ms), we measured the impulse responses at two different mean luminances: 61 and 10 cd/m2. While the time course of the responses became slower at low luminance (increase in OFF latency: 5 ms; increase in OFF peak time: 5.5 ms; increase in ON latency: 6 ms; increase in ON peak time: 5.7 ms), the differences in latency and peak time remained relatively constant (ON–OFF latency difference at high/low luminance: 5.8/6.8 ms; ON–OFF peak time difference at high/low luminance: 9.5/9.7 ms).
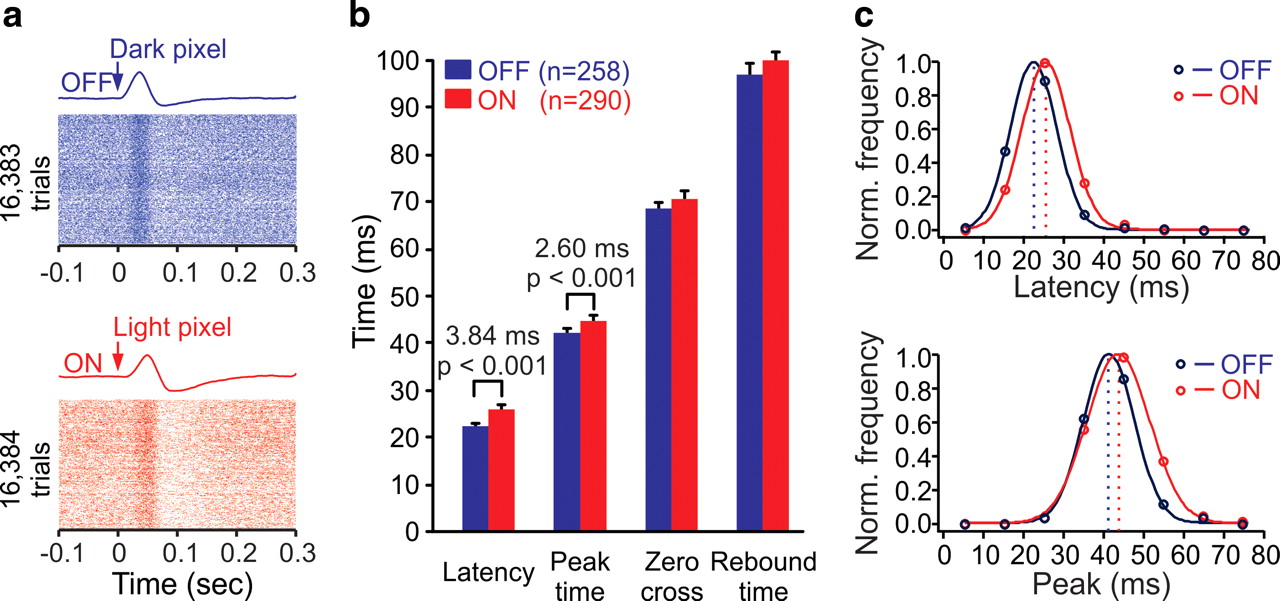
The average response latency is ∼4 ms shorter in OFF than ON geniculate cells. a, Examples of rasters and impulse responses from OFF (top) and ON (bottom) cells. The rasters are aligned with the onset of the preferred white noise pixel for each cell (the pixel with the polarity and position that generated the maximum response). Bin width for impulse responses was 1 ms. b, On average, OFF geniculate cells had shorter response latencies and peak times than ON geniculate cells (average latency difference: 3.84 ms; average peak-time difference: 2.6 ms, p < 0.001, Mann–Whitney test). Differences in zero-crossing and rebound time were not significant. Sample size: 548 LGN cells were recorded in nine different animals (OFF: n = 258, ON: n = 290). c, Distributions of response latency and peak time fitted with Gaussian functions.
Our sample of geniculate cells was recorded within 10° of the area centralis and, as expected, it was strongly dominated by X cells (Ferster, 1990). However, the sample was large enough to make statistical comparisons across cell types (X-ON: 161, X-OFF: 141, Y-ON: 66, Y-OFF: 92) and reveal faster response latencies for OFF than ON geniculate cells in both X and Y pathways (Fig. 4). Y cells showed the largest differences in both response latency (Y-ON–Y-OFF: 5.93 ms, p < 0.001; X-ON–X-OFF: 3 ms, p < 0.001, Mann–Whitney test) and peak time (Y-ON–Y-OFF: 4.56 ms, p < 0.001; X-ON–X-OFF: 1.73 ms, p = 0.073, Mann–Whitney test). Interestingly, at least within 10° of the area centralis, the differences in response latency were more pronounced between ON/OFF than X/Y pathways. The ON–OFF temporal differences within X and Y cell types could also be demonstrated by spike-trigger averaging the stimulus, although the differences within X cells were smaller in magnitude than those demonstrated with direct measurements from the PSTH (latency difference for X cells: 1.74 ms, p < 0.001; for Y cells: 6.43 ms, p < 0.001, Mann–Whitney test).

The response latency was ∼6 ms shorter in Y-OFF than Y-ON cells and ∼3 ms shorter in X-OFF than X-ON cells. a, Examples of rasters and impulse responses from all four different cell types. b, OFF geniculate cells had shorter response latencies than ON geniculate cells in both the X and Y pathways (average latency difference X-ON–X-OFF: 3.0 ms; Y-ON–Y-OFF: 5.93 ms, p < 0.001, Mann–Whitney test). This analysis included 302 X and 158 Y LGN cells (233 OFF, 227 ON).
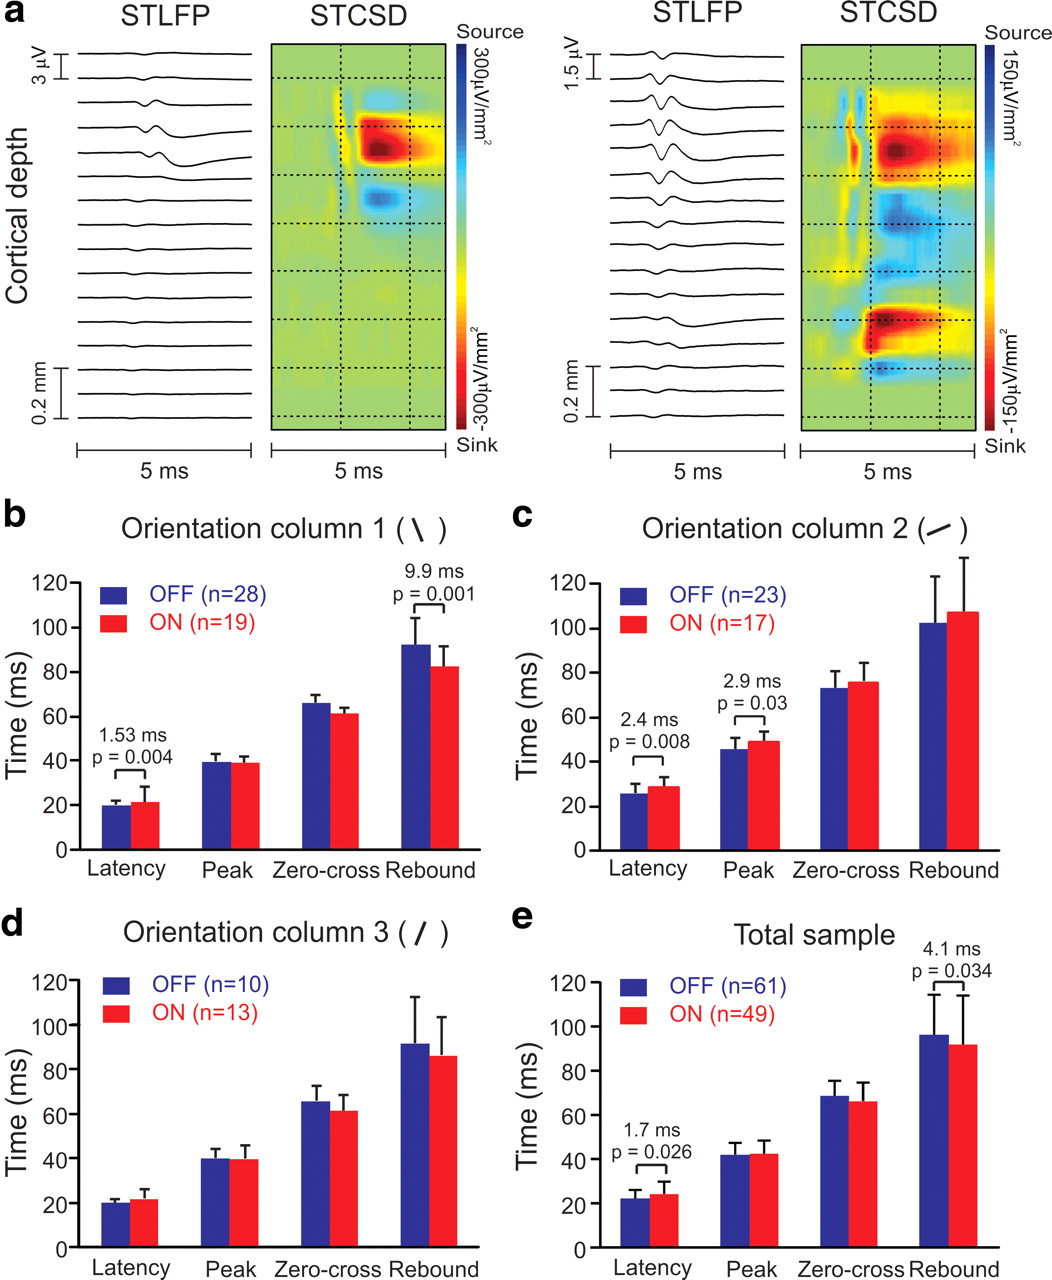
The ON–OFF differences in response latency described here could be compensated by the variability in conduction velocity among thalamocortical afferents reaching visual cortex. Therefore, an important question that needs to be addressed is whether ON–OFF latency differences can be demonstrated in geniculate cells with similar conduction times that share common cortical targets. To address this question, we recorded from populations of geniculate cells making monosynaptic connections within the same orientation column in visual cortex, as identified with methods of spike-triggered current-source density analysis (Swadlow et al., 2002; Jin et al., 2008, 2011; Stoelzel et al., 2008, 2009). In these experiments, we used a multielectrode array to simultaneously record from multiple single neurons in LGN and another array to record local field potentials through the depth of the cortex, all in precise retinotopic alignment. We selected geniculate neurons that generated significant current sinks within the same cortical orientation column in layers 4, 6, or both (Fig. 5a). We studied three cortical orientation columns in which we were able to record from enough geniculate afferents to make proper statistical analyses (n = 47, 40, 23 geniculate afferents per orientation column), all having receptive fields within <5° of the area centralis. In the two orientation columns that had more afferents sampled, we could demonstrate faster response latencies in OFF than ON geniculate afferents (Fig. 5b,c) and in one column we could also demonstrate a faster peak time (Fig. 5c). These differences in response latency were smaller than those measured in the entire population, probably due to our small sample of orientation columns, differences in eccentricity, or other factors (e.g., anesthesia, age, individual variability, sampling biases). Although no significant differences were found in zero-crossing time in any of the orientation columns studied (individually or averaged together), in one orientation column the rebound time was ∼10 ms faster in ON than OFF cells. The faster rebound time in ON geniculate neurons was demonstrated in one of the orientation columns (Fig. 5b), in the total average (Fig. 5e), and it was replicated with measurements of spike-trigger stimulus average (column 1 latency difference: 1.17 ms, p = 0.013; column 1 rebound time difference = 15.4 ms, p = 0.001; column 2 latency difference: 3.7 ms, p < 0.001; column 2 peak time difference: 2.5 ms, p = 0.025; average latency difference: 2.16 ms, p = 0.016; average rebound time difference: 6.25 ms, p = 0.011, Mann–Whitney test). Consistent with previous measurements (Cleland et al., 1976; Jin et al., 2011), the average axonal conduction time was similar in ON and OFF thalamocortical neurons (OFF average: 1.46 ms, ON average: 1.35 ms, p = 0.19, Mann–Whitney test), indicating that the differences in response latency between ON and OFF pathways are transmitted to the cortex. In summary, these experiments revealed shorter response latencies for OFF than ON visual responses among groups of geniculate afferents with similar conduction times that converge at the same cortical orientation column. Moreover, they showed that dark stimuli drive faster visual responses than light stimuli do, either through faster response increments in OFF cells (peak response) or through faster response decrements in ON cells (rebound response).

Response latency differences between OFF and ON geniculate cells making monosynaptic connection within the same cortical orientation column. a, Examples from two geniculate cells making monosynaptic connection with two different orientation columns in visual cortex. The left one made monosynaptic connection in cortical layer 4 and the right one in both layers 4 and 6. STLFP, Spike-triggered local field potential; STCSD, spike-triggered current-source-density. b–d, Measurements of response time course in three different orientation columns. In two cortical orientation columns, OFF had significantly faster response latency than ON by 1.53 ms (b) and 2.4 ms (c). In the third column (d), OFF was also faster but the difference was not significant. In two of the columns, we also found significant differences in rebound time (b) and peak time (c). e, In the total sample, the response latency was 1.7 ms shorter to the onset of dark stimuli in OFF than the onset of light stimuli in ON cells. ON cells also reduced their responses 4.1 ms faster when a light pixel turned dark than OFF cells did when a dark pixel turned light.
The impulse responses from ON and OFF geniculate neurons not only differed in their latency but also in the strength of their rebounds (Fig. 6). The average biphasic index (Cai et al., 1997), a ratio between the amplitude of the second phase (rebound) and first phase (peak) of the impulse response, was 12% significantly larger in ON than OFF neurons (OFF rebound/peak: 0.479; ON rebound/peak: 0.536, p = 0.00001, Mann–Whitney test). The average rebound index (Usrey and Reid, 2000; Alonso et al., 2001), a ratio between the area of the rebound and peak of the impulse response, was 30% significantly larger in ON than OFF neurons (OFF rebound/peak: 0.869; ON rebound/peak: 1.133, p = 0.00001, Mann–Whitney test). The stronger rebounds in ON than OFF geniculate neurons could be demonstrated with the PSTH method (Fig. 6) and with spike-triggered average (biphasic index ON/OFF: 0.47/0.43, p = 0.002; rebound index ON/OFF: 1.08/0.86, p = 0.000001, Mann–Whitney test). The rebound strengths that we measured are consistent with values reported in previous studies (Cai et al., 1997; Wolfe and Palmer, 1998; Usrey and Reid, 2000; Alonso et al., 2001) and emphasize the temporal diversity of visual responses in LGN (Wolfe and Palmer, 1998). It should be noted that, while some geniculate neurons with strong rebounds can have long response latencies (Mastronarde, 1987; Saul and Humphrey, 1990; Cai et al., 1997; Wolfe and Palmer, 1998), response latency was not correlated with rebound strength in our sample (r2 = 0.00001 for both biphasic and rebound index) and ON–OFF latency differences were also observed in cells with weak rebounds (rebound index <1; ON–OFF latency difference: 3.6 ms, p = 0.00001; ON–OFF peak time difference: 2.38 ms, p = 0.004, Mann–Whitney test). These results are consistent with the notion that dark stimuli not only generate faster responses than light stimuli but also reduce ON responses more than light stimuli reduce OFF responses (Zaghloul et al., 2003), making the integral of the impulse response larger in ON than OFF thalamic neurons.

The rebound of the impulse response is stronger in ON than OFF geniculate neurons. Top, The biphasic index (BI), calculated as a rebound/peak amplitude ratio, was 12% significantly larger in ON than OFF neurons (0.536 vs 0.479, p = 0.00001, Mann–Whitney test). Bottom, The rebound index (RI), calculated as a rebound/peak area ratio was 30% significantly larger in ON than OFF neurons (1.133 vs 0.869, p = 0.00001, Mann–Whitney test).
In contrast to the differences that we report in response timing and integral of the impulse response, ON and OFF neurons did not differ in their mean firing rates (X-ON: 13.55 spikes/s, X-OFF:12.8 spikes/s, p = 0.228, Mann–Whitney test; Y-ON: 10.64 spikes/s, Y-OFF: 10.29 spikes/s, p = 0.932, Mann–Whitney test). ON and OFF neurons did not differ in response amplitude when measured as a group (ON: 11.55 spikes/s; OFF: 12.28 spikes/s, p = 0.753, Mann–Whitney test) or among X cells (X-ON: 14.87 spikes/s, 13.68 spikes/s, p = 0.717, Mann–Whitney test), however, there was a small difference between Y-ON than Y-OFF cells (Y-ON: 9.14 spikes/s, Y-OFF: 6.52 spikes/s, p = 0.043, Mann–Whitney test). As expected, the receptive fields were ∼50% larger in Y cells than X cells (Y: 2.29°, X: 1.55°, p < 0.001, Mann–Whitney test); however, the receptive fields of all ON and OFF cells pooled together had similar sizes (ON: 1.77°, OFF: 1.77°; p = 0.27 Mann–Whitney test). When X and Y cells were considered separately, the receptive fields were 23% larger in X-ON than X-OFF cells (X-ON: 1.73°, X-OFF: 1.32°; p < 0.001, Mann–Whitney test) and 26% larger in Y-OFF cells than Y-ON cells (Y-ON: 1.9°, Y-OFF: 2.57°; p = 0.27 Mann–Whitney test).
Discussion
Our results demonstrate that visual responses reach cortex 3–6 ms faster through OFF than ON pathways, a difference that can be demonstrated in X (3 ms difference) and Y (6 ms difference) cells. In addition, we show that OFF cells have impulse responses with greater integral values than ON cells, consistent with the notion that light stimuli reduces OFF responses less than dark stimuli reduces ON responses (Zaghloul et al., 2003). Given the stimulus preferences of the ON and OFF pathways, our results demonstrate that thalamocortical processing is faster for dark than light stimuli.
Comparison with previous retinal measurements in vitro
Previous in vitro recordings in the retinas of salamanders and turtles found response latencies that were 30 ms longer (salamanders) and up to 10 times longer (turtles) in ON than OFF bipolar cells (Baylor and Fettiplace, 1977; Copenhagen et al., 1983; Shiells and Falk, 1995; Burkhardt et al., 1998; Gollisch and Meister, 2008; Burkhardt, 2011). This temporal difference was explained by the slower kinetics of the ON glutamate receptor (Nakajima et al., 1993) and the longer axons of ON bipolar cells (Euler et al., 1996), among other factors. Such temporal delay has not been demonstrated in mammals (Burkhardt, 2011). In fact, previous in vitro recordings from peripheral retina in primates found faster responses in ON than OFF retinal ganglion cells (Chichilnisky and Kalmar, 2002), suggesting either an overcompensation of the temporal delay imposed by ON bipolars or a lack of ON bipolar temporal delay in mammals. ON retinal ganglion cells are known to have larger dendritic fields than OFF retinal ganglion cells (Peichl et al., 1987; Peichl, 1989; Dacey and Petersen, 1992; Tauchi et al., 1992) and, therefore, they should receive more convergent input from photoreceptors (Field et al., 2010), which could lead to faster visual responses. However, the difference in dendritic field size between ON and OFF retinal ganglion cells is mostly observed in the far retinal periphery (>30° eccentricity) (Peichl et al., 1987; Peichl, 1989; Dacey and Petersen, 1992; Tauchi et al., 1992), where faster ON responses were reported (Chichilnisky and Kalmar, 2002). In fact, the difference in dendritic field size is linearly correlated with retinal eccentricity with a slope of 1.35 that approaches (and may even cross) zero within the central 10° (Dacey and Petersen, 1992). It is worth noting that the OFF Y cells in our sample had slightly larger receptive fields than the ON Y cells, a finding that is supported by sparse anatomical evidence from reconstructions of Y cells in central retina (Kier et al., 1995).
The previous finding that ON retinal ganglion cells responded faster than OFF retinal ganglion cells (Chichilnisky and Kalmar, 2002) led to the assumption that lights were processed faster than darks in the visual pathway and was used to explain a striking motion illusion in humans (Del Viva et al., 2006). However, previous recordings in vivo from central retina in primates (Benardete and Kaplan, 1999) and mice (Pandarinath et al., 2010) did not find evidence for faster ON responses in retinal ganglion cells of mammals. Moreover, a recent study found that humans process darks faster than lights (Komban et al., 2011). Consistently, here we demonstrate that, in central vision, OFF visual responses are faster than ON visual responses in the thalamocortical pathway. It is important to note that our results in central retina are not necessarily in contradiction with the results from Chichilnisky and Kalmar (2002) in peripheral retina. In the discussion of their paper, Chichilnisky and Kalmar (2002) mentioned a tentative observation that is very consistent with our results: shorter latencies in OFF than ON retinal ganglion cells in some of their preparations when they made measurements very close to the baseline (at 5% of maximum response).
Magnitude of ON–OFF temporal difference
Our results demonstrate that the temporal differences between ON and OFF thalamic neurons are reduced over the temporal course of the response, being most pronounced at the response onset, smaller at the response peak, and nonexistent when the response reached baseline. Neuronal convergence could play a role at reducing the temporal differences over the time course of the response, particularly at eccentricities >30°, where convergence is largest (Peichl et al., 1987; Peichl, 1989; Dacey and Petersen, 1992; Tauchi et al., 1992; Kier et al., 1995; Field et al., 2010). Consistent with this interpretation, the temporal ON–OFF differences were smaller in cortical recordings very close to the area centralis (Fig. 5) than in more peripheral locations (Fig. 2). The temporal differences between ON and OFF channels may also be compensated by the spatial arrangement of the synapses of bipolar cells on cone pedicles (DeVries et al., 2006).
Other asymmetries between ON and OFF visual pathways
The ON–OFF differences in response latency reported here add to an increasingly longer list of differences between ON and OFF pathways that include temporal properties (Chichilnisky and Kalmar, 2002; Pandarinath et al., 2010), representation of visual space (Zemon et al., 1988; Wehrhahn and Rapf, 1992; Chichilnisky and Kalmar, 2002; Ahmad et al., 2003; Jin et al., 2008, 2011; Yeh et al., 2009a; Xing et al., 2010), anatomy (Peichl et al., 1987; Peichl, 1989; Dacey and Petersen, 1992; Tauchi et al., 1992; Ahmad et al., 2003), synaptic circuitry (Pang et al., 2003; Zaghloul et al., 2003; Murphy and Rieke, 2006, 2008; Eggers et al., 2007; Molnar and Werblin, 2007; van Wyk et al., 2009), and development (Albus and Wolf, 1984; Kerschensteiner and Wong, 2008). Importantly, we show that temporal ON–OFF differences can be demonstrated at the input layers of the cortex, raising new questions about the possible role of these timing asymmetries in the segregation of ON and OFF thalamic afferents in visual cortex (McConnell and LeVay, 1984; Zahs and Stryker, 1988; Jin et al., 2008, 2011), the predominance of OFF cortical responses early in development (Albus and Wolf, 1984), and the OFF/dark dominance demonstrated in adults (Jin et al., 2008; Yeh et al., 2009a; Xing et al., 2010).
Functional significance
A few milliseconds difference in the response latency between ON and OFF pathways could have important implications in cortical processing. Thalamic neurons (Alonso et al., 1996; Yeh et al., 2009b) and fast-spiking cortical inhibitory neurons (Swadlow et al., 2002; Swadlow, 2003) generate many spikes in precise 1 ms synchrony and synchronous inputs are more effective at driving cortical targets than nonsynchronous inputs (Alonso et al., 1996; Usrey et al., 2000; Roy and Alloway, 2001; Bruno and Sakmann, 2006). Moreover, the temporal window for thalamocortical synaptic integration is <10 ms (Alonso et al., 1996; Usrey et al., 2000; Roy and Alloway, 2001; Kumbhani et al., 2007; Cardin et al., 2010) and can be limited to 5 ms by feedforward inhibition (Wehr and Zador, 2003; Wilent and Contreras, 2004, 2005).
In addition to the differences in response latency, we demonstrate that the impulse response has larger integral values in the OFF than the ON pathway. This finding is consistent with the notion that light decrements inhibit the ON channel more than light increments inhibit the OFF channel (Zaghloul et al., 2003) and raise the possibility that the larger response integral (or spike count) in the OFF channel could play a role in reinforcing the cortical representation of dark stimuli in visual cortex (Jin et al., 2008, 2011; Yeh et al., 2009a; Xing et al., 2010).
ON and OFF channels seem to be present in all animals that have eyes, from flies to humans, and some ON/OFF asymmetries are well preserved across animals. For example, in both flies and mammals, the photoreceptors connect two types of cells whose axons are longer in ON than OFF cells and segregate in different sublayers (sublayers a and b of the inner plexiform layer in humans and layers 5 and 2 of the medulla in flies) (Peichl et al., 1987; Joesch et al., 2010). In both rats and humans, ON retinal ganglion cells have larger dendritic fields than OFF retinal ganglion cells in the far peripheral retina (Peichl, 1989; Dacey and Petersen, 1992; Tauchi et al., 1992). Finally, there are 10% more Y-OFF cells than Y-ON cells in the retina, a tendency that has been consistently demonstrated in cat, ferret, mink, dog, chinchilla, and rabbit (Peichl, 1989) and that seems even more pronounced in the fovea of primates, where there are twice as many OFF diffuse bipolar cells than ON diffuse bipolar cells (Ahmad et al., 2003). Just like these anatomical asymmetries, the temporal delay of ON bipolar cells is likely to be widespread across animals, as long as mGluR6 receptors are used to generate ON responses. Therefore, since the earliest stages of visual processing, the OFF pathway seems to be wired to provide better spatial resolution and faster visual responses than the ON pathway, particularly at the center of vision. This spatiotemporal dominance in the OFF visual pathway may have evolved to process the abundance of dark stimuli in natural visual scenes (Balasubramanian and Sterling, 2009; Ratliff et al., 2010).
Footnotes
This work was supported by NIH (Grants EY005253 and MH085357). We are grateful to Jens Kremkow and Dan Butts for helpful discussions.
The authors declare no competing financial interests.
- Correspondence should be addressed to Jose-Manuel Alonso, State University of New York, State College of Optometry, 33 West, 42nd street, 17th floor, New York, NY 10036. jalonso{at}sunyopt.edu


