

Abstract
The macaque lateral intraparietal area (LIP) has been implicated in many cognitive processes, ranging from saccade planning and spatial attention to timing and categorization. Importantly, different research groups have used different criteria for including LIP neurons in their studies. While some research groups have selected LIP neurons based on the presence of memory-delay activity, other research groups have used other criteria such as visual, presaccadic, and/or memory activity. We recorded from LIP neurons that were selected based on spatially selective saccadic activity but regardless of memory-delay activity in macaque monkeys. To test anticipatory climbing activity, we used a delayed visually guided saccade task with a unimodal schedule of go-times, for which the conditional probability that the go-signal will occur rises monotonically as a function of time. A subpopulation of LIP neurons showed anticipatory activity that mimicked the subjective hazard rate of the go-signal when the animal was planning a saccade toward the receptive field. A large subgroup of LIP neurons, however, did not modulate their firing rates according to the subjective hazard function. These non-anticipatory neurons were strongly influenced by salient visual stimuli appearing in their receptive field, but less so by the direction of the impending saccade. Thus, LIP contains a heterogeneous population of neurons related to saccade planning or visual salience, and these neurons are spatially intermixed. Our results suggest that between-study differences in neuronal selection may have contributed significantly to the findings of different research groups with respect to the functional role of area LIP.
Introduction
The macaque lateral intraparietal area (LIP) has been implicated in a range of cognitive control tasks such as saccade planning (Gnadt and Andersen, 1988; Andersen and Buneo, 2002), spatial attention (Colby et al., 1996; Colby and Goldberg, 1999), decision making (Gold and Shadlen, 2007), timing (Janssen and Shadlen, 2005), working memory (Gnadt and Andersen, 1988), reward expectation (Platt and Glimcher, 1999), and even categorization (Freedman and Assad, 2006).
In the past, different hypotheses existed concerning the role of LIP activity in saccade planning and decision making (Gnadt and Andersen, 1988; Barash et al., 1991; Shadlen and Newsome, 1996; Snyder et al., 1997), as opposed to attention and visual salience (Colby and Goldberg, 1999; Bisley and Goldberg, 2003; Wardak et al., 2004; Balan and Gottlieb, 2009). A recent inactivation study suggests that distinct anatomical subdivisions of area LIP may play different roles in saccade planning and attention (Liu et al., 2010). However, much less is known about the functional heterogeneity in LIP at the single-cell level (Ogawa and Komatsu, 2009).
Many LIP studies only included neurons with specific properties such as persistent activity in the delay period of memory-guided saccades (Snyder et al., 1997; Roitman and Shadlen, 2002; Huk and Shadlen, 2005; Freedman and Assad, 2006). Other studies, however, used different inclusion criteria, e.g., “visual, delay-period, and/or saccade-related response during the memory guided saccade task” (Falkner et al., 2010, p 12788). Our goal was to investigate whether these different inclusion criteria may have influenced the results of previous LIP studies.
Importantly, other measurement techniques such as multielectrode recordings (Buschman and Miller, 2007) and awake monkey functional magnetic resonance imaging (fMRI) (Vanduffel et al., 2001) do not differentiate between cell response types. Likewise, reversible inactivation using muscimol injections (Wardak et al., 2002, 2004; Balan and Gottlieb, 2009) cannot distinguish between different neuronal subtypes in a given cortical region. The overall result of the latter techniques—be it population spiking activity, hemodynamic changes, or behavioral deficits—will likely be determined by the most prevalent neuronal subtype in the area under study, within the specific task constraints. Hence, to relate the results of single-cell recordings to the results of other measurement techniques, it is crucial to chart the properties of all visually driven neurons that are anatomically located in LIP, independent of their memory-delay activity.
Janssen and Shadlen (2005) recorded activity from LIP neurons with high levels of memory-delay activity, and found that during the waiting period before the go-signal, neurons showed anticipatory climbing activity mimicking the subjective conditional probability that the go-signal will occur. We recorded neural activity in LIP using saccade tasks probing the degree of anticipatory activity. To obtain a more uniform sample of LIP neurons, the only criterion for inclusion was spatially selective saccadic activity in a delayed, visually guided saccade task. We observed a strong heterogeneity among LIP neurons with regard to anticipatory activity, firing rate around the time of the saccade, and memory-delay activity. Thus, area LIP houses a heterogeneous population of neurons related to saccade planning or visual salience.
Materials and Methods
Subjects and surgery
All experiments were performed with three male rhesus monkeys (monkey K: 4 kg; monkey Tm, 4 kg; monkey Tb, 6 kg). After training to sit in a primate chair, a custom-made headpost was implanted on the skull using ceramic screws and dental acrylic. At least 6 weeks after surgery, the monkeys began training in passive fixation and eye movement tasks. After 2–4 months of training, a craniotomy was made, and a magnetic resonance imaging (MRI)-compatible recording cylinder (Crist Instruments) was implanted parallel to the IPS. All surgeries were performed under isoflurane anesthesia and sterile conditions. All cylinders were implanted in the left hemisphere (Horsley-Clark coordinates 10–11P, and 14–18L, Fig. 1A). To verify the recording positions, we inserted glass capillaries filled with a 2% copper sulfate solution into the recording grid (Crist Instruments) at several grid positions, acquired structural MR images (0.6 mm resolution) and reconstructed the electrode penetrations using BrainSight (Rogue Research). All procedures were performed in accordance with the National Institute of Health's Guide for the Care and Use of Laboratory Animals and were approved by the Ethical Committee at the Katholieke Universiteit Leuven Medical School.
Stimuli and tests
All stimuli were displayed on a Philips Brilliance 202P4 CRT monitor operating at 120 Hz at a viewing distance of 86 cm.
Visually guided saccade task with multiple distractors.
Monkeys had to hold fixation within a window (maximum size: 2 × 2°) around a small red spot in the center of the display for a fixed duration of 450 ms, after which a single green saccade target and four gray distractors appeared (Fig. 1B). Target and distractors were equal in size (0.25°) and luminance (6 cd/m2). The saccade target appeared either in the LIP receptive field (Target-In condition) or at the opposite position ipsilateral to the recording cylinder (Target-Out condition). The distractors appeared in the upper and lower hemifield ipsilateral and contralateral to the RF, one of them always appearing inside the RF (Fig. 1B). After a variable delay (between 500 and 2000 ms), the luminance of one of the distractors (selected at random) increased by 300%. This increase in luminance was the go-signal which indicated to the animal when to make a saccade toward the green target. Thus in Target-In trials, a saccade target, and a distractor (which could become the go-signal in 25% of the trials) appeared in the LIP RF, whereas in Target-Out trials only a distractor appeared in the RF. The monkey was rewarded for making a saccade toward the target within 500 ms after the go-signal and for holding fixation in a 3–4° window around the target for 250 ms. To encourage fast responses, reward size was governed by an exponential function of reaction time (RT) between 150 and 500 ms after the go-signal. The time between target onset and the go-signal was a random value drawn from a unimodal Weibull distribution delayed by 500 ms (Janssen and Shadlen, 2005):
 In addition to the multiple-distractor saccade task, other eye movement tasks were used, with the same stimulus-, timing-, and reward parameters. The same distribution of go-times U(t) (Eq. 1) was used in all saccade tasks.
Visually guided saccade task with single distractor.
In this version of the saccade task, a single gray distractor and one green saccade target were used, both of which could appear either inside or outside the RF after 450 ms of stable fixation of a spot in the center of the display, as described by Janssen and Shadlen (2005). Target and distractor were equal in size and luminance. Thus there were 4 conditions in this task: target and distractor in RF, target in RF and distractor out, distractor in RF and target out, and both target and distractor out of RF.
Memory-guided saccade task.
A green saccade target appeared for 200 ms after 450 ms of fixation. After disappearance of the target, the monkey had to maintain central fixation until the fixation point dimmed, hereby cueing the animal to saccade to the remembered target position. The saccade target was presented inside the RF or at the opposite location.
Passive fixation task.
After an 800 ms period of fixation, a colored grating (1.5° in diameter) was presented for 600 ms inside the RF on 80% of the trials. Interleaved with these were the other 20% of the trials where a bitmap file with the same luminance and color as the background of the monitor (and therefore invisible to the animal) was presented inside the RF of the neuron. This trial structure was used to obtain the exact same timing for both types of trials (Grating In RF vs No Stimulus in RF). The monkeys were required to keep fixating until 500 ms after stimulus offset. Reward was administered at this time.
Recording procedure.
The position of the right eye was recorded at a sampling rate of 500 Hz using an EyeLink 1000 eye tracker (SR Research). A photocell was attached to the monitor to detect the onset of a white square in the lower right corner of the screen (covered with black tape to obscure it from the monkeys' view), that appeared in the first video frame containing a stimulus (distractor, saccade target or go-signal). Tungsten microelectrodes (impedance at 1 kHz: 0.8–1.2 MΩ, FHC, Inc.) were inserted by means of a hydraulic microdrive (FHC, Inc.) through a stainless steel guide tube in a plastic grid (spacing 1 mm, Crist Instruments). Spiking activity was amplified and filtered to 300–5000 Hz. Eye position signals, neural activity, and photocell pulses were digitized and processed at 20 kHz on a digital signal processor (DSP) (C6000 series; Texas Instruments). Spikes were discriminated on-line on the DSP using a dual time-window discriminator and displayed using LabView and custom-designed software.
In a typical recording session, the electrode was lowered into the lateral bank of the IPS while the monkey made delayed visually guided saccades. We searched for responses in multiunit activity (MUA) by placing saccade targets at various locations in the contralateral hemifield. Formal testing started once a spatially selective multi- or single-unit target response was observed. Importantly, the only inclusion criterion applied was that the neuron demonstrated spatially selective saccadic activity, similar to previous studies on visual salience in LIP who have included neurons with “consistent visual, delay-period, and/or saccade-related response during the memory guided saccade task or were located between such neurons in that electrode penetration” (Falkner et al., 2010, p 12788). To verify that the recording sites were located in LIP, we also ran the memory-guided saccade task. Typically during a recording session, if possible, tasks were presented in a sequence with multiple repetitions: visually guided saccade task with multiple distractors (120 trials), passive fixation task (100 trials), memory saccade task (80 trials), visually guided saccades with single distractor (160 trials). Activity during the single-distractor visually guided saccade task was also recorded in separate sessions.
Data analysis
All data analysis (unless stated otherwise) was performed using custom-written Matlab programs.
Spike rate analyses.
The average spike rate was plotted aligned with target onset including all spikes up to 50 ms after the go-signal, to ensure that the spike rate did not contain any effect from the go-signal or saccade execution. For each recording site, the spatial selectivity of the response was tested using t tests comparing mean spike rate after target onset (0–200 ms), to baseline (200 ms before target onset). The population response latency was defined as the center of the first of two consecutive 5 ms bins showing significant increases in the population response compared with the first bin after stimulus-onset. In all latency calculations we took into account the time difference between the onset of the stimulus on the display and the onset of the white square at the bottom of the display detected by the photocell (maximally 8.3 ms given the refresh rate of 120 Hz). The selectivity latency of the population was defined as the center of the first of two consecutive 5 ms bins with significant differences in spike rates between Target-In and Target-Out trials. p-values were Bonferroni-corrected to account for multiple comparisons in 20 bins after target-onset (α = 0.0025). Response latency and selectivity latency were also calculated for single sites using t tests on 20 ms bins. Tests for significant differences between conditions were performed using t-statistics on the average activity between 0 and 500 ms after stimulus onset. We also analyzed the LIP responses aligned on saccade onset and aligned on the go-signal. Presaccadic enhancement was tested by comparing activity in the interval 320–160 ms before RT with activity in the 160 ms interval before RT.
To test for delay activity during the memory-guided saccade task, spike rates were analyzed as done by Janssen and Shadlen (2005): for every recording site, the average baseline activity (at −300 to 0 ms) was subtracted. The resulting net spike rates were normalized to the average activity between 320 and 1320 ms. The level of memory-delay activity was quantified by dividing the delay period activity (320–720 ms after target onset) by the visual activity (0–320 ms after target onset).
Reaction time and neural response fitting.
RT was defined as the time point when the velocity of the eye trace exceeded five times the SD of the velocity in the interval from 700 to 100 ms before the go-signal (typically in the range of 120–170° per second). Both RT and spike rate data were calculated in 80 ms bins, and plotted as a function of time after target onset.
To capture the diversity of the neural population with respect to anticipatory climbing activity, the neural responses [single-unit activity (SUA) and MUA] were fitted with a weighted sum of two functions: the subjective hazard rate associated with a unimodal distribution of go-times, and an exponential distribution with a mean of 0.2. RT data were fitted with the same combination of functions to quantify the decrease in RT over time as described by Janssen and Shadlen (2005). The combination of these two functions was chosen because of their distinct patterns: while the exponential function [E(t)] decreases over time, the unimodal hazard rate function [Auni(t)] increases (Fig. 1C). Since we used only a single time schedule for the go-signal—a unimodal distribution between 500 and 2000 ms (Eq. 1)—the weights of these two functions described four possible response patterns (Fig. 1D): climbing activity (positive weight for the subjective hazard and negative weight for the exponential), a decline in activity (negative weight for the subjective hazard and positive weight for the exponential), an initial decline followed by a rise in activity (positive weights for both functions), or an initial rise followed by a decline (negative weights for both functions). Only spike rate data between 280 and 920 ms after target onset were fitted, to avoid any influence from the visual transient, and to include as many trials as possible (85% of trials had a go-time exceeding 920 ms). RT data between 520 and 1240 ms were fitted, since the go-signal never appeared before 500 ms. The exponential function was normalized to its maximum value between 280 and 920 ms for spike rates and between 520 and 1240 ms for RT, so that the function ranged from 0 to 1. The subjective hazard rate associated with the unimodal time schedule was calculated as done by Janssen and Shadlen (2005), and was also normalized to its highest value. The coefficient of variation, Φ, is the Weber fraction for time estimation, and was set at 0.25. Spike rates and RT data were fitted using a weighted sum of the subjective hazard rate Auni(t) and the exponential function E(t):
 where R is the neuronal response or RT, wc is a constant term, and wuni and wexp are the weights for the unimodal anticipation function and the exponential function, respectively, with Auni delayed by time shift τ, which was fixed at −0.1 s. ε represents noise, which is assumed to be Gaussian with uncertainty derived from the sample means. We used a maximum-likelihood fitting procedure to obtain the fits, parameter estimates and their SEs. SEs of parameters were estimated from the Hessian matrix of second partial derivatives of the log likelihood and were used for significance values cited throughout the paper.
Correlation neural activity/RT.
We calculated the trial-by-trial correlation between RT and the spiking activity around the time of the go-signal (−150 to 50 ms). Because both neural activity and RT can increase or decrease over time and can therefore exhibit spurious correlations, we “detrended” the neural activity by trialwise subtracting the mean spike rate across trials for this trial's time bin. The same detrending procedure was used for RT.
Results
The crosshairs in Figure 1A show representative recording sites, demonstrating that neural activity was recorded in a large part of LIP: from posterior to anterior LIP, and in both dorsal and ventral LIP (Lewis and Van Essen, 2000). We recorded spiking activity in 188 responsive LIP sites (70 in monkey Tm, 88 in monkey Tb, and 30 in monkey K). SUA was recorded in 140 sites, and MUA in 48 sites (all in monkey Tb in the multiple-distractor task).

Methods and recording area. A, Coronal MR images representing the most anterior to the most posterior LIP recording positions. Crosshairs show representative recording sites. The A-P levels (Horsley-Clark coordinates) are indicated in the lower right corner of each image. B, Visually guided saccade task with multiple distractors. After a fixed period of fixation, 4 gray distractors and one green saccade target appeared. The target was either positioned inside the LIP RF (dotted circle), or on the contralateral side. After a random period of fixation, one of the distractors brightened, indicating to the monkey to make a saccade to the green target (represented by arrow). C, Time courses of the exponential function E(t), capturing a decline in activity over time, and of the subjective anticipation function associated with a unimodal distribution of go-times Auni(t), capturing an increase in activity over time. D, Time courses of the weighted combination of E(t) and Auni(t) for different combinations of unimodal and exponential weights.
Multiple-distractor task
One hundred fourteen neurons were tested in two monkeys during the visually guided saccade task with multiple distractors (88 in monkey Tb, 26 in monkey Tm). In keeping with previously published data (Janssen and Shadlen, 2005), both monkeys clearly anticipated the dimming of the go-signal: both animals showed shorter RTs for long trials compared with short trials (∼60 ms for monkey Tb and 30 ms for monkey Tm) (Fig. 2). To quantify these results, RT data between 520 and 1240 ms after target onset were fitted with a weighted combination of an exponential function, capturing the decline in RT over time toward a constant level, and an anticipation function based on the subjective hazard associated with a unimodal distribution of go-times, which rises over time (Fig. 1C). Both monkeys showed significantly positive weights for the exponential distribution (wexp = 49.12 ± 1.79 for monkey Tm and wexp = 20.83 ± 1.08 for monkey Tb, R2 ≥ 0.96 for both animals), indicating that the pattern of RTs mirrored the monotonically decreasing exponential function (between 0.52 and 1.24 s). The unimodal weights were significantly smaller than the exponential weights in both monkeys (24.77 ± 1.76 for monkey Tm and −56.79 ± 1.08 for monkey Tb). Note that the mean RT across trials was shorter for monkey Tm compared with monkey Tb (t test, p < 0.01). Overall, the behavioral data were in line with a previous study (Janssen and Shadlen, 2005) showing that monkeys exploit knowledge about the conditional probability that the go-signal will occur, given that it has not yet occurred (the hazard rate).

Behavior. Average reaction time is plotted as a function of time after target-onset (80 ms bins). Upper line shows data for monkey Tb, lower line for monkey Tm. Line thickness represents SEs. Black lines represent the fits with the linear combination of E(t) and Auni(t) between 520 and 1240 ms.
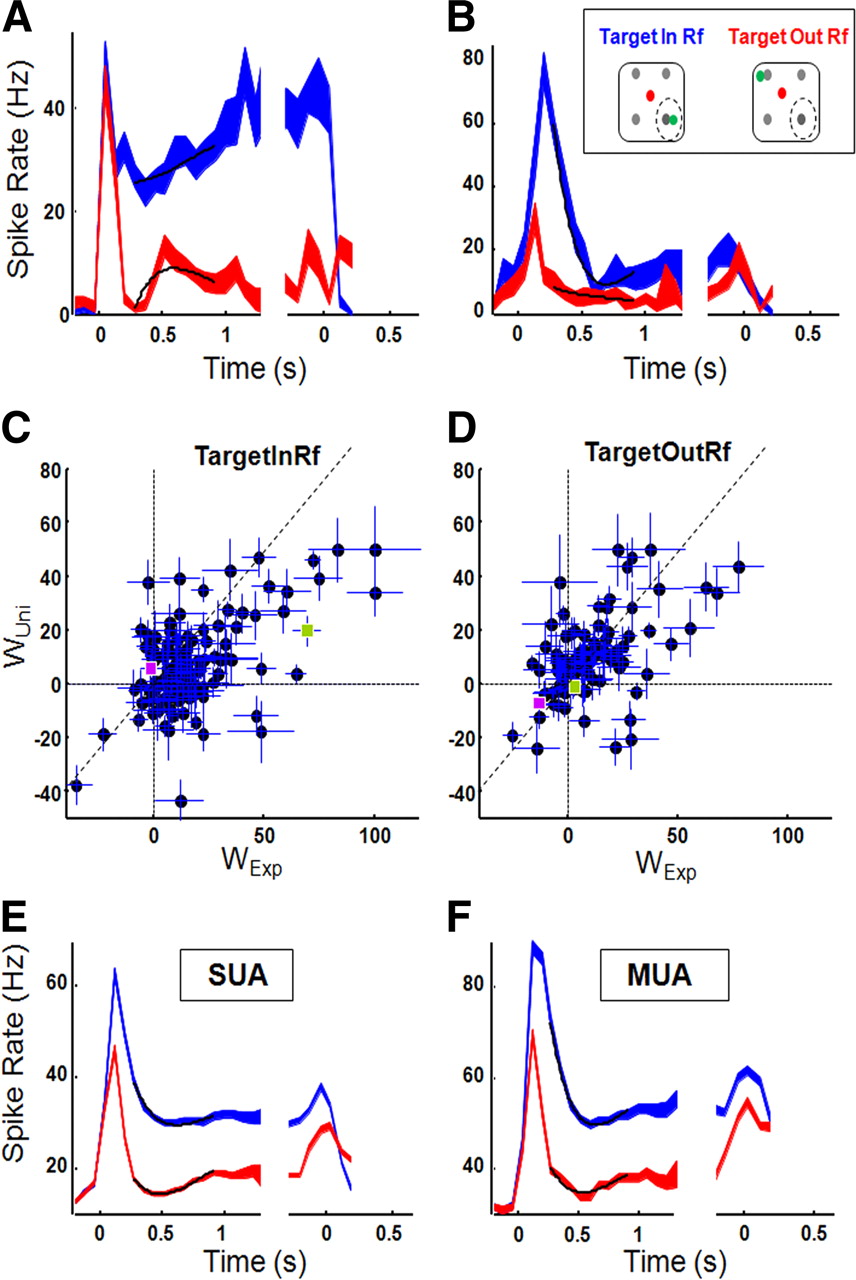
We observed a striking variability among LIP neurons in their levels of anticipatory activity. The example neuron in Figure 3A showed strong anticipatory climbing activity starting ∼300 ms after the onset of the saccade target in the RF of the neuron: within the interval 300–1500 ms after target onset (the waiting period), the spike rate rose from 26 spikes/s to 40 spikes/s. Consistent with Janssen and Shadlen (2005), the appearance of the distractor alone (Target-Out condition) evoked a much lower response and no climbing activity. The response difference between Target-In and Target-Out trials persisted until the time of the saccade (t test, p < 0.001). In contrast, the example neuron in Figure 3B showed very little climbing activity: although the initial response was substantially stronger in Target-In trials compared with Target-Out trials—as was the case for the neuron in Figure 3A—the activity declined monotonically for longer trial durations in both Target-In and Target-Out conditions. Furthermore, around the time of the saccade, the activity during Target-In trials was quite similar to that in the Target-Out trials (t test, n.s.). These two neurons represent examples of two markedly different response profiles: sustained and anticipatory activity linked to the direction of the upcoming saccade, versus a more transient response evoked by the onset of the highly salient saccade target inside the RF, with elapsed time or saccade direction having little impact.

Multiple-distractor task. A, Example neuron showing climbing activity over time for Target-In trials (blue) but not for Target-Out trials (red). Activity is aligned on target-onset (left) and RT (right). Black lines represent fits with the weighted combination of E(t) and Auni(t), line thickness represents SEs. B, Example neuron showing lack of climbing activity. Same conventions as in A. C, D, Unimodal and exponential weights (±SE) for all recording sites, separately for Target-In (C) and Target-Out (D) conditions. Example neuron 1 is indicated in purple, example neuron 2 in green. Diagonal lines represent unity lines. E, F, Average neural responses for SUA (E, n = 66) and MUA (F, n = 48) separately.
The response pattern of the second example neuron was more frequently observed among our population of LIP neurons. To capture differences in the neural modulations in the waiting period before the go-signal, we fitted the LIP responses as we did for RT. Neurons showing climbing activity are expected to have positive weights for the unimodal anticipation function, whereas an exponential decline in the response toward a constant level would be manifested by a positive weight for the exponential distribution. For Target-In trials, the two spike rate functions in Figure 3, A and B, differed markedly in both their exponential and unimodal weights. The neuron in Figure 3A was dominated by the rising anticipation function, represented by the positive unimodal weight, particularly for Target-In trials (Fig. 3C,D; wexp = −1.37 ± 4.80 and wuni = 6.12 ± 4.52 for Target-In trials, wexp = −12.7 ± 2.10 and wuni = −6.92 ± 2.56 for Target-Out trials, represented in purple), whereas the neuron in Figure 3B showed mainly an exponential decline in firing rate, followed by a slight rise in activity toward the end of the waiting period. This was captured by the large positive exponential weight and the (smaller) positive weight of the unimodal anticipation function (Fig. 3C,D; wexp = 69.4 ± 6.37 and wuni = 19.61 ± 5.47 for Target-In trials; wexp = 3.42 ± 4.60 and wuni = −1.07 ± 3.27 for Target-Out trials, represented in green). Both neurons were strongly influenced by the position of the saccade target and fired much more strongly when the saccade target appeared in the RF.
We computed the exponential and unimodal weights for all our recording sites of the multiple-distractor task (both SUA and MUA, n = 114). Figure 3, C and D, compares the unimodal and exponential weights for every recording site for Target-In and Target-Out conditions separately. Most data points are located below the diagonal, indicating a decline in the firing rates during the waiting period (median wexp = 11.54 ± 8.83; median wuni = 5.98 ± 4.07). A fraction of the neurons (monkey Tm: n = 16 of 26, monkey Tb: n = 11 of 88; 24% of all recording sites) showed anticipatory climbing activity (wuni > wexp) as did the example neuron in Figure 3A. Although other response patterns (wuni < 0; wexp < 0) were less frequently encountered, every quadrant in the scatter plot in Figure 3, C and D, contained neurons, which illustrates the diversity of LIP responses in a visually guided delayed saccade task. The scatter plots for SUA and MUA separately were virtually indistinguishable (data not shown). On average, at least in this population of LIP neurons, saccades toward the RF did not evoke more climbing activity than saccades outside the RF (Target-Out: median wuni = 6.70 ± 8.63, Wilcoxon: n.s.). The large response differences between Target-In and Target-Out trials were captured by a significant difference in the constant term in Equation 2 (median wc = 27.14 ± 3.32 for Target-In trials compared with 12.98 ± 1.82 for Target-Out trials, p < 0.001). Overall, the weighted sum of the unimodal anticipation and exponential functions provided an accurate description of the spike rate functions for 96.7% of the neurons in the Target-In condition (median R2 = 0.80; interquartile range: 0.63–0.93), and for 97.5% of the neurons in the Target-Out condition (median R2 = 0.74; interquartile range 0.50–0.91).
Figure 3, E and F, shows the average response for all LIP sites we recorded, for SUA and MUA sites separately. The average single-unit response (Fig. 3E, n = 66) reflected the preponderance of declining neural activity after the initial visual transient, which obscured any rising activity taking place in the subpopulation of LIP neurons that behaved like the example neuron in Figure 3A: for both Target-In and Target-Out trials, the average response rose shortly after stimulus onset (latency = 47.5 ms), declined monotonically in the interval [150–500 ms] after stimulus onset, and fell to a fairly constant level of activity for the remainder of the waiting period (Target-In: wuni = 5.89 ± 1.14; wexp = 13.60 ± 1.27; Target-Out: wuni = 7.99 ± 0.80; wexp = 6.39 ± 0.88). The average MUA (n = 48, Fig. 3F) was quite similar to the average SUA: Target-In conditions were dominated by the greater exponential weight, resulting from the sharp decrease in activity after the visual transient. For Target-out conditions, the exponential and unimodal weights did not differ significantly, indicating a slight decrease in activity followed by a similar increase (Target-In: wuni = 11.68 ± 1.53; wexp = 32.14 ± 2.03; Target-Out: wuni = 7.60 ± 1.32; wexp = 9.67 ± 0.83). The strong similarity between the average SUA and MUA argues against the possibility that we inadvertently missed climbing activity present in small spikes (from putative interneurons).
We obtained a unimodal distribution for our measure of climbing activity (wuni − wexp), with a mean of −9.87 and a SD of 19.13 (Fig. 4A, inset; Hartigan's dip test for bimodal distribution: 0.02, p = 0.996). Figure 4, A and C, shows the average spike rate for all recording sites for which the difference between the unimodal and exponential weight was positive, indicating climbing activity, for the two monkeys separately (monkey Tb: n = 11 of 88, monkey Tm: n = 16 of 26; 24% of all recording sites). When the saccade target appeared in the RF, the average spike rate increased from ∼36–38 spikes per second ∼450 ms (after the decline of the initial transient) to ∼52 spikes per second ∼1200 ms in both animals, which is comparable to data reported in Janssen and Shadlen (2005). Moreover, the degree of climbing activity was weaker—though still significantly greater than zero (Table 1: both monkeys combined)—for Target-Out trials, which also replicates the findings of Janssen and Shadlen (2005). For the majority of sites, however (monkey Tb: n = 77 of 88, monkey Tm: n = 10 of 26; 76% of all recording sites), the unimodal weight was smaller than the exponential weight, indicating an exponential decline in activity toward a constant level during the waiting period. Figure 4, B and D, illustrates that for the population of neurons for which wexp > wuni, the spike rate stayed roughly constant between 450 and 1200 ms for Target-in trials. Note that baseline activity is higher in the latter population of neurons for monkey Tb, due to the larger number of MUA sites.

Multiple-distractor task: average spike rate for anticipatory and non-anticipatory neurons for both monkeys separately. A, Average spike rate for neurons showing climbing activity, for monkey Tb (n = 11). Target-In trials are shown in blue, Target-Out trials in red. Activity is aligned on target-onset (left) and RT (right). Line thickness represents SE. Inset represents distribution of our measure of climbing activity (wUni − wExp) for neurons in both monkeys. B, Average spike rate for neurons not showing climbing activity, for monkey Tb (n = 77). C, Average spike rate for neurons showing climbing activity, for monkey Tm (n = 16). D, Average spike rate for neurons not showing climbing activity, for monkey Tm (n = 10).
Multiple-distractor task: fitting parameters
The proportion of anticipatory neurons (wuni > wexp) was significantly larger in monkey Tm (61%) than in monkey Tb (13%, χ2: p < 0.01). It is difficult to ascertain whether this difference represents genuine interindividual differences in the proportion of anticipatory neurons between animals. Alternatively, subtle differences in recording positions, behavioral differences between the animals (monkey Tm exhibited faster RTs than monkey Tb), or simply the relatively small sample sizes, could have contributed to the observed difference in the proportion of anticipatory neurons. However we recorded an additional 51 neurons in monkey Tm using the single-distractor task (described below) and obtained a proportion of anticipatory neurons which was similar to the proportion in the multiple-distractor task (41%, χ2 test, n.s.). We calculated the correlation between our measure of climbing activity (wuni − wexp) and the depth of the recording site measured as the distance between the recording site and the depth of the first spikes recorded in each session (in dorsal LIP). Both monkeys showed a positive correlation between anticipatory activity and recording depths, indicating that anticipatory neurons tended to be located more ventrally in LIP (Tb: r = 0.21, p = 0.05; Tm: r = 0.22, p = 0.05). Furthermore, the correlation between wuni − wexp and the anterior–posterior recording position in the grid was negative in one monkey (Tb: r = −0.24, p = 0.03, Tm; r = −0.01, p = 0.90), indicating that anticipatory neurons were found more often in posterior LIP. Overall, a population of LIP neurons selected on the basis of spatially selective saccadic activity showed a variety of response patterns; anticipatory climbing activity that mimics the conditional probability that the go-signal will occur was present in a subset of LIP neurons, but other LIP neurons did not modulate their firing rates as a function of elapsed time.
Anticipatory and non-anticipatory LIP neurons also differed markedly in their levels of activity for Target-In and Target-Out trials immediately before the saccade. Although both subpopulations of LIP neurons discriminated between Target-In and Target-Out trials, anticipatory neurons preserved this response difference until the saccade, whereas non-anticipatory neurons did not. In anticipatory neurons, the spike rate immediately before the saccade (−80 to 0 ms) was much higher for Target-In than for Target-out trials (by ∼22 spikes/s for both monkeys). In non-anticipatory cells however, the difference between Target-In and Target-Out trials was much smaller than in anticipatory neurons (∼6 spikes/s for both monkeys) (ANOVA on spike rate [−80 to 0 ms] before RT with factors cell type and trial type; interaction: p < 0.001 for both monkeys). Thus, immediately before the saccade, the direction of the impending saccade (toward or away from the RF) influenced the anticipatory neurons much more strongly compared with the subpopulation of non-anticipatory LIP neurons.
In the multiple-distractor saccade task, the go-signal indicating to the monkey to make an eye movement toward the (green) saccade target consisted of the brightening of one of the (gray) distractors. This go-signal could occur in one of four possible positions, either inside (1/4 of the trials) or outside the RF (3/4 of the trials) of the LIP neuron. To investigate the difference between anticipatory and non-anticipatory neurons in more detail, we analyzed the responses of these two subpopulations aligned on the time of the go-signal and separately for the four possible go-signal positions (Fig. 5A,B). When the go-signal occurred outside the RF (Fig. 5A,B, 3 rightmost panels), both populations of neurons showed a moderate increase in activity for both Target-In and Target-Out trials. Regardless of the spatial location of the go-signal, the activity for Target-In trials was higher than for Target-Out trials, but anticipatory neurons showed much larger response differences for Target-In versus Target-Out trials than did non-anticipatory neurons (ANOVA on the mean activity [0–200 ms] after the go-signal, with cell type and trial type as factors, interaction p < 0.05). When the go-signal appeared inside the RF, both anticipatory and non-anticipatory neurons fired strongly in response to the brightening of the distractor (Fig. 5A,B, leftmost panel), consistent with previous findings (Robinson et al., 1995; Powell and Goldberg, 2000). Interestingly, non-anticipatory neurons showed a marked reversal in neural selectivity around the time of the saccade caused by the go-signal, firing more strongly when the saccade was directed away from the RF compared with when the saccade was directed toward the RF (t test, p < 0.01). In contrast, anticipatory neurons showed similar levels of activity for Target-In and Target-Out trials when the go-signal appeared in the RF of the neuron. Clearly, the “priority” of our subpopulation of non-anticipatory LIP neurons temporarily shifted to the location where the highly salient go-signal appeared opposite to the planned saccade direction, whereas anticipatory neurons showed a more balanced representation of target- and go-signal locations immediately before the saccade.

Spike rate activity aligned on the go-signal for each go-signal position. The top row shows the 4 possible go-signal (= brightening of the distractor) positions. A, Average spike rate activity for anticipatory neurons. B, Average spike rate activity for non-anticipatory neurons. Target-In trials are shown in blue, Target-Out trials in red. Line thickness represents SE.
Consistent with previous research (Bisley et al., 2004), the LIP population responses for both Target-In and Target-Out trials exhibited a very short latency of 47.5 ms. More importantly, both SUA and MUA discriminated between Target-In and Target-Out trials as early as 52.5 ms after stimulus onset (t test on the average SUA and MUA separately, p < 0.05), in line with the 50 ms selectivity latency of the fastest LIP neurons recorded by Buschman and Miller (2007). Our short population latencies were confirmed by calculations of the neural selectivity latencies (Target-In versus Target-Out) of individual recording sites (t tests on 20 ms bins): the fastest LIP neurons (fifth percentile) showed selectivity latencies of 50 ms [median selectivity latency: 150 ms]. Note that Buschman and Miller reported a population selectivity latency of ∼100 ms (Miller and Buschman, 2007), which is much later than the 47.5 ms reported here. However, unlike Buschman and Miller (2007), we did not include nonresponsive LIP neurons in our population, and we always optimized the position of the target in the center of the RF. Both of these factors may have contributed to the faster population selectivity latency we observed compared with Miller and Buschman (2007). Overall in both our study and Buschman and Miller (2007), the earliest LIP neurons started to signal the presence of the saccade target ∼50 ms after target onset. Thus the average response of our population of LIP neurons, selected exclusively on the presence of spatially selective saccadic activity and recorded along a considerable extent of the lateral bank of the IPS, signaled the spatial location of the saccade target at very short latencies.
Our sample of LIP neurons showed spatially selective saccadic activity; hence our selection was still biased toward responsive LIP-neurons. Single or multiunit activity was also recorded from 14 nonresponsive LIP-neurons, which were located in between neurons showing target-selective responses, and we found that activity for these neurons significantly decreased after target-onset. As these neurons did not show an excitatory response to any of our stimuli, we cannot describe the properties of spiking activity.
The firing rates of LIP neurons around the time of the go-signal can be negatively correlated with RT in a delayed saccade task (Janssen and Shadlen, 2005). A similar analysis on our population of LIP neurons revealed that on average, the spike rate around the time of the go-signal did not correlate with RT (Target-In: median r = 0.02, Wilcoxon signed rank test, p = 0.88; Target-Out: median r = −0.02, Wilcoxon signed rank test, p = 0.70), and only a very few neurons (Target-In: n = 7 of 114, Target-Out: n = 3 of 114) showed significant negative correlations between spike rate and RT (p < 0.05).
Single-distractor task
The multiple-distractor experiment differed from that described by Janssen and Shadlen (2005) by the appearance of four distractor stimuli in the visual field (one of which always appeared in the RF). In the Janssen and Shadlen (2005) paradigm, only a single distractor appeared, either inside or outside the RF. Furthermore Target-In trials were not visually identical to Target-Out trials due to the appearance of a saccade target and distractor inside the RF in the Target-In trials, versus only a distractor in Target-Out trials. To exclude the possibility that anticipatory climbing activity was somehow diminished by the presence of these four stimuli in the ipsi- and contralateral hemifield, and to obtain more visually matched Target-In and Target-Out trials, we recorded single-unit (n = 84) activity in 3 monkeys (Tm: n = 51, Tb: n = 3 and K: n = 30) during the single-distractor task (see Materials and Methods). The average SUA in the single-distractor experiment appeared very similar to the neural activity in the multiple-distractor experiment (Fig. 6): a brisk response to stimulus onset, stronger for Target-In trials than for Target-Out trials, followed by a decline and a largely constant level of activity during the remainder of the waiting period. Although climbing activity was present in individual neurons (n = 39 of 84, 46%), on average the LIP spiking activity did not rise during the waiting period (Target-In, Distractor-In: wuni = 4.8 ± 1.5; wexp = 7.7 ± 1.7; R2 = 0.96). Importantly, we included results from a third monkey for this task, and as with the other subjects, we found a range of anticipatory climbing activity: 17 neurons (57%) showed anticipatory activity (wuni > wexp), while 13 single cells did not. Note that on average, LIP neurons did not discriminate between trials in which only the saccade target appeared in the RF and trials in which saccade target and distractor appeared in the RF (p = 0.59), consistent with previous findings (Janssen and Shadlen, 2005). The appearance within the RF of the distractor, identical in size and luminance to the saccade target, evoked a significantly smaller response than the presentation of the target in the RF (t test, p < 0.001). In a manner similar to the multiple-distractor experiment, the average LIP firing rate started to discriminate between target and distractor in the RF at 47.5 ms after stimulus onset. Hence the results of the single-distractor experiment confirmed our findings in the multiple-distractor experiment.

Single-distractor task. Average spike rate aligned on target onset (left) and reaction time (right) for trials with target and distractor in the RF (blue), target only in the RF (green), distractor only in the RF (red) and no stimulus in the RF (gray). Line thickness represents SE, black lines show the fits with the weighted combination of E(t) and Auni(t). T, Target; D, distractor.
The average response difference between Target-In and Target-Out trials was much smaller in the single-distractor experiment (8 spikes/s) compared with the multiple-distractor experiment (16 spikes/s), primarily as a consequence of a weaker response to the distractor in the RF in the multiple-distractor task (compare Fig. 3E with Fig. 6). These results suggest that the presence of additional distractors outside the RF in the multiple-distractor experiment exerted some inhibitory influence on the firing rate of the LIP neurons when the saccade target appeared outside the RF (Falkner et al., 2010).
Memory-guided saccades
Our population of LIP neurons was not selected based on their levels of memory-delay activity. Instead, we recorded from all LIP neurons with spatially selective saccadic activity. To verify that our recording sites were located within LIP we recorded activity during the memory-guided saccade task (Hikosaka and Wurtz, 1983) in a subpopulation of our neurons (SUA, n = 32; MUA, n = 52). One example neuron is shown in Figure 7A. This neuron showed persistent memory-delay activity throughout the entire memory period (∼25 spikes/s) until the monkey made a saccade to the remembered target location. The second example neuron (Fig. 7B) did not show memory-delay activity: after the initial increase in spike rate, the response decreased to the baseline level (∼1–2 spikes/s). To characterize a site based on its level of memory-delay activity, we calculated a memory index (MI) by dividing the average activity during the delay period (320–720 ms after target onset) by the average spike rate during the visual period (0–320 ms after stimulus onset) (Janssen and Shadlen, 2005). The inset in Figure 7C shows the distribution of MI for our population of neurons (mean: 0.52, SD: 0.63, Hartigan's dip test: 0.04, p = 0.39). One-quarter of the neurons tested (21 of 84, 25%) showed robust memory-delay activity throughout the waiting period (MI > 0.6). The presence of neurons showing persistent activity during the delay period in a memory-guided saccade task is typical of area LIP (Gnadt and Andersen, 1988). The majority of our neurons (n = 63, 75%), however, although anatomically located within the lateral bank of the IPS between cells displaying memory-delay activity, did not themselves show robust persistent memory-delay activity (Fig. 7D). For the latter type of neurons, the average activity declined toward the level of the Target-Out trials after the initial visual transient. Neurons with and without persistent memory-delay activity were recorded in the same recording positions, and frequently even in the same recording session. These results confirm that our recording sites were located in area LIP.
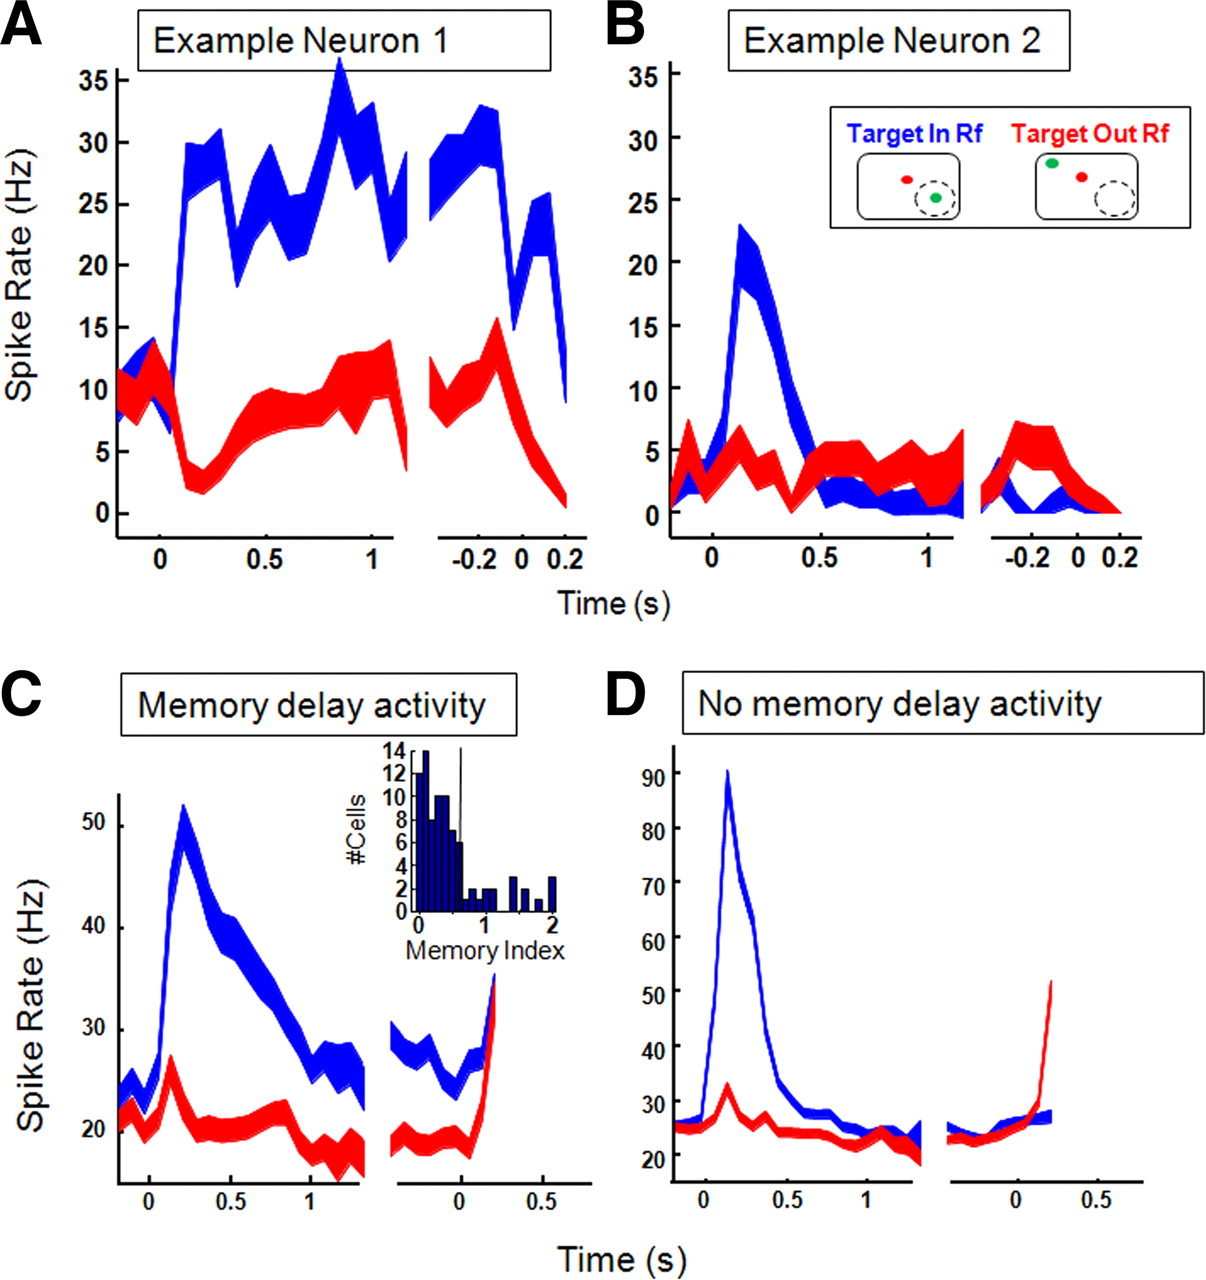
Memory-guided saccade task. A, Example neuron showing strong memory-delay activity (MI > 0.6). Average spike rate is aligned on target onset (left) and reaction time (right). Target-In trials are shown in blue, Target-Out trials in red. Line thickness represents SEs. B, Example neuron 2 showing no memory-delay activity. C, Average spiking activity for all neurons with MI ≥ 0.6 (n = 21). Inset shows the distribution of the MI for all recording sites, truncated at 2. Vertical black line at 0.6. D, Average spiking activity for all neurons with MI < 0.6 (n = 63).
Note that, although there was no visual stimulus present in the LIP RF when the target was briefly flashed in the opposite hemifield (Target-Out trials), the average spike rate activity showed a small transient response after target onset (Fig. 7C,D). Plotting the average spike rates for SUA and MUA separately showed that this increase arose from our population of MUA sites (data not shown).
We obtained memory-saccade data in only a subset of our recording sites, which did not include our strongest anticipatory sites. Combining our dataset (n = 32) with neurons recorded in the same tasks (P. Janssen and M. N. Shadlen, unpublished observations, n = 28) yielded a significant positive correlation (r = 0.30, p < 0.05) between the MI and the amount of anticipatory activity (captured by wuni − wexp). (The correlation was positive but did not reach significance in either population alone). Although the variability in the levels of both memory activity and anticipatory activity was quite high, anticipatory climbing activity was less commonly observed in LIP neurons with weak memory-delay activity (MI < 0.6; 8%) compared with neurons that did show robust memory activity (MI > 0.6; 28% of the neurons).
Passive fixation task
The increase in spike rate during the waiting period in visually guided saccades as described by Janssen and Shadlen (2005) might be due to an expectation of reward, instead of the anticipation of the go-signal. To exclude this possibility, we tested 84 responsive LIP sites in a passive fixation task (SUA: n = 38, MUA: n = 46), in which either an isoluminant grating was presented in the RF (in 80% of the trials) or no visual stimulus (in 20% of the trials), in interleaved trials. The time structure of the passive fixation trials was fixed: 800 ms of fixation followed by a fixed period of 600 ms stimulus presentation (see Materials and Methods). Reward was administered at a fixed time 500 ms after stimulus offset.
Figure 8 shows the average spike rates during passive fixation for neurons with anticipatory climbing activity during the saccade task (an increase averaging 15 spikes/s in the interval [400–1200 ms] after target onset, n = 10; data not shown) and non-anticipatory neurons (n = 74). Both populations of neurons responded to the appearance of the grating and to stimulus offset, but in the interval after stimulus offset—when the animal fixated the central spot and delivery of the reward was imminent—the spike rate declined again.

Passive fixation task. A, Average spike rate for neurons with anticipatory spiking activity during the multiple-distractor saccade task (n = 10), aligned on distractor onset. B, Average spike rate for neurons without anticipatory activity in the multiple-distractor saccade task (n = 74). Trials with grating in RF are shown in red; trials without visual stimulation are shown in blue. Vertical black lines represent stimulus-offset. Line thickness represents SEs.
The passive fixation task does not have the same attentional demands as the saccade tasks, and it is possible that the monkeys were reflexively planning eye movements during this task. However, for both the saccade and the passive fixation task, the monkeys expected reward at the end of the trial. Thus the absence of climbing activity during passive fixation trials strongly suggest that the increase in spike rate over time during saccade tasks in our anticipatory neurons and in Janssen and Shadlen (2005) is indeed reflecting the anticipation of the go-signal, not the upcoming reward.
Discussion
LIP neurons exhibit a marked heterogeneity in the amount of anticipatory climbing activity they display. Although a subset of LIP neurons modulated their firing rates in anticipation of the go-signal, the average LIP response declined exponentially after the initial visual transient, toward a constant level of activity. Anticipatory and non-anticipatory neurons also differed in their presaccadic and memory-delay activities. Our findings suggest that LIP neurons exhibit varying degrees of anticipatory planning and visual activity.
In Janssen and Shadlen (2005), the majority of LIP neurons displayed modulations that mimicked the subjective hazard rate of the go-signal. The latter study—as well as numerous other LIP studies (Snyder et al., 1997; Roitman and Shadlen, 2002; Huk and Shadlen, 2005; Freedman and Assad, 2006)—recorded sites in LIP with high persistent activity during the waiting period of memory saccades. We recorded from LIP neurons showing spatially selective saccadic activity regardless of their memory-delay activity. All neurons were recorded in the posterior part of the lateral bank of the IPS at or near sites where memory-delay activity could be observed, a search strategy akin to many LIP studies on visual attention and salience, which have included neurons showing “consistent visual, delay-period, and/or saccade-related response during the memory guided saccade task” (Falkner et al., 2010, p 12788). Our search strategy was still biased toward LIP neurons showing saccadic activity for targets presented between 3 and 12° eccentricity, and we frequently observed nonresponsive neurons in the vicinity (<2 mm) of responsive sites, which could not be studied. However, our results demonstrate that LIP contains a heterogeneous population of neurons with a wide range of anticipatory and memory-delay period activities. In all likelihood, differences in neuronal selection underlie the discrepancy between our results and those of Janssen and Shadlen (2005). In support of this hypothesis, we observed a significant correlation between the amount of anticipation and the level of memory-delay activity.
Saccade planning and spatial attention are intimately related (Kowler et al., 1995). Although we did not explicitly manipulate spatial attention, our results suggest that anticipatory LIP neurons are influenced more by the planning of eye movements. For example, anticipatory activity was much stronger for saccades planned in the direction of the RF compared with saccades planned away from the RF. Furthermore, immediately before the saccade, the firing of anticipatory neurons strongly depended on the direction of the impending saccade, whereas non-anticipatory LIP neurons were more affected by the brightening of the distractor (the go-signal) in the RF, transiently firing even more strongly when the saccade was directed away from the RF. The latter behavior is reminiscent of the shift in the focus of spatial attention which can be observed in LIP activity (Robinson et al., 1995; Powell and Goldberg, 2000; Bisley and Goldberg, 2003). Our data are the first to show that this response to the go-signal depends on the type of LIP neuron (anticipatory or non-anticipatory). The strong responses to the go-signal and the lack of anticipatory climbing activity are at least consistent with the interpretation that non-anticipatory (“visual”) LIP neurons mainly respond to the appearance of salient stimuli in their RF. We focused on anticipatory activity, and future studies will have to investigate the effects of visual saliency and spatial attention on these different types of LIP neurons.
Decision-related activity (reflecting the accumulating evidence favoring or opposing an eye movement response) is almost invariably linked to a specific oculomotor response (Shadlen and Newsome, 2001; Roitman and Shadlen, 2002), making it difficult to dissociate decision-related activity from saccade-planning activity (Park and Zhang, 2010; Bennur and Gold, 2011). Most studies on the role of LIP in perceptual decision-making (Huk and Shadlen, 2005), saccade planning (Mazzoni et al., 1996) or timing (Leon and Shadlen, 2003; Maimon and Assad, 2006) have not recorded from LIP neurons with weak or absent memory-delay activity. Conversely, the effects of spatial attention and visual saliency may be apparent both in anticipatory and in non-anticipatory—visual—LIP neurons. The above reasoning opens the possibility that the controversy with respect to the functional role of LIP (motor planning/decision versus visual attention/salience) in the past may have been largely rooted in study-by-study differences in neuronal selection criteria in a cortical area with a highly diverse population.
Single LIP neurons can carry multiple signals (Colby et al., 1996; Colby and Goldberg, 1999) related to both visual salience and saccade planning. For example, our non-anticipatory neurons were more strongly influenced by the brightening of the distractor in the RF during the planning of an eye movement in the opposite direction, but our anticipatory neurons also responded vigorously to the brightening of the distractor in the RF. Furthermore, although our anticipatory neurons were more strongly influenced by the direction of the saccade around the time of the go-signal, our non-anticipatory neurons still fired more strongly around the time of the go-signal when the saccade was planned toward the RF and the go-signal appeared outside the RF. Our data imply that LIP activity represents a continuum from visual (salience, example cell Fig. 3B) to more “motor intention” (saccade planning, example cell Fig. 3A).
The level of memory activity might represent an imperfect but straightforward feature to distinguish visual from motor intention LIP neurons, but other properties of the neural response may also be informative (e.g., the presaccadic activity). Note, however, that in the first 400 ms after target onset, both populations of LIP neurons responded virtually identically to the appearance of the saccade target or distractor in the RF. We could not determine whether anticipatory and non-anticipatory LIP neurons represent different neuronal subtypes (e.g., pyramidal versus interneurons). However, anticipatory activity tended to be more frequent in more ventral regions of LIP, which is consistent with previous reports (Huk and Shadlen, 2005; Hanks et al., 2006) and possibly related to the different behavioral effects of reversible inactivation of dorsal and ventral LIP (Liu et al., 2010).
Averaged across animals and tasks, approximately one-third of the LIP neurons showed climbing activity and approximately one-quarter showed strong memory-delay activity, but the proportion of anticipatory neurons differed markedly between animals (57% for monkey K., 50% for monkey Tm and 13% for monkey Tb). We cannot exclude the possibility that interindividual differences exist between animals in the proportion of anticipatory neurons in LIP. Overall our data suggest that visual LIP neurons may be more common than anticipatory LIP neurons, which matches behavioral deficits observed after reversible inactivation of LIP (Wardak et al., 2002; Balan and Gottlieb, 2009).
Neuronal selection may represent an important factor in an ongoing controversy regarding the latency of target detection by LIP neurons (Buschman and Miller, 2007; Miller and Buschman, 2007; Schall et al., 2007). Our single- and multiple-distractor tasks were effectively pop-out tasks (targets and distractors differed in color) and therefore similar to the pop-out task used in Buschman and Miller (2007). As a population, LIP neurons detected the location of the target as early as 52 ms after stimulus onset, which is similar to the 50 ms selectivity latency of the fastest neurons reported by Buschman and Miller (2007) but much faster compared with other LIP studies (Thomas and Paré, 2007; Ipata et al., 2009), and considerably faster than the oddball-detection latencies reported for FEF (130–140 ms) (Schall et al., 2007). Importantly, these short selectivity latencies cannot be explained by the mere difference in visual stimulation in the RF (target and distractor vs distractor in RF), as we obtained equally short latencies in the single-distractor saccade task (target vs distractor in RF). As in our study, Buschman and Miller (2007) did not select neurons based on the level of memory-delay activity, and differences in selection criteria could account for the discrepancy between the results of Buschman and Miller (2007) and previous studies (Miller and Buschman, 2007). Likewise, a population of LIP neurons with weak memory-delay activity discriminates between two different shapes in the RF as early as 45 ms after stimulus onset (Janssen et al., 2008), which also demonstrates that LIP neurons can provide accurate information about stimuli appearing in the RF at exceedingly short latencies.
The search strategy in single-cell studies is crucial for the interpretation of fMRI-data, where the hemodynamic changes reflect the average activity of large populations of neurons over an extended period of time. Thus the lack of climbing BOLD activity during a delayed-response task (Cui et al., 2009) could be related to the fact that anticipatory activity was obscured by equal amounts of declining neural activity in the waiting period before the go-signal.
Visual LIP population activity may represent a saliency map of the visual environment (Bisley and Goldberg, 2010): the location of the saccade target has high behavioral priority and elicits the highest response in those LIP neurons whose RF is stimulated by the target. In contrast, LIP neurons showing climbing activity are more strongly influenced by the direction of the planned eye movement. Together, LIP neurons construct a priority map where salient objects that are potential targets of gaze are represented in the firing rates of populations of LIP neurons.
Footnotes
This work was supported by Geneeskundige Stichting Koningin Elisabeth, Fonds voor Wetenschappelijk Onderzoek (G.0713.09, G.0622.08, and G.0831.11), Interuniversity Attraction Poles (P6/29), Excellentie Financiering (EF/05/014), National Science Foundation (BCS-0745436), Programma Financiering (PFV/10/008), and Geconcerteerde Onderzoeksacties (GOA/10/19). We thank Stijn Verstraeten, Piet Kayenbergh, Gerrit Meulemans, Marc De Paep, Inez Puttemans, and Marjan Docx for assistance. We thank Steve Raiguel for comments on a previous version of this manuscript.
The authors declare no competing financial interests.
- Correspondence should be addressed to Peter Janssen, Katholieke Universiteit Leuven, Laboratorium voor Neuro- en Psychofysiologie, Campus Gasthuisberg, O&N 2, Herestraat 49, Bus 1021, 3000 Leuven, Belgium. Peter.Janssen{at}med.kuleuven.be


