

Abstract
In the first relay of information processing, the olfactory bulb (OB), odors are known to generate specific spatial patterns of activity. Recently, in freely behaving rats, we demonstrated that learning modulated oscillatory activity in local field potential (LFP), in response to odors, in both β (15-40 Hz) and γ (60-90 Hz) bands. The present study further characterized this odor-induced oscillatory activity with emphasis on its spatiotemporal distribution over the olfactory bulb and on its relationship with improvement of behavioral performances along training. For that purpose, LFPs were simultaneously recorded from four locations in the OB in freely moving rats performing an olfactory discrimination task. Electrodes were chronically implanted near relay neurons in the mitral cell body layer. Time-frequency methods were used to extract signal characteristics (amplitude, frequency, and time course) in the two frequency bands. Before training, odor presentation produced, on each site, a power decrease in γ oscillations and a weak but significant increase in power of β oscillations (∼25 Hz). When the training was achieved, these two phenomena were amplified. Interestingly, the β oscillatory response showed several significant differences between the anterodorsal and posteroventral regions of the OB. In addition, clear-cut β responses occurred in the signal as soon as animals began to master the task. As a whole, our results point to the possible functional importance of β oscillatory activity in the mammalian OB, particularly in the context of olfactory learning.
Introduction
From the early experiments using 2-deoxyglucose or c-fos (Stewart et al., 1979; Jourdan, 1982; Johnson et al., 1999) to the most recent functional imaging techniques (for review, see Kauer and White, 2001) such as optical imaging (Meister and Bonhoeffer, 2001; Spors and Grinvald, 2002) and more recently functional magnetic resonance imaging (Yang et al., 1998; Xu et al., 2000), a consistent finding has been that even single-odorant compounds elicit a widely distributed pattern of activity in the first relay of odor processing, the olfactory bulb (OB). Indeed, different odors have been shown to be associated with overlapping but specific patterns of activity in functional modules including glomeruli and regions of underlying OB layers (Guthrie et al., 1993). These patterns reflect at least some structural properties of odors; components with similar functional groups activate nearby glomeruli and thus lead to similar spatial patterns. However, because of overlapping and redundancy, it is likely that this spatial form of coding would not be sufficient for disambiguation of odor perception. An alternative and complementary hypothesis is that odor code would also rely on the temporal features of neuronal responses within spatially distributed assemblies. This idea has received particularly strong support from invertebrates models, for which it has been proposed that odor coding lies on specific and dynamic assemblies of coherently oscillating neurons (Laurent and Davidowitz, 1994). These models also provided the first direct evidence for a functional role of temporal coding in acute olfactory discrimination. Indeed, disruption of oscillatory synchronization leads to discrimination impairment for odorants with similar, but not dissimilar, chemical structure (Stopfer et al., 1997). However, in the mammalian olfactory system, such data are not available. From studies focusing on γ frequencies (40-80 Hz) in the rabbit olfactory system, it was reported that the amplitude of oscillatory bursts associated with odor sampling defined maps over the OB surface. However, those maps seemed to be more related to the behavioral meaning of the odor than to the chemical nature of the stimulus (Freeman and Schneider, 1982; Di Prisco and Freeman, 1985; Bressler, 1988). More recently, in mammalian OB, both surface and deep local field potential (LFP) recordings revealed that odor sampling enhanced oscillatory activity in β frequency (15-40 Hz). This response was found for behaviorally relevant odors (Zibrowski and Vanderwolf, 1997; Chabaud et al., 2000), odors experimentally associated with a reward (Boeijinga and Lopes da Silva, 1989; Ravel et al., 2003), and after repeated presentations of the same odor (Gray and Skinner, 1988b; Chabaud et al., 2000).
In the hypothesis that β oscillatory activity reflects at least some aspects of odor coding, one would predict that both spatial distribution and occurrence time of oscillatory bursts would depend on the stimulus. We tested this hypothesis using multisite LFP recordings in rats engaged in an olfactory discrimination task. Furthermore, each step of training was analyzed to measure whether changes in the β response could be correlated to improvement of behavioral performances.
Materials and Methods
Subjects, surgery, and histology. Experiments were performed in accordance with the European guidelines regarding the care and use of animals for experimental procedures. Six male Wistar rats (250-300 gm) purchased from Charles River Laboratories (L'Arbresle, France) were anesthetized with equithesin (a mixture of chloral hydrate and sodium pentobarbital; 3 ml/kg, i.p.). Monopolar recording electrodes (80 μm; 100-500 kΩ) were then implanted in the output cell body layer of the OB (mitral cells layer) in four locations of the left olfactory bulb. To sample the largest volume of the OB with equally widespread recording sites, electrodes were stereotaxically positioned as follows: anterior site (A), anteroposterior axis (AP) 5,2 mm relative to the nasal suture, mediolateral axis (ML) 1,2 mm relative to the medial suture; median site (M), AP 6,5 mm, ML 1 mm; lateral site (L), AP 6,5 mm, ML 1,5 mm; posterior site (P), AP 7,5 mm, ML 1,2 mm. Each electrode depth was then adjusted individually at the level of the mitral cell layer using electrophysiological monitoring of the characteristic large multiunit mitral cell activity (Pager, 1974a,b). The smallest distance between electrodes was approximately a few millimeters. The reference electrode was positioned in the skull bone above the contralateral cortical hemisphere at ∼5 mm posterior to the bregma. All electrodes were connected to a miniature socket fixed onto the rat's head by dental cement. Two weeks of recovery separated surgery from recordings. At the end of the experiment, rats were injected with a lethal dose of pentobarbital, and an electrocoagulation (1 mA; 6 sec) was performed through each electrode. Brains were dissected and stored in a 10% formalin solution for 1 week, after which olfactory bulbs were cut into 40 μm slices and stained with cresyl violet. For each rat, the position of each recording electrode was determined.
Behavioral apparatus. Experiments were performed in a 40 × 63 cm size arena. One wall of the cage in its width axis was equipped with an odor port, the opposite one with a drinking port. Optical detectors mounted on the sides of the odor port monitored nose pokes. Detection of pokes was used to trigger odor delivery. Deodorized air constantly flowed through the odor port. After a nose-poke detection, a small volume of odorized air was added to the main flow for a 3 sec period. This was controlled through the opening and closing of solenoid valves on a two-channel flow-olfactometer. A vacuum system ensured that the odor remained confined to the port. However, within this 3 sec period, the animal itself determined the duration of odor sampling.
The odors used were eugenol, geraniol, octanal (C8), and decanal (C10) (Fluka, Neu-Ulm, Germany). They were obtained from evaporation of pure compounds from saturated granules. At the beginning of the experiment, the percentage of saturated vapor pressure introduced in the airflow was adjusted for each compound to be judged moderately and balanced by the experimenters. The values were 53% for eugenol, 44% for geraniol, and ∼10% for aldehydes (C8 and C10). Spontaneous sampling duration of each compound was also studied on a separate group of rats to confirm that the concentration of each odor determined in that way was associated with a similar spontaneous sampling duration. The drinking port was equipped with a pump delivering either a sucrose solution (60 mg/ml) or a quinine solution (0.5 mg/ml) at a constant flow (∼3 ml/min). To ensure that animals could not predict which solution would be delivered, a spout was placed at the end of the drinking tube and replaced for each trial. As soon as the animals licked the spout, the liquid was released for a maximum of 20 sec (∼1 ml). Odor sampling and licking were both controlled on-line. Electric signals corresponding to nose pokes and tube licking were recorded in parallel with biological signals.
Olfactory discrimination task. Water-deprived animals were first trained to drink in the conditioning arena. After 2-3 d, they were engaged in a go/no-go training task on the basis of the discrimination of two odors. They were then trained to exhibit a differential behavior according to the sampled odor. For task 1, the two odors were geraniol and eugenol. Geraniol signaled the availability of sucrose, whereas eugenol signaled that quinine, a bitter and aversive drink, would be delivered. Consequently, rats learned to go immediately to the drinking port after sampling of S+ (go response) and to stay near the odor port and avoid licking in response to the S- odor (no-go response). The day after animals learned task 1, a second task referred to as the control task was performed. This was done to test whether changes in electrophysiological activity were specific to the learned odor. The two odors were replaced by new ones; however, all other parameters remained identical to task 1. For the control task, two aldehyde compounds were chosen: octanal (C8), as S+, and decanal (C10), as S-. Previous tests using a habituation-discrimination protocol ensured that the two compounds were easily discriminated by rats, although their chemical structures were closely related.
For each rat, the daily conditioning session was restricted to a 30-60 min period. At the beginning of training, no animal performed >20 trials and, thus, data collection extended >2-4 d. By the end of training, each session consisted of 20-30 trials (50% S+, 50% S-, randomly distributed) with a 1 min intertrial interval. Opening the odor port door indicated to the rat that a new trial could start. Each trial was initiated by the detection of a nose poke into the odor port. The animal determined the duration of odor sampling. The experimenter ended the trial after a maximum of 30 sec after odor sampling onset by closing the odor port door. For each trial, the rat behavioral response latency was quantified as the time elapsed between the odor port entry and detection of licking. This parameter will be referred to as the behavioral response latency. Because of different individual behavioral strategies in solving the task, a criterion was defined for each rat to differentiate go and no-go responses. For each rat and each session, an average value for go responses was calculated from 10 trials. When, on a given trial, the value of the behavioral response latency was greater than the average go value ±2 SDs, the response was classified as a no-go response. Otherwise, the response was classified as a go response. The learning criterion was fixed at 80% of correct choices on two consecutive sessions including ≥70% of correct no-go responses.
Electrophysiological recordings. The whole experimental arena was placed in a Faraday cage. Neural activity was acquired in parallel from each electrode through unitary gain field effect transistors positioned in the headstage of the recording cable to reduce movement artifacts. The cable was connected to a swiveling electrical connector that allowed free movements. The LFP signals, together with event markers (nose pokes and licks signals), were amplified (600×), filtered (0.1-300 Hz), digitized (sampling frequency, 2000 Hz) (Wavebook 512; Iotech, Cleveland, OH), and stored on a computer.
For each rat, electrophysiological measures were recorded throughout training. Results were analyzed for each experimental condition. The beginner level was composed of the first 20 trials of task 1, and the expert level was defined as the trials of the first two consecutive sessions for which the learning criterion was achieved. The other sessions, between beginner and expert levels, were referred to as the intermediate level. Finally, the control condition consisted of the first two sessions after the introduction of a new pair of odors.
Signal analysis. As soon as the rat was introduced in the conditioning arena, 1 min of signal was recorded before each training session. The amplitude range of the signal was measured to test a potential signal degradation over time. More complex signal analysis was performed off-line. For additional analysis, trials in which odor sampling lasted for <100 msec or >2 sec were excluded. The time window of analysis was fixed to 4 sec, centered on the odor onset (nose poke-in detection). For each trial, signal analysis was performed on three task periods: a 1000 msec reference period extending from 1.5 to 0.5 sec before odor onset, a 500 msec period before odor onset [preperiod (pre)], and a 1000 msec period after odor-onset [odor period (odor)]. This odor period duration corresponded to the mean value of odor sampling. For each single trial, a time-frequency analysis was performed on the basis of Morlet wavelet analysis applied to the signal between 2 and 100 Hz, to define precisely and without any a priori knowledge the limits of the frequency band of interest. The characteristics of complex Gaussian Morlet's wavelets that we used were a ratio f/σf of 7, with the frequency ranging from 8 to 100 Hz in 1 Hz step (Tallon-Baudry and Bertrand, 1999). At 8 Hz, this leads to a wavelet duration (2σt) of 278 msec and to a spectral bandwidth (2σf) of 2.3 Hz, at 20 Hz to a wavelet duration of 111.4 msec and to a spectral bandwidth of 5.8 Hz, and at 100 Hz to a wavelet duration of 22.2 msec and to a spectral bandwidth of 28.6 Hz. The time resolution of the method thus increased with frequency.
On the basis of the previous results of our group (Ravel et al., 2003), the data were analyzed in two frequency ranges, β (15-40 Hz) and γ (60-90 Hz). Because odor-induced changes in β band appeared as transient bursts (<400 msec) of oscillation, wavelet analysis was the optimal time-frequency deconvolution to precisely determine the moment of their occurrence, their maximal energy, and their corresponding frequency. For each trial, a power threshold (mean ± SD) was calculated on the reference period. During the odor period, the signal was compared with the reference period for each 2 Hz frequency bins: bursts of oscillation above the threshold were considered as significant peaks. For each significant peak, frequency, power, and latency of the maximum power point were extracted. Odor sampling often induced several significant peaks of energy. An extensive preliminary study showed that the most relevant one, according to the different experimental conditions, was the peak of highest amplitude. Consequently, for each electrode and each trial, only the most powerful peak was selected for additional analysis. Frequency and power of peaks of the preperiod were extracted in the same way.
Odor-induced changes in γ band (60-90 Hz) consisted of long-lasting periods of depression. Because of the continuous nature of this change, the wavelet time-frequency deconvolution that we used for the transient β band analysis was not optimal for capturing the duration and amplitude of this depression. Instead, we used the time-varying fast Fourier transform using the Welch spectral estimation method (Welch, 1967; Chabaud et al., 2000). To this end, power spectra were computed on 150 msec time window sliding by step of 50 msec. Power baseline was calculated on the same reference period as for wavelet analysis. For each time window within the two periods, a threshold for significant changes was calculated as the mean of the logarithmic value of the power during baseline ±2 SDs. For each period, the occurrence rate of response was defined as the ratio of the number of 150 msec time windows, in which a significant decrease occurred, divided by the total number of time windows during this period. Thus, the occurrence rate varied from 0 to 1.
In parallel with this evaluation of odor-induced changes in the signal, frequency content of spontaneous activity in the different learning levels was also determined. The reference period (from 1.5 to 0.5 sec before odor onset) was computed using the same time-varying fast Fourier transform as for γ oscillatory study. For each trial of a given condition, the power spectra of all individual time windows were averaged to obtain a mean power spectrum. The amount of energy in the β (15-40 Hz) and γ (60-90 Hz) bands was calculated as a percentage of total energy between 1 and 100 Hz. Values were compared between beginner, expert, and control conditions.
Statistical analysis. For spontaneous activity, an ANOVA was performed considering two independent factors: electrode localization and level of training. For odor-induced changes, ANOVA tests were performed on occurrence rate values for γ band and peak values extracted from wavelet analysis for β band. Three independent factors were tested, the odor (eugenol vs geraniol, or C8 vs C10), electrode localization, and level of training (beginners vs experts), and one paired factor was tested, the period factor (pre, odor). The latter allowed us to determine whether occurrence rate observed during the odor period differed significantly compared with the preperiod. Each significant factor or interaction was then analyzed further by corresponding statistical tests. Latency and frequency comparisons were performed through distribution comparisons using a Kolmogorov-Smirnov (KS) test.
Results
Behavioral performance
All six rats learned task 1 in an average of 9.5 ± 2.9 sessions (i.e., 120 ± 27 trials). From a behavioral point of view, the task included three different stages as determined by the evolution of the response latency over days. Before training, rats were trained to receive water from the drinking port. However, the first stage of training consisted in learning that drink was available only after odor sampling. Thus, when animals were beginners (the first 20 trials), their behavior displayed no straightforward link between odor sampling and drink delivery. Consequently, response latencies were relatively high and similar for both odors (Fig. 1). The intermediate level was clustered in two sets: early and late intermediate (i.e., before and after the two latency curves began to diverge). The number of sessions included in these two sets was different for each animal depending on its individual speed of task acquisition. At the end of this phase, all of the animals exhibited a differential behavioral response to the two stimuli: they went very fast to the drinking port (go response) after S+ sampling and slowed down their motor behavior or even inhibited it (no-go response) after S- sampling. The first two consecutive sessions at the criterion were defined as the expert level. The following step of the experiment consisted in the presentation of novel odors C8 and C10 (control task). Data were obtained from the first two daily sessions after odor change. During these sessions, behavioral latencies were high again, and performances returned to chance level.

Behavioral data mean response latency (in seconds) (i.e., time elapsed between odor onset and licking of the spout during daily training sessions) for six rats over four training stages (see Results). Each learning curve corresponds to one of the odors used in task 1: geraniol (S+; dash) and eugenol (S-; black line). Values obtained in the control task are shown on the right: C8 (S+; •) and C10 (S-; ▪). During the intermediate level, a difference between the two latency curves appeared and increased during the following days. In the expert level, the curves were well separated. For S-, rats licked the spout with an average delay of 11 sec after odor onset. When new odors were introduced, this difference disappeared.
In task 1, sampling duration was the same for both odors (eugenol and geraniol), whether animals were beginners or experts (mean, 734 ± 358 msec). In the control task, this duration was significantly reduced (591 ± 370 msec; t test; p < 0.05); however, values did not differ significantly between C8 and C10.
Visual inspection of raw signals
During task 1, 128, 407, and 179 trials were collected for beginner, intermediate, and expert conditions, respectively. In experts, only trials with a correct go or no-go behavioral response were taken into account. Before any analysis, LFP activity of each trial was visually inspected.
Spontaneous activity was characterized by fast oscillatory bursts appearing in the raw signals within each respiratory cycle (Fig. 2a). Odor sampling was always associated with a decrease in amplitude of this fast oscillatory activity, in parallel with the emergence of a slower oscillatory activity (Fig. 2b,c). Extinction of fast bursts of oscillations occurred a few hundred milliseconds before the emergence of the slower oscillation. Consequently, the two rhythms never co-occurred. In experts, the amplitude of the slow activity became high enough so that it could be easily observed in most individual traces. However, this change in bulbar response to learned odors (Fig. 2b) differed according to the recording site (Fig. 2d,e).

Examples of local field potential signal recorded before and during odor sampling. A, Raw signal (0.1-300 Hz) during spontaneous activity. In the absence of odor, γ bursts (60-90 Hz) are present at each respiratory cycle. B, Raw signal (0.1-300 Hz) before, during, and after odor sampling (horizontal bar). Single trial to the S+ odor (geraniol) is shown from the same posteroventral recording site in the beginner condition (top) and in the expert condition (bottom). Note that an increase in the β oscillatory response can be observed in the expert condition even in the raw signal. C, Time-frequency analysis representation (from wavelet transform) of the same signal shown in B in the beginner condition. Left, In the γ band. Right, In the β band. Odor sampling duration is indicated with white vertical bars. x-Axis, Time (in sec); y-axis, frequency from 60 to 90 Hz (left), and 15-40 Hz (right) from top to bottom. The color scale represents signal power (μV2). The same time scale is used for all representations. D, Example of individual and filtered signals in the β band (15-40 Hz) recorded simultaneously in four recording sites; expert condition in response to sampling the S+ odor (geraniol, white vertical bar). One can see the obvious difference, at least in amplitude, in odor-induced β response. E, Time-frequency analysis representation corresponding to the local field potential signals in D. Odor sampling duration is indicated with white vertical bars. x-Axis, Time (in sec); y-axis, frequency from 15 to 40 Hz, from top to bottom. The color scale expresses signal power (μV2). The same time and color scale is used for all representations.
Electrode localization
Histological control revealed that all implanted electrodes were in or at the vicinity of the mitral cell body layer and distributed in the OB, as illustrated in Figure 3. According to histology, the initial set of subgroups (anterior, lateral, median, posterior) was redefined. Anterior and posterior sites were easy to differentiate not only on the rostrocaudal axis but also on a depth criterion. Indeed, all posterior sites turned to be ventrally situated, whereas anterior sites were primarily dorsal. Lateral and median sites were more difficult to discriminate, because histology revealed less of a difference in their laterality than planned. Nevertheless, lateral sites were found to be more dorsal and median sites more ventral. In addition to this histological classification, a first analysis of odor-induced LFP signals revealed similarities relative to power and frequency values within anterodorsal (AD) sites and, in contrast, within posteroventral (PV) sites. The position within the lateromedian axis did not seem to be critical. Therefore, the results are described according to two subgroups of sites. A group was composed by AD sites (n = 12) relative to the whole olfactory bulb, whereas the other one was constituted with PV sites (n = 11).

Electrode localization. A, Electrode localization as controlled histologically is reported on schematic views of the olfactory bulb. Top, Profile view. Bottom, Top view. The gray dots represent the recording sites from the AD site. The black dots represent sites from the PV site. B, Detail of an olfactory bulb section showing an example of one recording site marked by electrocoagulation in the mitral cell body layer.
Quantitative analysis of electrophysiological data
On the basis of wavelet analysis, odor-induced changes were estimated by focusing on two frequency bands of interest: β (15-40 Hz) and γ (60-90 Hz). This was consistent with previous findings (Ravel et al., 2003).
Spontaneous activity
For both AD and PV sites, the global signal amplitude was not significantly altered along the course of recording sessions (mean variation: AD site, 7.10%; PV site, 3.46%). The potential modulation of signal frequency content associated with training level was evaluated on a period of spontaneous activity that served as the reference period for all additional studies. The percentage of power of β and γ frequency bands relative to the total power of spectra between 0 and 100 Hz was calculated. For beginner and expert rats, the relative power in β band was significantly higher in the anterodorsal part than the posteroventral part of the OB (F(1,1955) = 106.070; p < 0.01). For both sites, this ratio decreased slightly, but significantly, after training (AD: beginners, 25.9%; experts, 25.4%; F(1,1005) = 3.830; p < 0.05; PV: beginners, 24%; experts, 23.4%; F(1,950) = 4.738; p < 0.05). In the γ frequency range, the power ratio was the same for both recording regions; however, the effect of training was different for the two recording sites (level site effect, F(1,1955) = 4.167; p < 0.05); γ ratio selectively increased after training for AD sites (level effect, F(1,1005) = 10.601; p < 0.01; AD: beginners, 9.8%; experts, 10.9%; PV: beginners, 10.2%; experts, 10.2%). In summary, weak modifications occurred in spontaneous activity after training; β ratio decreased, whereas γ ratio increased.
Odor-induced γ activity depression
Because odor sampling was always correlated with an extinction of γ bursts, no peak of energy remained during the odor period. The effect of odor sampling on the duration of this phenomenon was quantified by analyzing the occurrence rate of significant time windows of a decrease in power during the odor period versus the preperiod. The occurrence rate of time windows showing significant depression increased during the odor period. Values did not differ between eugenol and geraniol. Therefore, values collected in the presence of the two stimuli were pooled. For both sets of recording sites, burst extinction was amplified after training (period level effect AD site: F(1,556) = 26.444; p < 0.01; PV site: F(1,551) = 55.127; p < 0.01). Nevertheless, this effect was higher for PV sites (repeated-measures ANOVA pre-odor period: period times level site effect, F(1,1107) = 3.909; p < 0.05). To summarize, odor sampling was always correlated with γ power reduction, which was greater for the posteroventral region of the olfactory bulb. This power decrease was independent of the odor quality and amplified after training (Fig. 4).

Mean occurrence rate of significant power decrease in the γ band (60-90 Hz; n = 6 rats). Mean (±SEM) occurrence rate of power decrease is represented by uporientated bars during the two periods of signal analysis for the two recording sites, anterodorsal (top; n = 11) and posteroventral (bottom; n = 12), in beginners (gray bars), experts (black bars), and controls (scratched bars). In all conditions, values were significantly higher for the odor period than for the preperiod (at least p < 0.05). Symbols indicate a significant difference in the level of decrease: *, between experts and beginners; ▵, between AD and PV; ×, difference between controls and experts. There was no difference between controls and beginners.
Odor-induced β oscillatory activity
Peak values were extracted from the wavelet analysis on a constant time window of 1 sec after the odor onset. This corresponded to the mean sampling duration ±SD for the two odors. For each trial, a baseline correction was achieved, and characteristics (latency, frequency, and power) of the most powerful peak were extracted (for a synopsis, see Table 1).
Summary of the most significant results in the β band (15-40 Hz)
Effect of training level on peak power
In beginners, the chemical nature of odor had no effect on the maximal peak power (Fig. 5). Moreover, only β oscillations recorded in the PV sites exhibited a significant power increase between pre and odor period (ANOVA: sites period effect, F(1,405) = 7.143; p < 0.01; period effect: PV sites, F(1,211) = 14.439; p < 0.01; AD sites, no effect). In experts, the power increase between pre and odor period became significant for the two sites (AD: F(1,346) = 15.563; p < 0.01; PV: F(1,341) = 14.606; p < 0.01). However, values in the AD sites remained lower (t test, t = -7.616; df = 275; p < 0.01). For PV sites, training affected the response similarly to both odors (Fig. 5a); power increased threefold from 0.188 to 0.564 mV2. On the contrary, in AD sites, there were differences between the two odors (odor effect, F(1,378) = 4.036; p < 0.05); power increase was stronger for geraniol S+ (twofold) than for eugenol S- (1.4-fold; F(1,378) = 3.568; p < 0.05).
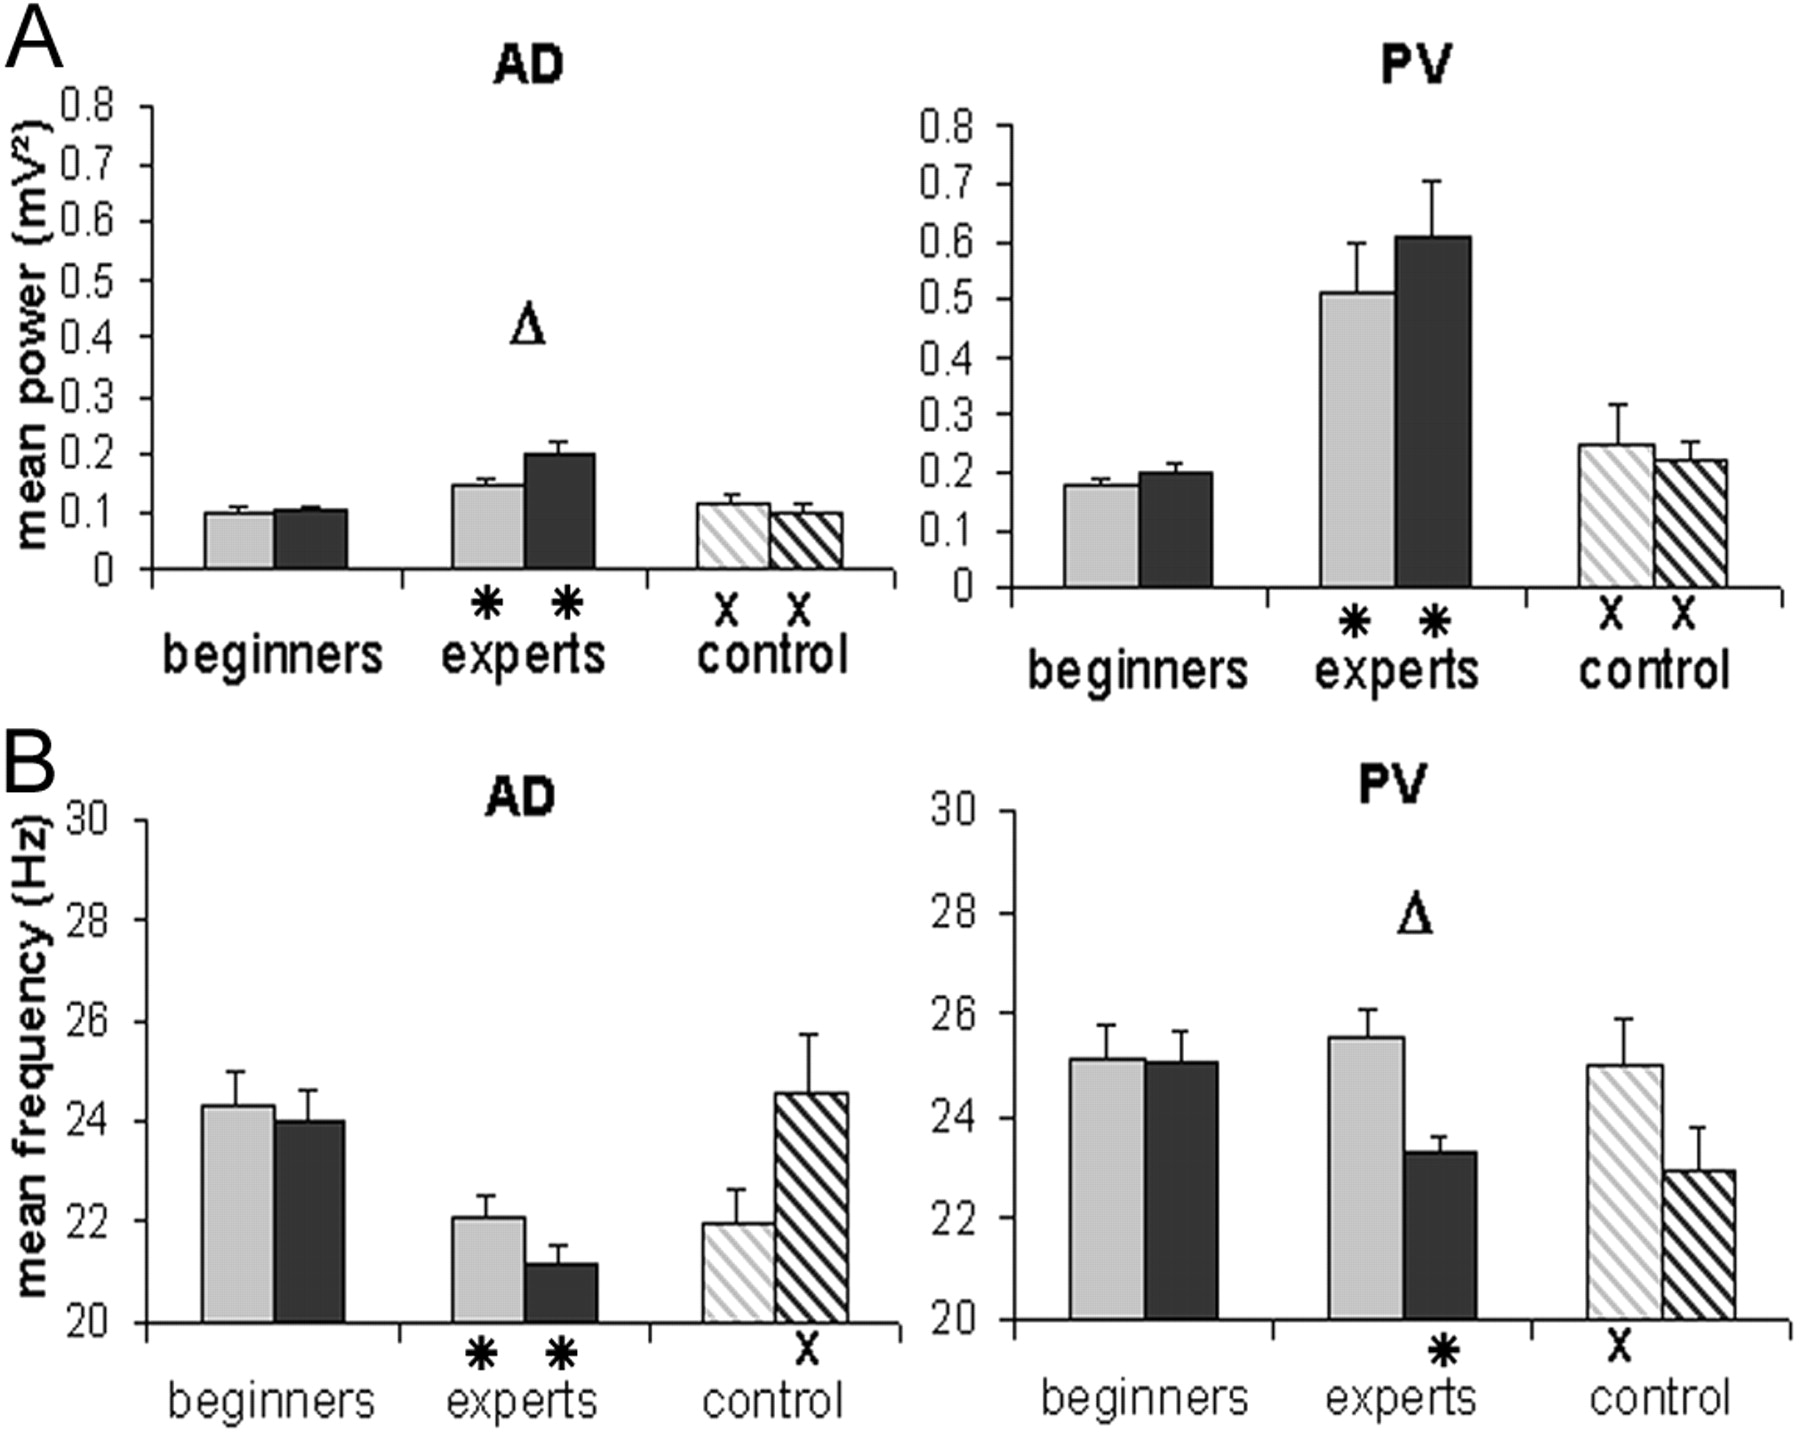
Effect of learning on power and frequency in the β band during odor sampling. Mean power (top) and frequency (bottom) of the peak of maximal energy recorded during odor sampling in anterodorsal site (left; n = 11) and posteroventral (right; n = 12) are shown. Values were extracted from time-frequency analysis. For each condition (beginners, experts, controls), data are represented separately for the two odors (eugenol and geraniol for beginners and experts; C8 and C10 in control condition). Each bar expresses the mean power (±SEM) (a) or frequency (±SEM) (b) during the odor period, 1000 msec after odor onset. *, Significant difference between beginners and experts; ▵, difference between the two odors; ×, significant difference between experts and controls. Changes in values in the three recording conditions occurred depending on the recording site and odors.
Analysis of data collected in intermediate levels of training provided information on how amplitude of odor-induced β oscillations evolved from beginner to expert conditions (Fig. 6). First, as shown in Figure 6a, whereas behavioral latencies exhibit no difference between odors in the early phase of intermediate level, they diverged significantly in the late phase (F(1,684) = 102.67; p < 0.01). This result was primarily attributable to an increase in the number of correct no-go responses to eugenol.

Changes in behavioral response and power in the β band from the early to late phase of training in the intermediate recording condition. a, Mean behavioral response latency (sec) after sampling of S+ (dashed line; n = 195 trials) and S- (black line; n = 212 trials). b, Mean power (±SEM; in mV2) for AD sites (white bars) and PV sites (gray bars). ×, Significant difference between the two sites; *, significant difference between early and late intermediate. Values are those corresponding to the peak of maximal energy during each sampling period. c, Mean maximal power (±SEM; in mV2) in response to eugenol and geraniol. Results of the two sites have been pooled together. *, Significant difference (p < 0.01) between the two odors.
During both the early and late phases, peak power values were significantly higher for geraniol than for eugenol; however, there was no significant interaction between odor and the two other factors (level and site; odor effect, F(1,1023) = 10.28; p < 0.01) (Fig. 6c). Consistent with what we observed in beginner and expert levels, power in PV sites in intermediate levels was globally higher than in AD sites (site effect, F(1,1027) = 114.13; p < 0.01). Importantly, data revealed a differential evolution of the signal between the two sites along training (level site effect, F(1,1027) = 11.66; p < 0.01); peaks in the power did not vary in anterodorsal sites but increased significantly in PV sites (sublevel effect, F(1,545) = 15.45; p < 0.01) (Fig. 6b). This result was reinforced by a trial-by-trial quantitative analysis of correlation between behavioral latencies and peak power for each level separately. Because changes in behavior were only observed in response to eugenol (no-go), the correlation study was restricted to these data. Peak power values were found to be significantly correlated with behavioral response latencies selectively in the late phase of intermediate level for the PV site (Pearson coefficient, 0.201; p < 0.05).
Thus, as summarized in Table 1, recordings in beginners and experts revealed a clear increase in peak power for both recording sites, with any difference between the two odors in the anterodorsal sites only. At intermediate levels of training, increases in power occurred primarily in the posteroventral sites and were proportional to the increase in behavioral latencies of the correct no-go responses. As a whole, amplitude in β oscillations during odor was dependent on both the odor quality and the recordings sites, and increases in posteroventral sites were correlated with improvement of behavioral performances.
Training-related decrease in frequency of the β response
In beginners, statistical analysis did not show any significant differences in the peak frequency between the two sites and the two odors (mean, 24.6 ± 5.3 Hz) (Fig. 5b). In experts, a decrease in the frequency of the odor-induced response was observed for both sites. However, the effect of training was different for each site (ANOVA level site effect, F(1,773) = 6.038; p < 0.05). For AD sites, the frequency decreased significantly from 24.6 to 21.6 Hz for both odors. In contrast, for PV sites, frequency decrease occurred only for S+ odor (geraniol; level odor effect, F(1,395) = 4.171; p < 0.05). In summary, the consequence of training was a small but reliable frequency decrease in all of the conditions except for the eugenol (S-) signal recorded in the PV site.
Training-related changes in latencies of the β response
We focused on the distribution of maximal peak latency values between 0 and 1000 msec after odor onset using bins of 100 msec. This was done to test for possible specific temporal patterning according to odor quality, recording sites, and training levels. Values were compared in the different conditions with a Kolmogorov-Smirnov test. Because no significant difference was detected between eugenol and geraniol, values were pooled for the two odors. In both beginners and experts, a recording site effect could be observed (beginners: KS, 0.198; p < 0.01; experts: KS, 0.129; p < 0.05); maximum power of bursts occurred significantly later in posteroventral than in anterodorsal recording sites (Fig. 7). In experts, latency values were significantly decreased (KS, 0.203; p < 0.01; median values: beginner, 581 msec; expert, 519 msec). Interestingly, distributions of latencies for the two sites were not centered on the same value (mode values: AD, 350 msec; PV, 550 msec).

Effect of the level of training and recording sites during the time of occurrence of the peak of maximal amplitude in the β band. Distribution of the time of occurrence of peaks between 0 and 1000 msec of the odor period by 100 msec bins is shown for beginners (top), experts (middle), and controls (bottom) for AD sites (open bars) and PV sites (filled bars). Each bar illustrates the percentage of peaks for each 100 msec bin relative to the total number of peaks during the odor period.
A new odor set restored β and γ responses observed in beginners
In the control condition, analyses were conducted on the first two sessions (n = 68 trials for 6 rats). The amplitude range of raw signals measured during the first minute in the conditioning arena exhibited no alteration compared with the beginner level. However, the large β frequency oscillatory response to eugenol and geraniol observed in trained animals disappeared, despite the fact that animals sampled odors actively and ran to the drinking port.
Regarding γ responses (Fig. 4), odor still induced a power decrease in the γ band (period effect, F(1,255) = 1.16 · 102; p < 0.01); however, it was significantly smaller than in the expert condition (period level effect, F(1,883) = 63.525; p < 0.01). There was no effect of neither the odorant chemical structure nor the recording site. When control and beginner conditions were compared, no significant difference was observed; the odor-related decrease in power was similar within the two levels. Regarding β responses, visual inspection of raw signals revealed much less obvious changes in β band in response to new odors. This was confirmed by the quantitative analysis (Fig. 5a). New stimuli induced less powerful β oscillatory peaks of activity compared with previously learned odors, with no difference between the two odors. However, this effect was different according to the recording site (site level effect, F(1,651) = 4.29; p < 0.05). For AD sites, no more significant power increase occurred between the pre and odor periods, whereas it remained significant for PV sites (F(1,130) = 5.052; p < 0.05). It is interesting to note the similarities with what has been described in the beginner condition. Comparison of oscillatory power between the control and beginner levels revealed no significant differences.
The frequency of the peak power (Fig. 5b) induced by sampling new odors revealed an interaction between the chemical nature of the stimulus and the recording site (odor site effect, F(1,147) = 6.133; p < 0.05). For C10, the frequency of the peaks recorded in AD sites was lower than that in PV sites (t test; p < 0.05), whereas for C8, the site effect was not found to be significant. The distribution of peak latencies in the control condition was identical for the two odors but different between the two recording sites (site effect: KS, 0.24; p < 0.05). Moreover, the new set of odors induced significant changes in the distribution compared with experts (AD: KS, 0.183; p < 0.01; PV: KS, 0.233; p < 0.01) (Fig. 7). Interestingly, the distribution in the control condition had a similar profile as that in the beginners.
In summary, the introduction of new odors in animals well trained to perform the task restored a very similar OB responsiveness to the one obtained in the same animals when they began learning task 1. This was true for both γ and β bands.
Discussion
This study examined spatiotemporal evolution of odor-induced field potential oscillations in the rat olfactory bulb during training. As shown previously (Ravel et al., 2003), odor sampling induced opposite changes in γ (60-90 Hz) and β (15-40 Hz) frequency bands. The two rhythms never coexisted in response to odorant stimulation. Odor sampling was associated with a decrease in γ burst power followed by an increase in β oscillatory activity. Recently, data obtained in the olfactory bulb of anesthetized rats also reported an alternation of the two rhythms during odor delivery (Buonviso et al., 2003; Neville and Haberly, 2003). In addition, current source density analysis indicates that for both oscillations, the field potentials in the OB are generated by the same neural elements. However, whereas γ activity is intrinsic to the OB, β oscillation requires the participation of higher brain structures (Neville and Haberly, 2003). Both phenomenons were amplified after training, so that in the expert condition, the LFP signal during odor sampling appeared as a nearly pure sinusoidal signal centered on 20-26 Hz. One major result from the present study was to provide evidence of a nonhomogenous distribution of these β oscillatory bursts in two different regions of the OB. In beginners, responses were restricted to PV sites. Over the course of training, the amplification of the β response emerged earlier and was stronger in the posteroventral sites than in the anterodorsal ones. Another important finding was that changes in the amplitude of the β response occurred primarily in training sessions that preceded reaching the criterion. Once established, β responses showed differences in the time of occurrence and amplitude depending on both the chemical nature of the stimulus and the localization of the recording sites.
Odor sampling induces depression of γ oscillatory activity
This depression in the γ band has been observed previously at the level of the OB using different sets of odors in rabbits (Freeman and Schneider, 1982; Di Prisco and Freeman, 1985; Gray and Skinner, 1988b) and rats (Kay and Freeman, 1998). The effect of training that we observed is in line with the hypothesis that changes in bulbar γ activity are modulated by behavioral valence attributed to odors after learning (Freeman, 1978; Freeman and Schneider, 1982; Di Prisco and Freeman, 1985). This modulation strongly depends on the action exerted at the OB level by central structures (Gervais et al., 1990). In the present experiment, we found no evidence of odor-related differential spatial distribution of the γ response. This was not the case for β activity.
β activity is related to odor processing
The β oscillation that we observed is likely to be directly related to odor processing and to learning itself for several reasons. First, responses are always observed a few hundred milliseconds after odor-port entry and vanished rapidly after poking out. Video monitoring confirmed the fact that β response appeared when animals were still in, or very near, the odor port, before they begin to run to the drinking port. Consequently, the β oscillation occurred before initiation of the behavioral response. Second, amplification of the β response could be attributable to a nonspecific effect such as rule learning, increased attention, or motivation. The results obtained in the control task render this interpretation unlikely. Indeed, despite the fact that rats mastered the task rules perfectly, sampled the odor actively, and ran quickly, odor sampling failed to elicit the characteristic large β response. Finally, another major argument against the hypothesis that amplification resulted from an increase of attention relies on the finding that the effect is not uniform in the OB.
β oscillation as a correlate of odor recognition?
Results clearly demonstrated a correlation between the emergence of a marked odor-induced β oscillatory activity and a correct behavioral response. Data showed that β activity emerged when the animal began to discriminate odors and disappeared for new odors. The question that remains is whether this oscillatory activity is associated with odor representation in the OB. In this case, one would expect to observe some odor-specific spatiotemporal patterns of activity. Regarding latencies and maximal power of β responses, strong differences exist between the anterodorsal and posterodorsal recording sites. However, although the weak β activity elicited by odor sampling was significant relative to baseline, at least in beginners, latencies and power values failed to differentiate the two odors. At least two sets of reasons could explain this lack of difference. The first one is that LFP oscillations are irrelevant for odor coding (Laurent, 2002). Nothing in our data allows us to rule out this possibility. However, data from the turtle olfactory bulb are consistent with a possible role of oscillations in odor representation (Lam et al., 2003). The second explanation is related to the relatively low spatial resolution of LFP recordings, together with a sampling of a limited number of regions in the OB. Both could make the detection of small differences between respective spatial representations of chosen odors difficult. However, the spatial distribution of response that we found fits with another set of findings. Recent histological and molecular genetic work leads to a zonal organization of the axonal connectivity pattern between the epithelium and the OB (for review, see Mori et al., 1999). The grouping of recorded sites in AD and PV fits well with this anatomical division; anterodorsal sites correspond to the region including zones I and II, whereas posteroventral sites correspond to zones III and IV. Geraniol has been found to primarily activate posteroventral OB regions (Johnson et al., 2002). However, such information is not available for eugenol. The fact that some odor-specific spatiotemporal patterns of β response emerged in the course of learning suggests some functional relevance. Emergence of this phenomenon could be facilitated by the expression of learning-induced plasticity processes known to take place in the OB network (Gervais et al., 1990)
Finally, the phenomenology of the occurrence of large β response in relation to the appearance of correct behavioral responses supports the hypothesis that odor-induced β oscillation in the OB is of functional importance. In the early intermediate level of training, large β bursts in response to both odors were detected in only a few trials. In the late intermediate level, AP and PV sites began to exhibit differences in β activity power according to the sampled odor. This was because of an increase in power restricted to the posteroventral region. When the animals reached the expert level, differences also appeared in the anterodorsal region. At this stage of training, we observed odor-induced bursts of β activity in almost every trial, and the latency of their occurrence was significantly reduced compared with the earlier stages of training. As a whole, this set of results underlines a possible behavioral significance of the β oscillatory regime for odor recognition. The twofold increase in amplitude of the β response after training is likely to be associated with neural plasticity. One obvious explanation for this increase is the recruitment of a larger number of neurons responding to learned odors. A second possibility is that neurons involved in odor representation would be more precisely synchronized to β rhythm. As we pointed out in the Introduction, odors elicit a widely distributed pattern of activity in the OB. As a consequence, different odors could be associated with overlapping patterns of activity. The precise synchronization of neurons involved in the same odor assembly could be a way to disambiguate the perception of odors represented by overlapping networks. Data from insect olfactory system (Stopfer et al., 1997) and computational models (Cleland and Linster, 2002) favor the latter hypothesis. Another benefit of such a synchronized assembly would be to facilitate the temporal integration of OB activity at the level of its target structures, particularly through the induction of synaptic plasticity (Singer, 1993). In addition to changes in the OB circuitry itself, learning modulation of OB response is achieved through top-down influence exerted by centrifugal fibers (Gervais and Pager, 1983; Gray and Skinner, 1988a). Indeed, β activity modulation reported in the present study could also reflect the interaction between OB and projection areas such as piriform or entorhinal cortices (Bressler, 1984; Boejinga and Lopez da Silva, 1989; Kay and Freeman, 1998; Chabaud et al., 2000; Neville and Haberly, 2003).
In conclusion, we propose that odor-induced β oscillatory activities near 24-27 Hz, which appear in the OB, could be a particularly good signature of the formation of neural assemblies set over the course of learning. These assemblies could be partially formatted by odor-induced-specific spatiotemporal patterns of activity. The emergent coherent activity seems to be closely associated with accurate olfactory discrimination.
Footnotes
We thank James Kilner for his helpful comments on this manuscript and his constant support.
Correspondence should be addressed to Claire Martin, Institut des Sciences Cognitives, Centre National de la Recherche Scientifique-Université Lyon I Unité Mixte de Recherche 5015, Bron, 69675 France. E-mail: cmartin{at}isc.cnrs.fr.
Copyright © 2004 Society for Neuroscience 0270-6474/04/240389-09$15.00/0


