

Abstract
This study investigated the responses of posterior triangular (PoT) thalamic neurons to tactile and noxious calibrated stimuli in anesthetized rats. We report here that 41% of PoT units responded to cutaneous stimulation, in most cases, by increasing strongly their firing. Forty-five percent of the responding units were nociceptive specific (NS), 19% were nociceptive nonspecific (NNS), and 36% were tactile. The NS units responded only to frankly noxious stimuli applied to relatively large receptive fields (several parts of the body). They encoded nociceptive temperatures chiefly in 46-50°C ranges. The NNS units resembled NS units but also responded to innocuous stimuli. Tactile units responded chiefly to repeated innocuous stimuli applied to very small receptive fields (one to two fingers or vibrissae).
A representative sample of PoT somatosensory neurons, characterized first by their response to innocuous and noxious cutaneous stimuli, were filled with juxtacellular injection of biotin-dextran that made it possible to label adequately the soma, the dendrites, and the entire axon of PoT neurons. We observed that the axons of NS neurons terminated only in secondary somatosensory (S2) cortex, whereas the axons of NNS and tactile neurons projected chiefly to the insular cortex and the amygdala.
In conclusion, our results demonstrate a spinal-PoT-S2/insular cortices nociceptive pathway that conveys nociceptive messages arising from lamina I and spinal neurons of deep laminas. Furthermore, our results demonstrate for the first time that projections of PoT neurons are correlated to their physiological properties.
Introduction
Brain imaging in humans has demonstrated that pain activates at least four main cortical areas: the primary (S1) and secondary somatosensory (S2), the insular, and the anterior cingulate (ACC) cortices (Coghill et al., 1994; Casey et al., 1996). The S1 cortex appears to be involved in the sensory-discriminative aspect of pain through a solid link with the ventrobasal region of the thalamus (Willis, 1997). On the other hand, although a major role in recognition of pain and affect encoding was hypothesized for S2, insular, and ACC cortices, the nociceptive thalamic inputs of these cortical areas remain incompletely understood.
Craig et al. (1994) and Craig (1995) identified, in the primate, a new thalamic target for lamina I: the posterior part of the ventral medial thalamic nucleus (VMpo). They suggested that this area, which projects primarily to the insular cortex (on the border of S2 cortex), would play a major role in pain processing. Nonetheless, this important link now gives rise to a strong controversy (Willis et al., 2002). Recently, we demonstrated in the rat that lamina I neurons, a major nociceptive relay of the dorsal horn, project densely not only to the ventrobasal complex but also on the posterior triangular (PoT) thalamic nucleus (Gauriau and Bernard, 2004). The PoT is a caudal extent of the thalamic posterior group (Po), located between the medial portion of the medial geniculate nucleus (MGM) and the anterior pretectal (APT) area (Paxinos and Watson, 1998). The PoT projects at least in part, to the insular cortex (Linke and Schwegler, 2000). Taking together these points, we hypothesized that the PoT could convey nociceptive messages toward the insular cortex in the rat, as the VMpo does in the primate (Gauriau and Bernard, 2004).
Despite some anatomical evidence that involved the PoT in somatosensory processing (Lund and Webster 1967a,b; LeDoux et al., 1987), until now it was not considered to be a major nociceptive relay. To our knowledge, only a few studies investigated the properties of PoT neurons. Guilbaud et al. (1980) found some nociceptive and tactile neurons in the portion of the PoT adjacent to the ventrobasal complex. Bordi and LeDoux (1994) reported tactile neurons on the border of the MGM. Furthermore, it is not clear whether PoT neurons target primarily the insular cortex, because a number of other cortical and subcortical targets have also been described for the region centered on both the PoT and the posterior intralaminar (PIL) nucleus (LeDoux et al., 1985, 1990; Linke and Schwegler, 2000).
In the present study we investigated the somatosensory properties of the PoT neurons. We systematically recorded the neurons within and around the PoT area, and we examined their response to calibrated tactile and noxious natural and electrical stimuli. In addition, we took advantage of the technique of juxtacellular injection (Pinault, 1996) to label, with biotin-dextran, PoT neurons, the responses of which to innocuous and noxious stimuli were investigated first via extracellular recording. We were thus able to label the whole axon and determine unambiguously, for the first time, the projection of a representative sample of PoT tactile and nociceptive neurons.
Materials and Methods
All animal experiments were approved by our local animal care committee and were in accordance with the guidelines of the International Association for the Study of Pain for investigations of experimental pain in conscious animals (Zimmermann, 1983).
Electrophysiological experiments with pontamine deposit
Animal preparation. Electrophysiological experiments were performed on 40 Sprague Dawley male rats weighting 250-300 gm. The animals were anesthetized deeply with 2% halothane in a nitrous oxide (two-thirds)/oxygen mixture (one-third). Cannulas were inserted into the trachea and a jugular vein. The animals were paralyzed by intravenous injection of gallamine triethiodide (∼10 mg/hr; Sigma-Aldrich, St. Quentin-Fallavier, France), and artificially ventilated using a Palmer pump. The expiratory CO2 was monitored continuously with a Capnomac II (Datex Instruments, Helsinki, Finland) during the whole experiment, and the end tidal CO2 was maintained at ∼4%. The level of halothane, O2, and N2O was also checked systematically during the experimental period. The core temperature was maintained at 37 ± 0.5°C by means of a homeothermic blanket system. The animals were mounted in a stereotaxic frame. The brain was exposed by a small craniotomy, and the dura mater was removed to allow access to the thalamus. After surgery, the halothane level was reduced to 0.5-0.7%, and the mixture of nitrous oxide/oxygen was maintained at two-thirds/one-third to achieve the level of anesthesia that was adequate for ethical purposes but did not excessively depress neuronal responses to noxious stimuli (Benoist et al., 1984).
Recordings. Single extracellular recordings were made using glass micropipette electrodes (12-20 MΩ) filled with pontamine sky blue dye (2%) diluted in 5% NaCl. After amplification, action potentials were fed into a window discriminator and observed on an oscilloscope. Single-unit activity was digitized and monitored on-line using a data acquisition system (CED 1401 with Spike 2 software; Cambridge Electronic Design, Cambridge, UK). This allowed further processing and storage of the data on a Macintosh (Apple Computer, Cupertino, CA) computer. The micropipettes were inserted into the brain by using the following coordinates: 4.3-5.2 mm caudal to bregma and 2.5-2.9 mm lateral to the midline. The depth was between 4.5 and 6.5 mm from the surface of the cortex. During the exploration, each time that a unit was encountered the effect of tactile, noxious mechanical thermal and electrical stimuli was tested on different parts of the body. In each case, the receptive field of the neuron was determined. This sampling method ignores nociceptive neurons that are totally silent, but it has the advantage to be more natural and thus to minimize the strong disruption caused by repeated noxious stimuli.
Responses to innocuous stimulation were examined using mechanical (air puffs, touch, brushing, rubbing, pressure) and proprioceptive (movement of joints) stimulation of the limbs. Thereafter, responses to mechanical and thermal noxious stimuli were determined. Mechanical noxious stimulations (pinch) were applied with calibrated forceps to the paws, the tail, and the face (16-32 N/cm2, 20 sec period). Thermal innocuous and noxious stimulation consisted of immersing the paws or the tail in a hot water bath or applying a hot water jet to the cheeks (44 and 48 or 50°C, 20 sec duration). For nociceptive neurons, graded temperatures (40-52°C, +2°C steps), applied in a 20 sec period, were used as much as possible to determine the encoding properties of the neurons (a pause of 3 min, at least, was used between successive noxious thermal stimuli). The magnitude of response was defined as the mean firing frequency during the stimulation minus the ongoing activity before the stimulation. A response was considered positive when the magnitude of response was >1 Hz or >50% of the ongoing activity for the neurons with ongoing activity >2 Hz. In fact, very few cases were ambiguous: positive responses were generally greatly above these criteria (response magnitude often in the 5-20 Hz range), and negative responses were often clearly null.
Electrical square-wave stimuli (0, 5-2 msec duration) were delivered with increasing intensities (100 μA-30 mA) through pairs of stainless steel stimulating electrodes inserted subcutaneously into the cheeks, the paws, and the tail. One or several peaks of activation were searched by direct examination on the oscilloscope. The effect of repeated application of an electrical stimulus (10-30 per trial, 0.66 Hz) was analyzed by building a peristimulus histogram. As much as possible, all of the noxious stimuli were tested for each individual cell but were not applied more frequently than once every 3 min.
Histological controls. At the conclusion of the experiments, the recording sites were marked by deposition of pontamine sky blue. After the animals were killed by injection of a lethal dose of pentobarbital, the brains and medullas were removed and fixed in a 10% formalin solution for 2 weeks. Then the samples were frozen, cut in serial coronal sections of 100 μm thickness, and stained with saffranin, which allowed us to observe easily the pontamine blue point (see Fig. 1C). Recording sites were determined by microscopic examination and plotted on a series of camera lucida drawings of the coronal section centered on the PoT region.

Location of neurons recorded in the PoT. A, Nissl-stained coronal section at the level of the mid rostrocaudal extent of the PoT. B1-B4, From caudal to rostral, coronal levels are 2.96, 3.40, 3.80, and 4.20 mm interaural (Paxinos and Watson, 1998). Black star indicates nociceptive specific neuron; black point, nociceptive nonspecific neuron; open triangle, tactile neuron; all were located by pontamine deposit. Same symbols surrounded with a circle indicate same types of neurons labeled with juxtacellular injection of biotin-dextran. C, Pontamine blue deposit at the recording site of the PoT nociceptive specific neuron 38B (Fig. 2). Scale bars, 1 mm. I-VI, Cortex laminas I-VI; ACC, anterior cingulate cortex; AI agranular insular cortex; BL, basolateral amygdaloid nucleus; bsc, brachium of the superior colliculus; Ce, central amygdaloid nucleus; CeL, Ce, lateral division; CeM, Ce, medial division; cp, cerebral peduncle, basal part; cst, commissural stria terminalis; DEn, dorsal endopiriform nucleus; DI, dysgranular insular cortex; DLG, dorsal lateral geniculate nucleus; DpMe, deep mesencephalic nucleus; ec, external capsule; Eth, ethmoid thalamic nucleus; fr, fasciculus retroflexus; GI, granular insular cortex; GP, globus pallidus; ic, internal capsule; InSC, intermediate gray layer of the superior colliculus; IPAC, interstitial nucleus of the posterior limb of the anterior commissure; La, lateral amygdaloid nucleus; LOT, nucleus of the lateral olfactory tract; MeA, medial amygdaloid nucleus, anterior part; MG, medial geniculate nucleus; ml, medial lemniscus; mt, mammillothalamic tract; opt, optic tract, ox, optic chiasm; PAG, periaqueductal gray; PaR, pararubral nucleus; PR, prerubral field; PVc, paraventricular thalamic nucleus, caudal part; REth, retroethmoid nucleus; Rt, reticular thalamic nucleus; SG, suprageniculate thalamic nucleus; SI, substantia innominata; SN, substantia nigra; SNL, substantia nigra, lateral part; str, superior thalamic radiation; VLG, ventral lateral geniculate nucleus; VPL, ventral posterolateral thalamic nucleus; VPM, ventral posteromedial thalamic nucleus; ZI, zona incerta.
Electrophysiology experiments with juxtacellular injection
Animal preparation and recordings. Experiments included 60 Sprague Dawley male rats weighting 250-300 gm. Preparation was identical to the protocol described above, except for the following points: (1) the tracheal cannula was inserted by endotracheal intubation, (2) the animals were paralyzed by an intraperitoneal injection of vecuronium bromide (∼1 mg/hr; Norcuron; Organon, Serifontaine, France), and (3) the micropipette electrodes were filled with biotin-dextran (molecular weight 3000 Da; 1.5% in 3% NaCl; Molecular Probes, Interchim, Montluçon, France).
Juxtacellular injection. Once the examination of the response of an adequately isolated neuron was made (as described above), biotin-dextran was injected by “juxtacellular” iontophoresis (Pinault, 1996) with continuous electrophysiological control to ensure that the neuron remained alive. Using the bridge circuit of the recording amplifier (Axoclamp 2B, Axon Instruments, Union City, CA), the tracer was applied with 200 msec on-200 msec off pulses of gradually increasing intensity DC current (1-15 nA, anode in the pipette). After a delay of a few seconds to several minutes, the electrical behavior of first the background noise and then the recorded neuron changed suddenly and significantly, indicating that the microelectrode tip was in the juxtacellular position. The background noise level always increased before the occurrence of a spike firing driven by current pulses. The presence of spike firing, during the 200 msec on period of the current pulse indicated that the neuron was filled efficiently by the marker. In cases of absence of discharge during this period, we never observed stained cells. From this critical moment, pulse intensity was adjusted (usually reduced to 2-3 nA) to maintain a sufficient level of firing of the neuron and prevent cellular damage. Both the amplitude and discharge frequency of action potentials varied spontaneously in a reversible manner during the injection period. Thus, it was necessary either to temporarily increase the current intensity or to move the microelectrode a few micrometers up or down. In this study the juxtacellular current was delivered over a period of 3-30 min. At the end of the experiment, the anesthesia was diminished progressively. When movement of the rat increased, the cannula was removed. Adequate removal from curare was supervised (especially the ventilation) for 2 additional hours, after which the rat was returned to its home cage.
Immunohistochemistry. After a survival period of ∼1.5 d (optimal to label axon) but ranging from 2 hr to 2 d (for trials or when the animal was in a bad condition), the animals were anesthetized deeply with sodium pentobarbital and perfused transcardially. The perfusion consisted of a warm (37°C) heparinized saline solution for 2 min, followed by a cold (10°C) phosphate buffered solution (0.1 m, pH 7.4) containing 4% paraformaldehyde, 0.1% glutaraldehyde, and 0.05% picric acid for 20 min, and followed finally by a 20% sucrose phosphate buffered solution for 10 min. Then the brain was removed, cut in coronal sections of 80 μm thickness on a freezing microtome, and serially collected in phosphate-buffer solution. They were then washed in the latter solution before being incubated with Elite avidin-biotin-peroxidase complex (ABC Elite, Vector Laboratories, Burlingame, CA) for 1 hr. The injected tracer could then be revealed with the peroxidase histochemical reaction; the sections were rinsed with phosphate-buffer solution (0.15 m, pH 7.4) for 20 min and then incubated in a Tris-buffer solution containing 0.05% of 3,3′-diaminobenzidine (DAB, Sigma-Aldrich) and 0.2% ammonium nickel sulfate (Sigma) for 2 min. Then increasing doses of H2O2 [0.001, 0.003, 0.007, 0.015, 0.040, and 0.085% of concentration (30%) of the parent solution] were added every 5 min to sections floating in the DAB-nickel solution. Thereby, the juxtacellulary injected neuron was stained permanently. Serial sections were mounted on gelatin-covered slides and coverslipped.
Reconstruction and analysis of labeled neurons. Labeled neurons were examined under light-field illumination. Illustrations are two-dimensional reconstructions made from superimposed camera lucida drawings of a large series of adjacent coronal 80-μm-thick sections. This thickness was chosen to make the neuronal reconstruction easier (lower number of sections to put together) without altering the immunohistochemical reaction that labels the neuron (thickness not too high). A CCD color video camera connected to a microscope sent an RGB output to a Macintosh computer. Images of different focal planes were captured and digitized as a 24 bits color scale using Optilab/24 (Graftek France, version 2.0). An eight bits grayscale image was extracted from the 24 bits color scale image. The images at different focal planes were combined (pixel by pixel). This produced a single image incorporating the darker value of the corresponding pixels in each focal plane. Thus, every part of the labeling was in focus in the reconstructed image of the 80 μm section. Images were exported to Adobe-Photoshop (version 6.0) to adjust brightness and contrast before adjacent digitized images were mounted and image scale was adjusted. In addition, for photomicrographs in Figures 7A and 9A, three adjacent sections were superimposed (using Adobe-Photoshop) to provide an adequate view of the dendritic arborization. For the photomicrograph in Figure 8A, two adjacent sections were superimposed to provide a better view of the axonal arborization. The photomicrograph in Figure 10A included only one section. Finally, the photomicrographs were imported into FreeHand (version 9.0.1) for the addition of labels and anatomical landmarks.

Nociceptive specific PoT neuron j42 labeled with juxtacellular injection of biotin-dextran. A, Microphotograph of the labeled soma with its dendrites and first portion of the axon (arrow at the top). B, Top to bottom, Response to innocuous touch (T), noxious pinch (P), innocuous thermal (44°C), and noxious thermal (48°C) stimuli, applied for 20 sec (bars) to the preferential receptive field (area in black plus asterisk); in gray, receptive field area inducing moderate firing. C, Reconstruction of the neuron from serial coronal sections. Left to right, Coronal levels are 4.20, 6.44, and 7.70 mm interaural (Paxinos and Watson, 1998). Note: from left, (1) the soma plus dendrites in PoT, (2) a slight axonal arborization in the reticular thalamic nucleus (Rt), and (3) the extensive axonal arborization in S2 cortex. The framed region in cortex is illustrated in the high-magnification photomicrograph in Figure 8. Abbreviations are listed in Figure 1 legend. Scale bars, 200 μm.

Nociceptive nonspecific PoT neuron j47 labeled with juxtacellular injection of biotin-dextran. A, Microphotograph of the labeled soma with dendrites and first portion of the axon (arrow at the top). B, Response to innocuous touch (T) and noxious pinch (P) stimuli, applied for 20 sec (bars) to the receptive field (area in black plus asterisk). C, Reconstruction of the neuron from serial coronal sections. Left to right, Coronal levels are 3.40, 4.48, 5.86, 6.70, and 6.70 mm interaural (Paxinos and Watson, 1998). Note: from left, (1) the soma plus dendrites in PoT, (2) a slight axonal arborization in zona incerta (ZI) and globus pallidus (GP), and (3) the extensive axonal arborization in AStr and insular cortex. The framed region in cortex is illustrated in the high-magnification photomicrograph in Figure 10. Abbreviations are listed in Figure 1 legend. Scale bars, 200 μm.

A, Digitized photomicrograph of the area framed in Figure 7C illustrates axonal arborization in S2 cortex from the nociceptive-specific PoT neuron j42. B, Coronal section (7.70 mm interaural level) indicating the location (area framed in S2 cortex) of photomicrograph in A. Abbreviations are listed in Figure 1 legend. Scale bars: A, 100 μm; B, 1 mm.

A, Digitized photomicrograph of the area framed in Figure 9C illustrates the axonal arborization in granular insular (GI) cortex from the nociceptive nonspecific PoT neuron j47. B, Coronal section (6.70 mm interaural level) indicating the location (area framed in GI cortex) of photomicrograph in A. Abbreviations are listed in Figure 1 legend. Scale bars: A, 100 μm; B, 1 mm.
Boundaries of the PoT area and the insular and S2 cortices
Boundaries of the PoT area and the insular and S2 cortices were drawn according to the atlas of Paxinos and Watson (1998). The boundary between the PoT and the PIL was difficult to appreciate accurately. Thus, the region that we termed PoT in the present study overlaps in part with the region defined as the PIL in some other studies (Fig. 1A, B). The boundary between insular and S2 cortices was noted by comparison with the atlas of Paxinos and Watson (1998) using the rhinal fissure as a reference landmark, with a careful determination of the rostrocaudal position of the coronal section in the coordinates described in the atlas.
Results
The results of the present study are based on 108 neurons recorded within and around the PoT (including the adjacent portion of the PIL) that responded to cutaneous stimulation (Fig. 1). These neurons comprised 41% of the total number of units recorded in the PoT region; 59% of the units were unresponsive. Spontaneous activity of the responsive neurons (n = 108) was rather low (10th percentile < median < 90th percentile: 0.1 < 1 < 6 Hz).
According to their response to innocuous and noxious natural mechanical stimulation, these PoT neurons were classified in three groups: (1) NS units (45%; 48 of 108) responded only to noxious stimuli, (2) NNS units (19%; 21 of 108) responded to both innocuous and noxious stimuli, and (3) tactile units (36%; 39 of 108) responded only to light stimuli.
NS neurons
Most NS neurons (44 of 48) were excited by noxious stimuli. The application of frankly noxious stimuli (strong pinch, temperature of 48 or 50°C) gave rise to a clear or strong but decreasing discharge throughout the stimulation period (Fig. 2). The discharge often lasted several seconds and more rarely 1-2 min after the termination of the stimulus. The averaged discharge during a 20 sec stimulation was in the range of 5-30 spikes per second. Innocuous mechanical (pressure <4 N/cm2, brush, rubbing, stroke, vibrissa movement) and thermal (≤44°C) stimuli were totally ineffective in exciting these NS neurons (Fig. 2A1,B1). A few (4 of 48) NS neurons had their ongoing activity stopped completely only by frankly noxious stimuli.

Nociceptive specific PoT neuron 38B. A1, A2, Response to innocuous tactile (T) and noxious pinch (P) stimuli. B1-B5, Response to graded thermal stimuli (2°C steps) from innocuous to strongly noxious temperature (44-52°C). Mechanical and thermal stimuli were applied for 20 sec (bars) to the receptive field (asterisk). C, Receptive field including portions inducing high (black) and moderate (gray) firing of neuron.
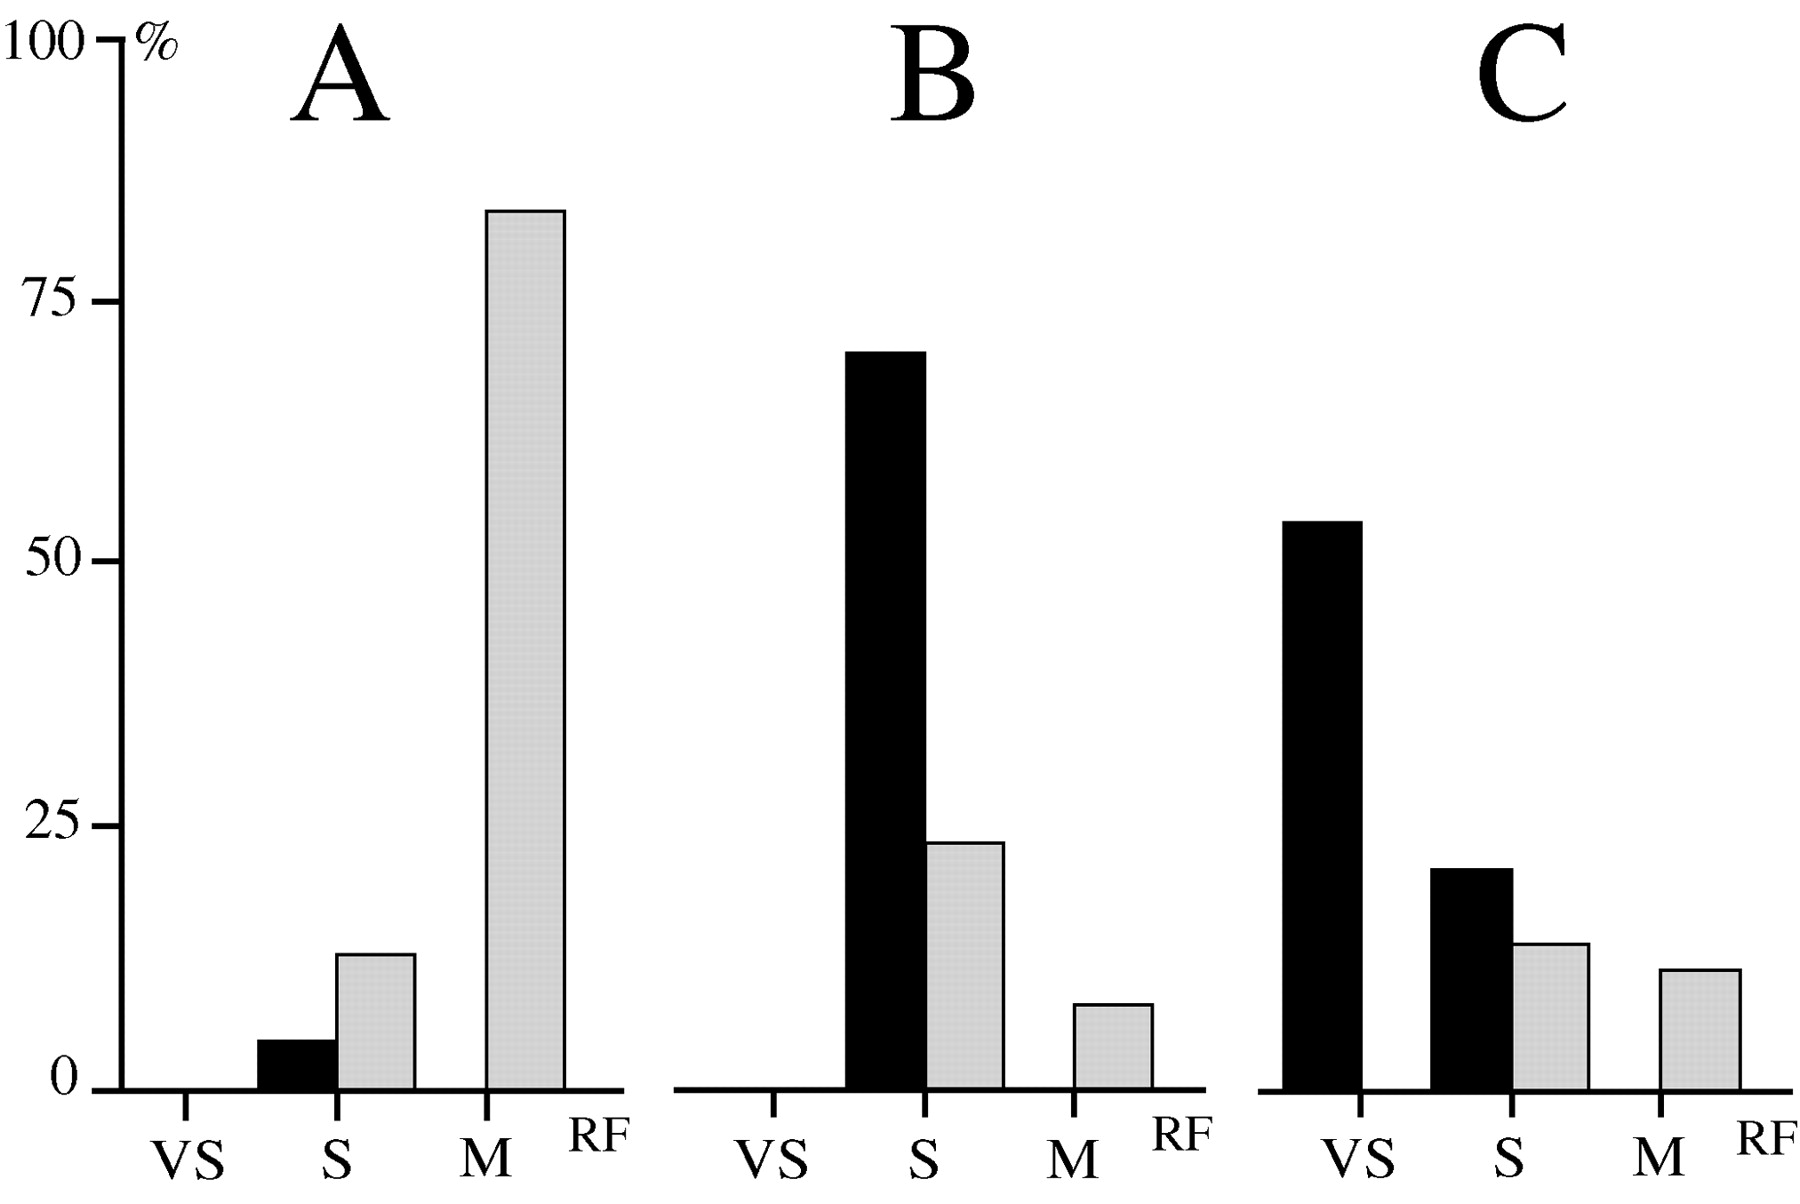
NS neurons responded generally to both mechanical and thermal noxious stimuli, but in individual cases, one modality was often more effective (Fig. 2). The receptive fields of the NS neurons were usually medium (e.g., two to four parts of the body) and bilateral, but always with a clear contralateral predominance (Fig. 3A). Importantly, the receptive field often included a restricted contralateral part (one paw, one part of the face) that responded markedly more strongly to noxious stimuli.

Histogram of the receptive field size of nociceptive specific (A), nociceptive nonspecific (B), and tactile (C) PoT neurons. Abscissa, Size of receptive field; VS, very small = one digit or one vibrissa; S, small = one paw, one part of the face or the tail; M, medium = two to four parts of the body; ordinate, percentage of neurons in each class; black, receptive fields exclusively contralateral; gray, receptive fields bilateral with contralateral predominance.
NNS neurons
The NNS neurons were excited moderately by tactile stimuli such as movement of vibrissa, brush, weak rubbing, or repeated stroke of the skin as well as by firm but innocuous constant pressure (Fig. 4A2). Above all, their response increased strongly for frankly noxious pressure (Fig. 4A1). Like NS neurons, the NNS neurons responded to thermal stimuli only in the noxious (≥44°C) range (Fig. 4B). Thus, because the response ranges of these neurons were not especially large, we preferred to term them NNS rather than wide dynamic range.

Nociceptive nonspecific PoT neuron 9A. A1, A2, Response to noxious pinch (P) and innocuous tactile (T) stimuli (repeated slight brushing). B1-B4, Response to graded thermal stimuli (2°C steps) from moderate to strongly noxious temperature (46-52°C). Mechanical and thermal stimuli were applied for 20 sec (bars) to the receptive field (asterisk). C, Receptive field including portions inducing high (black) and moderate (gray) firing of neuron.
The receptive fields of the NNS neurons were intermediate between those of NS and tactile neurons (Fig. 3B). They were often small (e.g., one paw, one part of the face or the tail) and strictly or very predominantly contralateral. In a few cases, noxious stimuli applied to the ipsilateral symmetrical part of the body or the tail, or both, induced a moderate response.
Tactile neurons
Tactile neurons were chiefly excited by innocuous mechanical stimuli such as movement of vibrissa, brush, weak rubbing, or repeated stroke of the skin (Fig. 5A). They were moderately sensitive or even insensitive to constant mechanical stimuli such as pressure and pinch as well as to thermal innocuous and noxious stimuli (Fig. 5B). The firing (5-25 spikes per second) of these neurons continued as long as the light stimulus was repeated (with a frequency ∼1 Hz). The receptive fields of these neurons were generally very small (e.g., one digit or one vibrissa) or small (e.g., several digits or a restricted part of face) and exclusively contralateral (Figs. 3C, 5C).

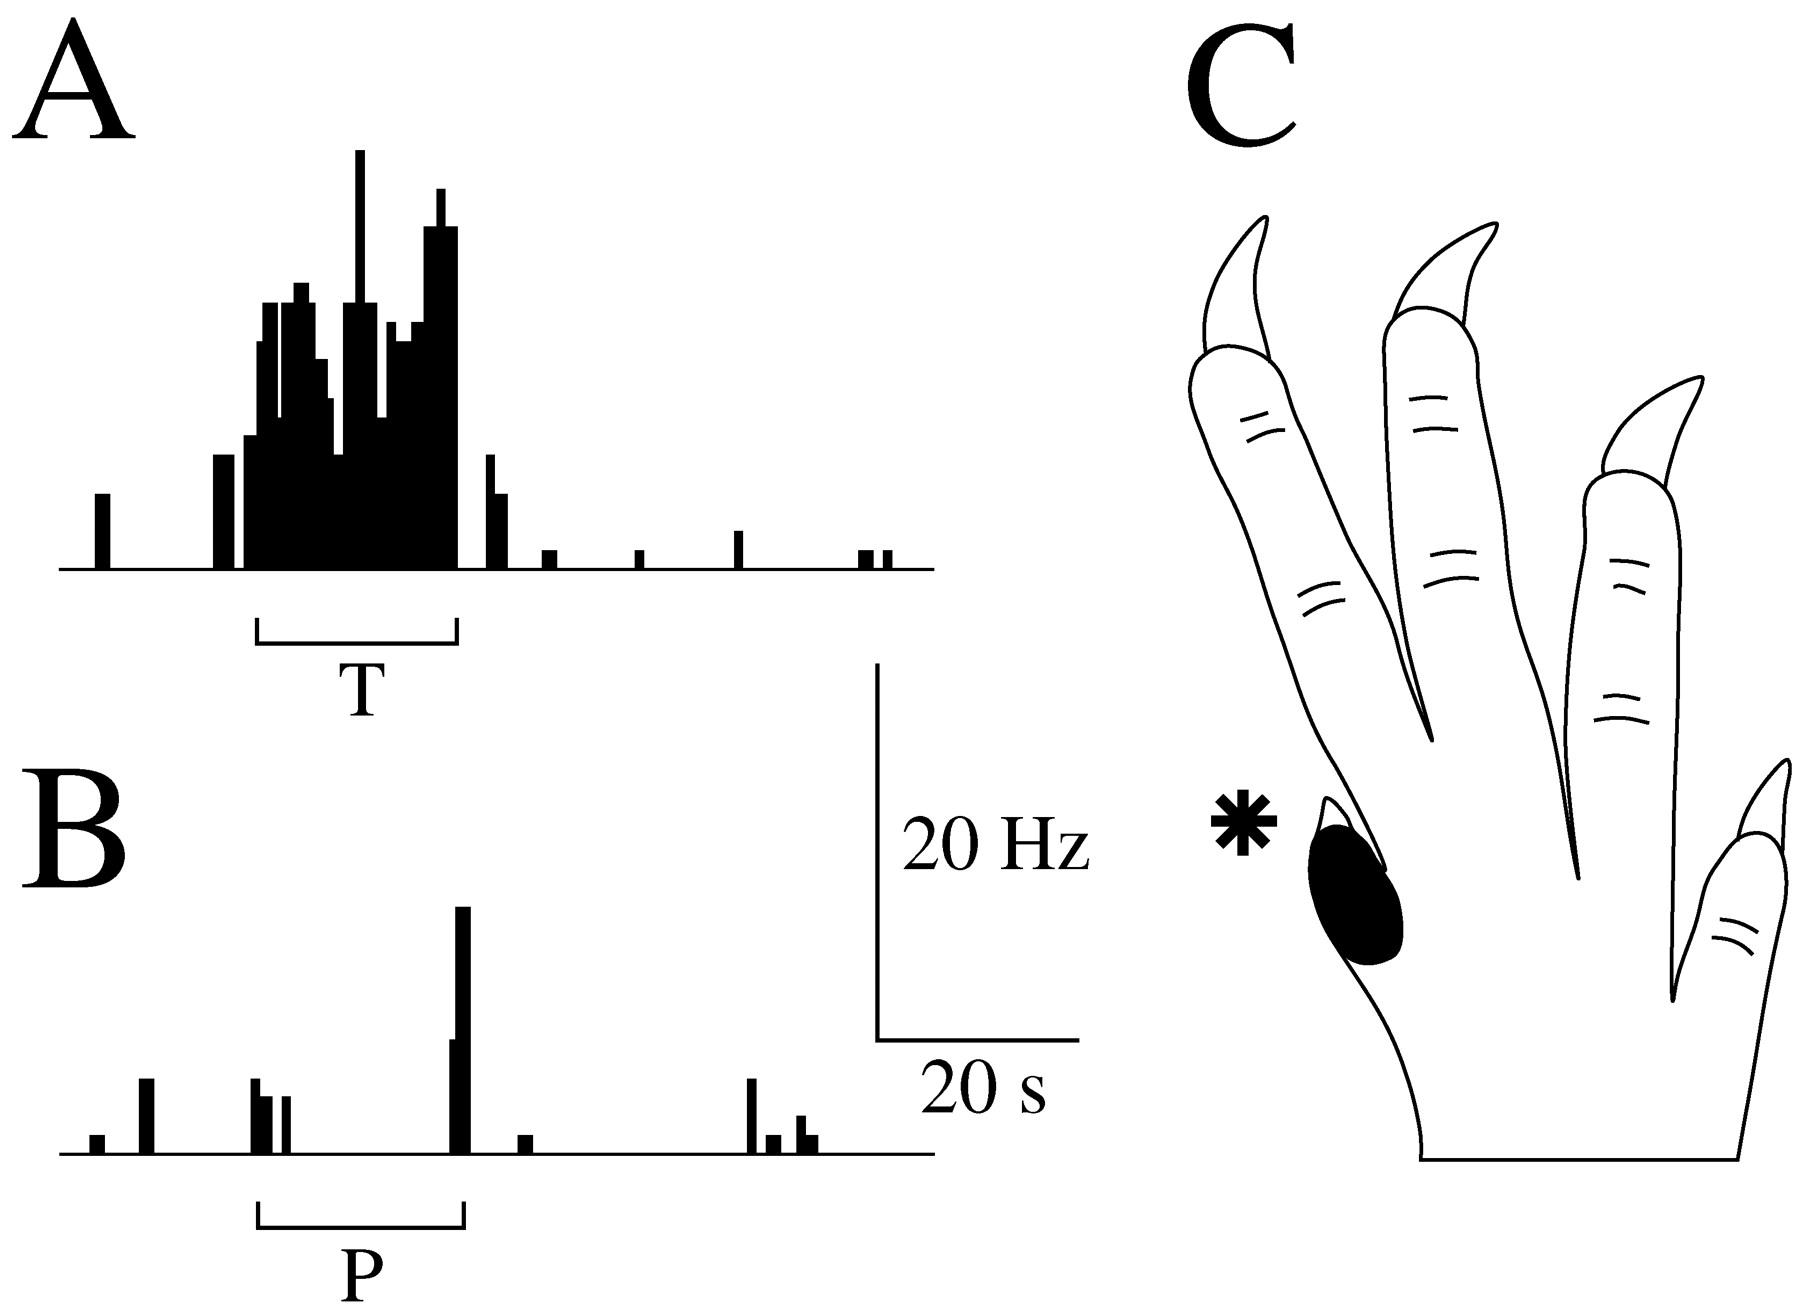
Tactile PoT neuron 23C. A, Response to innocuous tactile (T) stimulus (repeated slight brushing). B, Response to noxious pinch (P) stimulus. Mechanical stimuli were applied for 20 sec (bars) to the receptive field (asterisk). C, Very small receptive field including only the first digit (black) of the contralateral forepaw.
Encoding thermal properties of nociceptive neurons
No difference was observed between NS and NNS neurons for this modality. Thus, the individual stimulus-response curves of a subgroup of NS-NNS neurons that were adequately tested (n = 14) were pooled for illustrative purpose in Figure 6 (thin lines). These individual curves demonstrated several common features: they were all (1) at zero for temperatures ≤44°C and (2) monotonic and positive from 44 to 48°C. Most of them (9 of 14) were still monotonic and positive up to 50°C. After this point, a phenomenon of saturation was clearly apparent.

Thin lines, Stimulus-response curves of individual PoT neurons to graded thermal stimuli (n = 14). Thick line, Average stimulus-response curve of PoT neurons to heat stimuli. Abscissa, Stimulus temperature. Ordinate, Frequency of response.
The mean threshold of nociceptive neurons was 46.6 ± 0.5°C (n = 14). The mean thermal curve (Fig. 6, thick line) shows that the steepest portion of the curve is clearly between 46 and 48°C; almost all the increase is between 46 and 50°C.
Response to electrical stimulation
Neurons excited either by innocuous or noxious stimuli responded to transcutaneous electrical stimulation applied to the receptive field. NS as well as NNS neurons responded to repeated electrical stimulation of high intensity (2 msec; 0.5-5 mA threshold), with a strong and lasting increase of firing that made it difficult to measure the latency of individual components when they could be recognized. It was often possible to distinguish a first component of activation occurring with a latency of ∼10-70 msec and a second component occurring with a latency of ∼100-280 msec. Tactile neurons responded rather constantly to one electrical shock (1 msec; 100-600 μA threshold) with few spikes (in the range of one to two spikes per shock) occurring with a very short to short (5-20 msec) but not stable latency.
Projections of NS, NNS, and tactile neurons
The group of 108 responding neurons analyzed here included 33 neurons filled with juxtacellular injection of biotin-dextran (see Materials and Methods). The main electrophysiological properties of this subgroup of neurons were homogeneous with those of the whole group; in particular they contained similar proportions of NS, NNS, and tactile neurons (Fig. 1B). All of these neurons had, in addition to soma and dendrites, at least a portion of the axon labeled. This suggested that all PoT neurons responding to somatosensory stimuli were projection neurons.
In a subgroup including six NS, five NNS, and six tactile neurons, the axon was labeled in its full length, often with a large portion of its terminal arborization. Figure 7 illustrates one NS neuron projecting to the S2 cortex. The receptive field of this neuron was medium: it included all of the tail and to a lesser extent the contralateral hindpaw. This neuron was strongly activated by noxious pinch and thermal (48°C) stimuli, whereas innocuous stimuli were completely ineffective (Fig. 7B). The soma was relatively small (16 × 22 μm). The dendritic tree was contained in a roughly spherical volume (260 μm diameter) in the rostral PoT (Fig. 7A). The axon ascended within the PoT and provided an extensive termination to layer IV of the S2 cortex, with several ramifications to the other layers (Figs. 7C, 8).
Figure 9 illustrates one NNS neuron projecting to the insular cortex. The receptive field of this neuron was small; it corresponded to a portion of the contralateral cheek. Repeated tactile stimulation produced a moderate excitation, whereas noxious pinch induced a stronger and sustained activation (Fig. 9B). The soma was relatively small (11 × 29 μm). The dendritic tree was contained in an ovoid volume (100 × 100 × 440 μm) fitting with the general shape of the PoT (Fig. 9A). The axon ascended within the PoT and provided an extensive collateral projection to the amygdalostriatal transition area (AStr) and a dense termination in layers V and VI of the granular insular cortex (Figs. 9C, 10).
Detailed analysis of the projections of the 17 fully labeled neurons revealed that the 6 NS PoT neurons projected to the S2 cortex, with a moderate collateral projection to the caudal portion of the caudate putamen (CPu). On the other hand, in striking contrast, the five NNS and six tactile PoT neurons projected to different sites. These projections, which were remarkably similar, included chiefly the posterior portion of insular granular cortex (for three of five NNS and two of six tactile neurons), the AStr (for two of five NNS and two of six tactile neurons), and to a lesser extent the S1 cortex on the border of S2 (for one of five NNS and two of six tactile neurons) and the CPu (for three of five of NNS and two of six of tactile neurons). The latter projections to the CPu were always collateral of cortical ones. In addition, a double AStr-insular projection was observed for one NNS neuron. A schematic presentation of the distinct projections arising from the two functionally distinct (NS vs NNS/tactile) sets of PoT neurons is shown in Figure 11.

Summary diagram of the axonal projections from nociceptive specific (gray) and nociceptive nonspecific plus tactile (small dots) PoT neurons. From caudal to rostral, coronal levels of A and B are interaural 6.70 and 7.70 mm (Paxinos and Watson, 1998). Abbreviations are listed in Figure 1 legend. Scale bar, 1 mm.
Discussion
The present study demonstrates that the PoT contains numerous nociceptive neurons (45% NS and 19% NNS) as well as a significant proportion of tactile neurons (36%) among 41% of neurons responding to somatosensory stimuli. The area investigated in our study included, in part, the adjacent portion of both the MGM and the PIL.
Our finding of neurons sensitive to somatosensory stimuli is in good agreement with anatomical data that show spinal, trigeminal, and dorsal column projections to an area around the PoT of the rat (Lund and Webster, 1967a,b; Feldman and Kruger, 1980; Massopust et al., 1985; LeDoux et al., 1987). However, only Guilbaud et al. (1980), in their study mapping the ventrobasal thalamic complex, reported a few nociceptive and tactile neurons in an area that could correspond to the PoT. More recently, Bordi and LeDoux (1994) reported a few somatosensory tactile neurons in the PoT, on the border of the MGM, during a study focused chiefly on auditory or multimodal neurons in the MGM. Thus, it might be possible that a part of the unresponsive neurons observed in and around the PoT were in fact sensitive to auditory stimuli.
Neurons injected with biotin-dextran were labeled adequately only when the juxtacellular injection current (1-5 nA) triggered an adequate discharge in the recorded neuron for 5-30 min. Furthermore, only one neuron was labeled per experiment. Thus, this technique appears specific when a moderate injection of current is used. It allowed us to label the soma, the dendrites and, in half of the cases, the entire axon of the recorded neuron (e.g., its projection). We labeled projections from PoT and PIL neurons to fewer targets (S1, S2, and insular cortices, AStr area) than previous anatomical anterograde studies (LeDoux et al., 1985, 1990; Linke, 1999; Linke and Schwegler, 2000; Linke et al., 2000). This reflects presumably the specificity of our approach (one labeled neuron per animal) and the selection of our population (we filled only somatosensory responding neurons). Using this technique we were able to demonstrate that the projections of somatosensory-responsive PoT neurons were highly correlated to their physiological properties: NS neurons projected exclusively to the S2 cortex, whereas NNS and tactile neurons did not project to the S2 cortex but projected chiefly to the insular cortex or the AStr, or both.
NS neurons
The most striking feature of these neurons was their capacity to respond only to frankly nociceptive stimuli: firm pinch and temperature ≥44°C. These neurons were completely insensitive to innocuous stimuli. The response to 44°C was generally very weak; the main increase of discharge was between 46 and 50°C. These values are in agreement with the temperature of maximum nociceptive discrimination (∼47-48°C) and the dolorimetric scale (44-50°C) in the primate (Hardy et al., 1967; Adair et al., 1968; Bushnell et al., 1983; Robinson et al., 1983). Other characteristics of these NS neurons are consistent also with their involvement in nociceptive processing: (1) a strong and sustained excitation with an afterdischarge, (2) a clear and rapid response onset, and (3) a marked excitation by very intense electrical shock.
The NS neurons were located chiefly in the center of the PoT, an area in which we have recently reported a strong projection from both spinal and trigeminal lamina I neurons (Gauriau and Bernard, 2004). Because lamina I neurons are involved primarily in nociceptive processing (Christensen and Perl, 1970; Kenshalo et al., 1979; Bushnell et al., 1984; Craig and Kniffki, 1985; Bester et al., 2000), it is probable that they provide the main nociceptive input to PoT NS neurons. Indeed the main properties of lamina I neurons are close to those of PoT nociceptive neurons: (1) numerous lamina I neurons respond strongly and specifically to noxious stimuli (Christensen and Perl, 1970; Bester et al., 2000), and (2) the slope of the stimulus-response curve of lamina I neurons is maximum between 46 and 50°C (Kenshalo et al., 1979; Bester et al., 2000). However, the receptive fields of lamina I neurons were generally small or very small (typically one digit) (Kenshalo et al., 1979; Bester et al., 2000), whereas those of PoT neurons were markedly larger (one to three portions of the body). This last point likely reflects a strong convergence of lamina I projections within the PoT (Gauriau and Bernard, 2004). Furthermore, the dense dendritic arborization of PoT NS neurons, which occupied a sphere ∼200-300 μm diameter, likely favors the convergence of noxious information on individual PoT NS neurons.
Taken together, the lamina I projections to the PoT and the focused projection of PoT NS neurons to S2 cortex support strongly the existence of the lamina I-PoT-S2 cortex nociceptive pathway. The involvement of S2 cortex in nociception remains unclear in the rat. Recently, however, Chang and Shyu (2001), using fMRI in the rat, showed that both S1 and S2 cortices were activated by noxious electrical stimulation of the sciatic nerve. Heppelmann et al. (2001) showed that noxious electrical stimulation of the knee joint induces evoked potentials in S2 cortex, independently of S1 cortex. In primates, the involvement of S2 cortex in nociceptive processing was shown by functional imaging studies (Coghill et al., 1994; Casey et al., 1996; Gelnar et al., 1999; Peyron et al., 1999; Ploner et al., 1999b, 2002; Timmermann et al., 2001; Chen et al., 2002). The activation of S2 cortex may reflect the sensory-discriminative painful dimension of noxious input. Ploner et al. (1999a) reported a striking case of one patient, with a cortical lesion centered on S2, who lost the ability to recognize the sensory-discriminative component of pain but kept the capacity to identify the motivational-affective aspect of pain. Thus, the lamina I-PoT-S2 nociceptive pathway could participate in the recognition of nociceptive stimuli as a specific “painful” sensation.
NNS and tactile neurons
The properties of PoT tactile neurons are probably linked to the dorsal column input (Lund and Webster, 1967a), which includes chiefly neurons responding to tactile stimuli (Willis and Coggeshall, 1991). The properties of NNS neurons could be explained easily by the convergence of both dorsal column and lamina I inputs on individual NNS neurons; however, the PoT also receives an input from deep dorsal horn laminas (Gauriau and Bernard, 2004). These spinal neurons, often nociceptive of a wide dynamic range type (Menetrey et al., 1977), might also contribute to the properties of NNS PoT neurons.
The most striking property of both NNS and tactile PoT neurons is the fact that their projection targets (insular cortex and AStr) differed markedly from the target of NS PoT neurons (S2 cortex). The insular cortex, in the rat as in the primate, is a heterogeneous area that deals with gustatory and various autonomic-visceral functions (Cechetto and Saper, 1990; Allen et al., 1991; King et al., 1999). The caudal insular area that receives a majority of NNS and a lower number of tactile inputs from the PoT, corresponds to the visceral portion of the insular cortex (Cechetto and Saper, 1990; Allen et al., 1991). In the rat, the involvement of the caudal granular insular cortex in nociceptive processing remains essentially unknown, whereas in the primate it was clearly identified by positron emission tomography studies (Coghill et al., 1994; Casey et al., 1996; Craig et al., 2000) and electrophysiological recordings (Ostrowsky et al., 2002). Importantly, Berthier et al. (1988) showed, for six patients, that cortical lesion centered on insular cortex induced an asymbolia for pain. Thus it is suggested that the spinal/dorsal column-PoT-insular cortex pathway could participate in the recognition of the meaning and dangers of noxious stimuli.
The AStr overlaps and extends dorsal to the capsular portion of the central nucleus (CeLC) of the amygdala, a region that contains a high proportion of nociceptive neurons (Bernard et al., 1992) and is the main target of the lamina I-parabrachial-amygdaloid nociceptive pathway (Bernard and Besson, 1990; Bernard et al., 1993). Considering the facts that (1) numerous nociceptive neurons were also recorded in the core of AStr (Bernard et al., 1992) and (2) the AStr projects, similar to the CeLC area, chiefly on the substantia innominata (Bourgeais et al., 2001), it might be hypothesized that the AStr, like the CeLC, could play an important role in the aversive-emotional and autonomic component of pain. Thus the PoT-AStr projection would be complementary to the parabrachial-CeLC projection in the limbic processing of pain.
Conclusion
Our demonstration of a substantial spinal-PoT-S2/insular cortices nociceptive pathway fits well with the suggestion of Shi and Davis (1999) that both PoT and S2/insular cortices would play a key role in the acquisition of fear-potentiated startle in response to painful electric footshock. The spinal (lamina I)-PoT-S2/insular cortices nociceptive pathway in the rat might correspond, at least in part, to the lamina I-VMpo-insular cortex nociceptive pathway demonstrated by Craig et al. (1994) and Craig (1995) in the primate. Our results in the rat involve rather the S2 cortex, however, whereas in the monkey the VMpo targets clearly the insular cortex.
Footnotes
This work was supported by grants from the Institut National de la Santé et de la Recherche Médicale, the Ministére de l'Education Nationale, de l'Enseignement Supérieur et de la Recherche, the Association pour la Recherche sur le Cancer, and the Institut UPSA de la douleur Paris France. We thank Dr. R. Bandler for advice in the preparation of this manuscript.
Correspondence should be addressed to Dr. Jean-François Bernard, Institut National de la Santé et de la Recherche Médicale U-288, Faculté deMédecine Pitié-Salpêtriére, 91 Boulevard de l'Hôpital, 75634 Paris cedex 13, France. E-mail: jfbernar{at}ext.jussieu.fr.
Copyright © 2004 Society for Neuroscience 0270-6474/04/240752-10$15.00/0


