

Abstract
Synaptic depression was studied using capacitance measurements in synaptic terminals of retinal bipolar neurons. Single 250 msec depolarizations evoked saturating capacitance responses averaging ∼150 fF, whereas trains of 250 msec depolarizations produced plateau capacitance increases of ∼300 fF. Both types of stimuli were followed by pronounced synaptic depression, which recovered with a time constant of ∼8 sec after single pulses but required >20 sec for full recovery after pulse trains. Inactivation of presynaptic calcium current could not account for depression, which is attributed instead to depletion of releasable and reserve vesicle pools that are recruited and replenished at different rates. Recovery from depression was normal in the absence of fast endocytosis, suggesting that replenishment was from a reserve pool of preformed vesicles rather than from preferential recycling of recently fused vesicles. Given the in vivo light response of the class of bipolar neuron studied here, it is likely that, under at least some illumination conditions, the cells produce a fast and phasic bout of exocytosis rather than tonic release.
- retina
- bipolar cell
- calcium current
- synaptic terminal
- capacitance
- exocytosis
- endocytosis
- synaptic transmission
- synaptic ribbon
Repeated neuronal stimulation often leads to synaptic depression or fatigue. Depression has been described in a wide variety of synaptic preparations, including invertebrate and vertebrate neuromuscular junctions (Thies, 1965; Betz, 1970; Katz et al., 1993;Atwood et al., 1994), the squid giant synapse (Charlton et al., 1982;Swandulla et al., 1991), and Aplysia californica and mammalian CNS synapses (Eliot et al., 1994; Borst et al., 1995; Thomson and Deuchars, 1995; Debanne et al., 1996; Rosenmund and Stevens, 1996). At crustacean neuromuscular junctions, for example, depression is characteristic of phasic (fast twitch) synapses, whereas facilitation typically is observed at tonic synapses (Katz et al., 1993; Atwood et al., 1994). As with other forms of synaptic plasticity (Zucker, 1989), either presynaptic or postsynaptic mechanisms potentially could be responsible for synaptic depression. Here, we present an investigation of synaptic depression and the recovery from depression by using capacitance measurements (Neher and Marty, 1982; Gillis, 1995) in giant synaptic terminals of type Mb1 bipolar neurons from goldfish retina (Sherry and Yazulla, 1993). Capacitance measurements provide a direct view of presynaptic exocytosis and thus eliminate postsynaptic possibilities. The results suggest that synaptic depression in bipolar cell terminals is caused by the depletion of vesicles in the readily releasable pool and that inactivation of calcium current does not play a role. Also, there is evidence for at least three vesicle populations, distinguished by their readiness of access to the release process. First, there is a rapid-release pool, possibly corresponding to the vesicles tethered to synaptic ribbons (Witkovsky and Dowling, 1969), which can be released completely in ∼200 msec during strong depolarization. Second, a reserve pool can replenish the depleted rapid-release pool with a time constant of ∼8 sec, but this pool may contain only enough vesicles to reload the ribbons one time. Third, a large reservoir of vesicles—possibly the entire population within the terminal—is available to refill the reserve pool, but this requires >20 sec for completion.
Teleost Mb1 bipolar cells respond to light flashes with large, rapid depolarizations lasting ∼200 msec (Saito et al., 1979). Natural stimuli thus may deplete the readily releasable vesicle pool and lead to complete depression of synaptic transmission. This may explain in part why sustained depolarizations of bipolar cells cause only transient excitatory postsynaptic responses in ON–OFF ganglion and amacrine cells (Dacheux and Raviola, 1986; Mittman et al., 1990; Dixon and Copenhagen, 1992). The pronounced depression reported here, together with the high calcium threshold for exocytosis of Mb1 bipolar neurons, suggests that these neurons do not release neurotransmitter tonically (Atwood et al., 1994), in contrast to OFF-type bipolar cells (Werblin and Dowling, 1969) and photoreceptors in darkness (Dowling and Ripps, 1973; Rieke and Schwartz, 1996). Instead, this class of bipolar cells likely responds to depolarization with a rapid and phasic release of neurotransmitter, at least under illumination conditions that produce large depolarizations.
A brief account of some of these results has been published previously (von Gersdorff and Matthews, 1995).
MATERIALS AND METHODS
Cell dissociation. The preparation of isolated goldfish retinal bipolar cells was detailed previously by Heidelberger and Matthews (1992). Bipolar cells were dissociated by mechanical trituration of pieces of isolated retina after enzymatic digestion with hyaluronidase (1100 U/ml; Sigma, St. Louis, MO) and papain (30 u/ml; Fluka, Neu-Ulm, Germany) at room temperature (20–26°C). Electrical recordings were made from single synaptic terminals as well as from intact bipolar cells (von Gersdorff and Matthews, 1994a). Mb1 bipolar cell terminals (Sherry and Yazulla, 1993) were identified by their size (8–12 μm in diameter) and bulbous morphology. An inverted microscope (Zeiss IM, Oberkochen, Germany) was used for cell visualization and fluorescence excitation of Fura-2. Calibration and calculation of intracellular calcium from Fura-2 fluorescence were as described byHeidelberger and Matthews (1992).
Electrophysiology. The extracellular recording solution contained (in mm): NaCl 120, KCl 2.5, MgCl21.0, CaCl2 2.5, glucose 10, and HEPES 10, pH 7.4 with NaOH. The standard patch-pipette solution used to isolate calcium currents consisted of (in mm): Cs-gluconate 120, TEA-Cl 10, HEPES 10–35, EGTA-K4 or BAPTA-Cs4 0.5, ATP-Na2 2, MgCl2 2–3, GTP 0.5, and Fura-2 0.1–0.2, pH 7.2 with CsOH. Experiments also were done with 120 mm K-gluconate (n = 8) or Cs-glutamate (n = 6), instead of Cs-gluconate, and identical capacitance changes were obtained. The osmolarity of the pipette solution varied from 260–290 mOsm. Pipettes were pulled from thick-walled Pyrex glass, with an outer diameter of 1.2 mm and an inner diameter of 0.6 mm. To reduce pipette capacitance and noise, we coated pipettes by dipping them in low-melting-point dental wax, followed by brief fire polishing. The open tip resistance was 7–10 MΩ, and access resistance was 12–25 MΩ after whole-cell break-in. Seal resistance was often >10 GΩ, and only cells with a stable leak current <40 pA usually were accepted. A slight positive pressure (3–5 mm Hg with our tubing) was applied sometimes before break-in to null pipette internal capillary pressure. Records with leak currents of 5–20 pA often were obtained from bipolar cells under these conditions. Terminals with stable leak currents from 80 to 100 pA had resting [Ca2+]i ≈ 1 μm (with 0.5 mm EGTA or BAPTA and 0.1–0.2 Fura-2 in the patch pipette) and capacitance responses that were step-like (e.g., Fig. 3). Recordings were done at room temperature (20–26°C).

Repetitive responses occur in the absence of fast endocytosis. Fast endocytosis was inhibited by elevation of [Ca2+]i to 1 μm, as measured by Fura-2 (0.2 mm). The arrows show timing of 1 sec depolarizations from −60 to 0 mV, which evoked repetitive capacitance jumps (A). The interval between successive stimuli was sufficient to prevent the saturation of the cumulative capacitance response observed with more rapid repetitive stimulation (e.g., Fig. 6). This terminal had a stable inward leak current of 80 pA at −60 mV, which generated the elevated resting [Ca2+]i. Access conductance (B) and membrane conductance did not change throughout the recording. The standard pipette solution (see Materials and Methods) contained 0.5 mm EGTA. Similar step-like responses also were observed in other terminals in which the leak current was below 20 pA but in which [Ca2+]i was buffered to an elevated level with exogenous Ca/Ca buffer mixtures (data not shown).
Voltage pulses applied through the EPC-7 (List-Medical, Darmstadt, Germany) or Axopatch 200A (Axon Instruments, Foster City, CA) patch-clamp amplifier were generated by an Atari Mega ST4 computer running E7 Screen software (Heka, Germany) driving an ITC-16 interface (Instrutech, Elmont, NY) or by an EPC-9 (List) patch-clamp amplifier controlled by an Atari Mega STe computer. For capacitance measurements with the EPC-7, the voltage pulse was passed first through a hardware lock-in amplifier (MPI, Göttingen, Germany), in which an 800 Hz (30 mV peak-to-peak) sinusoidal voltage was superimposed on the −60 mV holding potential. Then the resulting sinusoidal currents were analyzed at two orthogonal phases by the lock-in amplifier, which generated signals proportional to the currents at the two phases. Together with the DC membrane current, these signals were acquired by a second Atari Mega ST4 computer and used to calculate membrane capacitance, access conductance, and membrane conductance (Gillis, 1995). This arrangement allowed a capacitance measurement every 0.2 sec, limited by the software processing and data display times. In all cases analyzed, activation of calcium current produced capacitance changes without correlated changes in access resistance or membrane conductance. Capacitance measurements during active conductance changes were blanked, because these violate the passive three-element cell model used to deduce capacitance changes (Gillis, 1995). The active currents, including calcium current, were digitized separately at high temporal resolution by the computer controlling the patch-clamp amplifier. Capacitance also was measured with the EPC-9 (List) amplifier using its automatic capacitance compensation feature, which had a maximum temporal resolution of 0.34 sec. Both methods of monitoring capacitance gave equivalent results. Data analysis was performed with the software REVIEW (Instrutech) and Xact (Ver. 3.0, Scilab, GmbH, Germany).
Rundown and endogenous calcium buffers. Multiple depolarization-triggered capacitance responses typically could be elicited from Mb1 terminals under whole-cell patch clamp, but capacitance responses became smaller and eventually disappeared with time (rundown or washout), although robust calcium current and large changes in [Ca2+]i were observed throughout the recording. This phenomenon is also commonly observed in capacitance measurements in chromaffin cells (Augustine and Neher, 1992; Burgoyne, 1995). The absence of capacitance response with continued large calcium current demonstrates there was no detectable capacitance artifact caused by gating charges (Horrigan and Bookman, 1994). The degree of rundown was variable from terminal to terminal, with some displaying responses for up to 20 min. Similar rundown of glutamate secretion was observed by Tachibana and Okada (1991) in goldfish Mb1 bipolar terminals.
We used 0.5 mm calcium chelator (EGTA or BAPTA) in our standard pipette solution (see above). To determine whether dialysis of terminals with this level of buffer affected capacitance responses, we measured the initial capacitance responses of terminals to a depolarizing pulse (250 msec from −60 to 0 mV) elicited 3–20 sec after break-in, with pipettes containing 0.5 mm BAPTA and 0.1 mm Fura-2. Within this time window, the average increase in capacitance was 156 ± 28 fF (mean ± SEM,n = 10), and the recovery of capacitance back to initial baseline (endocytosis) was exponential with an average time constant τ = 1.1 sec. For comparison, responses were elicited 60 sec or more after break-in, when the terminal was fully dialyzed by the pipette solution, as judged by the plateauing of Fura-2 fluorescence (τ = 15–40 sec; data not shown). These later responses had an average amplitude of 146 ± 34 fF and a slightly slower endocytosis time constant τ = 1.5 sec. Assuming that Fura-2 and BAPTA enter the terminal at approximately the same rate after break-in, the similarity in early and late responses suggests that 0.5 mmBAPTA does not significantly alter capacitance responses elicited by 250 msec pulses or that the loss of endogenous mobile calcium buffers is approximately balanced by the addition of BAPTA.
RESULTS
Saturation of capacitance responses with increasing calcium current
Previous work in giant synaptic terminals of goldfish retinal bipolar neurons demonstrated that capacitance responses evoked by depolarizing pulses saturate at a plateau of ∼150 fF for pulse durations exceeding ∼200 msec (von Gersdorff and Matthews, 1994a). Figure 1 shows that a similar saturation of the capacitance response is also apparent when the pulse duration is fixed at 250 msec, the pulse voltage is varied, and the size of the capacitance response is plotted against the amplitude of the observed calcium current. For currents greater than ∼150 pA, the capacitance response reached a maximum size, which again averaged ∼150 fF. The observed amplitude of the capacitance response for large currents was similar when either a fast calcium buffer (0.5 mm BAPTA;filled circles in Fig. 1) or a slow calcium buffer (0.5 mm EGTA; open circles in Fig. 1) was included in the patch-pipette solution. This saturation of the capacitance response at larger currents is further indication that a limited pool of vesicles is available for rapid release in bipolar cell synaptic terminals. Once calcium influx is sufficient to exhaust this pool, additional calcium influx will not lead to a further increase in the capacitance response. Similar saturation of capacitance responses also is seen in experiments using photorelease of caged calcium (Heidelberger et al., 1994), in which calcium remains elevated for several seconds after a flash, but the increase in capacitance reaches its asymptotic value within a few milliseconds or less.

Dependence of capacitance response on size of calcium current. The average capacitance jump is plotted versus calcium current amplitude. Pulses were 250 msec depolarizations from the holding potential of −60 to −20, −10, or 0 mV. Each data point is the average of 4–11 responses, and thevertical lines show ± 1 SEM. Across-cell averages at each current range were obtained by binning in 50 pA increments of observed calcium current. The position of each data point along the abscissa shows the average current within each bin. The standard pipette solution (see Materials and Methods) was used, with either 0.5 mm BAPTA (filled circles) or 0.5 mm EGTA (open circles). Results are shown from 13 cells for EGTA and 29 cells for BAPTA.
Recovery after depletion
The rapidly releasable pool observed in capacitance experiments corresponds to ∼6000 synaptic vesicles, which matches closely the estimated population of vesicles tethered to synaptic ribbons in the bipolar cell terminal (von Gersdorff et al., 1996). We will assume here, then, that the saturating response illustrated in Figure 1reflects the depletion of vesicles on the ribbons. Therefore, we next asked how long it takes to repopulate the ribbon after it is denuded by a saturating stimulus. To answer this, a 250 msec depolarization was given to empty the readily releasable pool, and refilling of the pool was examined with a second depolarizing stimulus given a variable time later. Figure 2 summarizes the results. When the second stimulus followed the first by a few seconds (Fig.2A), the second capacitance response was smaller than the first. When the interval between stimuli was greater, however, the second response was comparable in size to the first (Fig.2B). Figure 2C shows results from a number of such experiments. The time course of recovery was approximately exponential, with a time constant of 8 sec. Figure 2Ddemonstrates that the calcium current elicited by the second pulse was unchanged for all but the shortest interpulse intervals, where a small amount of calcium-dependent inactivation (von Gersdorff and Matthews, 1996) was observed. Even at these short intervals, however, the calcium current during the second depolarization was still of sufficient amplitude to elicit a maximal capacitance response (Fig. 1). Together with the lack of correspondence between the time course of recovery of the calcium current and the time course of recovery of the capacitance response, this demonstrates that the depression of the capacitance response after a saturating stimulus cannot be attributed to inactivation of presynaptic calcium current.

Paired-pulse depression and recovery.A, Two capacitance responses were elicited ∼4 sec apart. The arrows show the timing of 250 msec pulses from −60 to 0 mV. The indicated time is relative to break-in.B, Two capacitance responses were elicited ∼46 sec apart. The arrows indicate timing of 250 msec pulses from −60 to 0 mV. C, Summary of experiments like those in A and B. So that results can be compared across cells, the second capacitance response is expressed as a percentage of the first jump. The interval between pulses is shown on the abscissa. The solid line is the best-fit single exponential, which has a time constant τ = 8 sec (correlation coefficient = 0.95). Each data pointrepresents the result from a single terminal, and there is one point per terminal. The exception is the point at 0.75 sec, which represents the average of 27 terminals. D, The same experiments as in C, showing the corresponding calcium current amplitudes. The pipette solution contained either 0.5 mmBAPTA or 0.5 mm EGTA. Not all corresponding calcium currents are shown, because some terminals were recorded with K-gluconate in the patch pipette (see Materials and Methods).
Under normal conditions, the capacitance rapidly returns to baseline (fast endocytosis; time constant τ = 1–2 sec) after a bout of depolarization-triggered exocytosis (e.g., Fig.2A,B). However, fast endocytosis was not required for recovery of the capacitance response after depletion. To dissociate endocytosis from exocytosis, we exploited the fact that fast endocytosis in bipolar cell terminals is inhibited by elevated intracellular calcium at concentrations that do not themselves evoke capacitance increases or exocytosis (von Gersdorff and Matthews, 1994b). Inhibition of fast endocytosis by high internal calcium also has been reported recently in rat pituitary nerve terminals (Hsu and Jackson, 1996). This allows experiments like that shown in Figure3, in which endocytosis is inhibited by elevated [Ca2+]i, but depolarization-evoked exocytosis is normal. In Figure 3, three successive normal amplitude capacitance jumps were evoked by depolarizing pulses—producing an overall capacitance increase of 450 fF—although fast endocytosis was absent. So, the exocytotic response recovered fully during the interval between pulses despite the inhibition of fast endocytosis. Fast endocytosis in bipolar cell terminals also can be blocked by slight pressure-induced swelling without altering basal [Ca2+]i (R. Heidelberger and G. Matthews, unpublished data). With this method of inhibiting endocytosis, step-like capacitance responses of normal amplitude also were observed with successive depolarizations (data not shown). Thus, the recovery of capacitance responses to normal size after depletion taps a reserve pool of preformed vesicles within the terminal without requiring fast retrieval of recently added membrane. This reserve pool presumably represents all or part of the several hundred thousand vesicles observed in electron microscopy of the giant bipolar cell terminals (von Gersdorff et al., 1996).
Long-duration depolarization elicits larger capacitance responses
If the recovery process shown in Figure 2 operates during depolarization as well as in the interval between two brief depolarizations, then it would be expected that long depolarizations should elicit larger capacitance jumps than brief depolarizations. To examine this, we compared capacitance responses evoked by 250 msec, 1 sec, and 2 sec depolarizing pulses. Figure 4 shows example responses and a summary of the results. The average capacitance jumps were not significantly different for 250 msec and 1 sec pulses, although the total Ca2+ influx into the terminal was more than three times larger for the 1 sec pulses. This extends our earlier observation that pulses from 250–450 msec in duration all elicit the same size of capacitance response (von Gersdorff and Matthews, 1994a). However, capacitance jumps for 2 sec pulses were larger than for the briefer pulses (Fig. 4B,C), suggesting that 2 sec stimuli provide sufficient time for partial refilling of the ribbons during the depolarization. Pulses longer than 2 sec were not examined because of pronounced calcium-dependent inactivation of calcium current during pulses of such long duration (von Gersdorff and Matthews, 1996). For an exponential recovery process with a time constant of 8 sec (Fig.2), the capacitance response for a 2 sec pulse would be expected to be ∼20% larger than for a 250 msec pulse. The observed increase with 2 sec stimuli (Fig. 4) was greater than this, suggesting that recovery may be speeded during depolarization. A similar observation in chromaffin cells has been taken as evidence that recovery of granule pools from depletion is calcium-dependent (von Rüden and Neher, 1993), but we have not pursued this possibility further in bipolar cell terminals.

Long-duration depolarization produces a larger capacitance response. A, Two responses from the same terminal are superimposed. Both responses were elicited at thearrow by depolarizations from a holding potential of −60 to 0 mV. The first lasted 250 msec (open circles) and the second, given 24 sec afterward, lasted 1 sec (closed circles). B, Two responses from another terminal again are superimposed. Both responses were elicited at thearrow by depolarizations from a holding potential of −60 to 0 mV. The first lasted 250 msec (open circles) and the second, given 179 sec afterward, lasted 2 sec (closed circles). C, The average capacitance jump is plotted as a function of pulse duration for pulses lasting 250 msec (n = 10), 1 sec (n = 10), or 2 sec (n = 5).
Depression after weaker stimuli
The results so far suggest that neurotransmitter release evoked by strong depolarization is highly transient in bipolar neurons of the type used in our capacitance experiments. The degree of synaptic depression might be different with weaker depolarizing pulses, however. To examine this, we measured the amount of depression produced by 250 msec depolarizing pulses of different amplitudes, as summarized in Figure 5. A pair of pulses was presented with an interpulse interval of 1 sec. Figure 5A shows that, with depolarization to −10 mV, the results were comparable to those described above for pulses to 0 mV (e.g., Fig. 2): the first pulse evoked a large capacitance response, but the response to the second pulse was strongly depressed (17% of the first response, on average). The average calcium current was slightly smaller for the second pulse (Fig. 5B), but both currents were within the range expected to produce saturating capacitance responses, if given in isolation (see Fig. 1). Therefore, inactivation of calcium current, again, cannot account for the depression.

Paired-pulse depression at different pulse voltages. A, Capacitance responses for first (gray bars) and second pulses (white bars) of a pair with an interpulse interval of 1 sec. Pulses were 250 msec depolarizations from −60 mV to −10 mV (n = 10), −20 mV (n = 11), or −30 mV (n = 5). Error bars indicate ± 1 SEM.Percentage numbers indicate the second response expressed as a percentage of the first. B, Calcium currents for first and second pulses for same set of responses asA. The pipette solution contained 0.5 mmBAPTA.
With depolarization to −20 mV, the capacitance response to the first pulse was smaller than that for depolarization to −10 mV, and there was less depression (second response 41% of first; Fig.5A). Decreasing the amplitude of depolarization to −30 mV further reduced the capacitance response to the first pulse and eliminated depression (second response 136% of first; Fig.5A). For both of these voltages, the calcium current was not significantly different for the first and second pulses (Fig.5B). Thus, if depletion of the releasable pool by the first pulse of a pair is reduced by changing the pulse voltage, the amount of depression observed with the second pulse also is reduced. This is consistent with the idea that paired-pulse depression reflects depletion of a releasable pool of vesicles.
Another way of reducing the amount of release per pulse is the inclusion of exogenous calcium buffer in the patch-pipette solution (von Gersdorff and Matthews, 1994a). When synaptic terminals were dialyzed with pipette solutions containing either 5 or 10 mm calcium buffer (EGTA or BAPTA), most terminals failed to show a detectable capacitance response after a 250 msec depolarization to −10 mV. In a subset of terminals, however, detectable capacitance responses were observed to single pulses, and we examined paired-pulse depression in this subgroup. In those terminals that did show responses, the average amplitude of the capacitance jump to the first pulse was reduced substantially (33 ± 2 fF; mean ± SEM,n = 14), although the calcium current was normal (−212 ± 17 pA). The capacitance response to a second 250 msec depolarization to −10 mV, given 1 sec after the first, was significantly larger than the first response in these cells (55 ± 10 fF; mean ± SEM, n = 14; calcium current = −197 ± 17 pA). Thus, rather than paired-pulse depression, paired-pulse facilitation was observed in the presence of exogenous calcium buffer (Borst et al., 1995; Tank et al., 1995; Atluri and Regehr, 1996). Taken together with the results with weaker depolarization (−30 mV; Fig. 5A), this suggests that the amount of initial exocytosis is a determinant of whether paired-pulse depression or facilitation is observed, as reported for hippocampal synapses by Debanne et al. (1996).
Capacitance response to a train of pulses
Retinal bipolar neurons commonly are thought to signal sustained changes in illumination lasting for many seconds or minutes. As a measure of sustained synaptic release, we also studied cumulative capacitance responses to trains of stimuli, consisting of single 250 msec depolarizing pulses repeated at a frequency of 1 Hz. Figure6A shows the average cumulative capacitance increase during pulse trains, relative to the baseline capacitance before the onset of the train. With depolarizations to −10 mV in the presence of 0.5 mm BAPTA (Fig.6A, filled circles), capacitance initially jumped by ∼150 fF and then increased more slowly for the next few pulses before reaching a plateau value of ∼300 fF. Further pulsing failed to increase the capacitance beyond this plateau. The pronounced depression or saturation in capacitance increases was, however, accompanied by progressive inactivation of the calcium current elicited by the pulses (Fig. 6B, filled circles). This is also apparent when the capacitance increase is plotted as a function of the calcium current, as shown by the filled circles in Figure6C. Thus, it is unclear whether the plateau under these stimulus conditions represents depletion of a reserve pool of vesicles or reduction of calcium influx, a question we will address next.

Cumulative capacitance changes elicited by trains of depolarizing pulses. A, The average cumulative capacitance change elicited by trains of depolarizing pulses was measured relative to the resting membrane capacitance before the onset of the pulse train. The trains consisted of 250 msec pulses from −60 to −10 mV (0.5 mm BAPTA, filled circles,n = 10; 5.0 mm BAPTA, filled triangles, n = 22) or −30 mV (open circles, n = 5), delivered at 1 Hz. The patch pipette contained either 0.5 or 5.0 mm BAPTA, as indicated in the inset. No significant endocytosis was detected between pulses because of the elevated [Ca2+]i (data not shown) [von Gersdorff and Matthews (1994b), their Fig. 4a]. B, Calcium currents from the same set of experiments as in A. Pronounced calcium-dependent inactivation of calcium current is evident for the −10 mV pulse series with 0.5 BAPTA (filled circles). Less inactivation is observed with 5.0 mmBAPTA (filled triangles) and with the −30 mV pulses (open circles). The standard pipette solution (see Materials and Methods) was used with the indicated amounts of BAPTA. C, The data from B andC are replotted, showing the capacitance increase as a function of calcium current during the pulse train.
When a train of −30 mV pulses was presented, the capacitance rose approximately linearly, without the large initial jump seen with stronger depolarizations. A plateau of elevated capacitance again was reached with continued pulsing (Fig. 6A, open circles). Because the calcium current was much smaller with depolarization to −30 mV (Fig. 6B, open circles), there was less inactivation of the current during the train of pulses. This can be seen in Figure 6C (open circles) by the steepness of the relation between calcium current and cumulative capacitance increase. Also, the calcium current with the −30 mV pulses was similar to the asymptotic current reached during inactivation with −10 mV pulses (compare filled and open circlesin Fig. 6B,C). Thus, a level of current that was sufficient to support progressive capacitance increase during the early part of the −30 mV pulse train was not able to produce continued capacitance increase during the later part of the −10 mV pulse train. This suggests that the plateau of capacitance with −10 mV pulses is not attributable to the observed inactivation of the calcium current.
We also examined responses to repetitive stimulation when the amount of release per pulse was reduced by adding calcium buffer rather than by reducing the depolarization. With 5.0 mm BAPTA in the patch pipette, capacitance in response to trains of −10 mV pulses showed an initial facilitation, followed by a steady increase up to a plateau level (Fig. 6A, filled triangles). Inactivation of calcium current was reduced by the buffer (Fig. 6B,C; also see von Gersdorff and Matthews, 1996). When the concentration of calcium buffer in the patch pipette (either BAPTA or EGTA) was increased to 10 mm, a single 250 msec pulse to −10 mV produced a detectable capacitance increase in only 9 of 30 trials (for cells with calcium current >100 pA), and so the average single-pulse capacitance response was not significantly different from zero (counting undetectable responses as zero amplitude responses in calculating the average). However, with repetitive pulses given once per second, the cumulative capacitance changed by 175 ± 23 fF (mean ± SEM, n = 7) after five pulses for 10 mm EGTA, but only by 55 ± 21 fF (n = 8) for 10 mm BAPTA. Thus, for pulse trains, EGTA was less effective than BAPTA in preventing capacitance changes, as reported previously (von Gersdorff and Matthews, 1994a). The reason for this difference between BAPTA and EGTA in responses to pulse trains given at 1 Hz is uncertain. We speculate, however, that BAPTA may be more effective than EGTA at avoiding calcium “spillover” (Roberts, 1994;Tucker and Fettiplace, 1995; Cooper et al., 1996) between neighboring active zones (i.e., ribbons). By contrast, in the squid giant synapse, concentrations of up to 80 mm EGTA do not affect release (Adler et al., 1991).
In all pulse and buffer conditions shown in Figure 6, the cumulative capacitance increase produced by pulse trains had a similar plateau amplitude of ∼300 fF. A simple interpretation is that the plateau represents depletion of a vesicle pool, in this case representing the vesicles available to replenish the readily releasable pool. Assuming the capacitance of a single vesicle is 26.4 aF (von Gersdorff et al., 1996), a cumulative increase in capacitance of ∼300 fF corresponds to the fusion of at least 12,000 vesicles with the plasma membrane. This is approximately twice the estimated number of vesicles on all the synaptic ribbons in a giant bipolar cell terminal (von Gersdorff et al., 1996). Thus, during repeated stimulation, it seems that synaptic ribbons are reloaded only once before exocytosis ceases. Perhaps a reserve pool of vesicles near the ribbon accounts for the rapid refilling of empty ribbons (see Fig. 2C), and depletion of this reserve pool accounts for failure of continued refilling during repeated stimulation.
Recovery of capacitance responses after prolonged stimulation
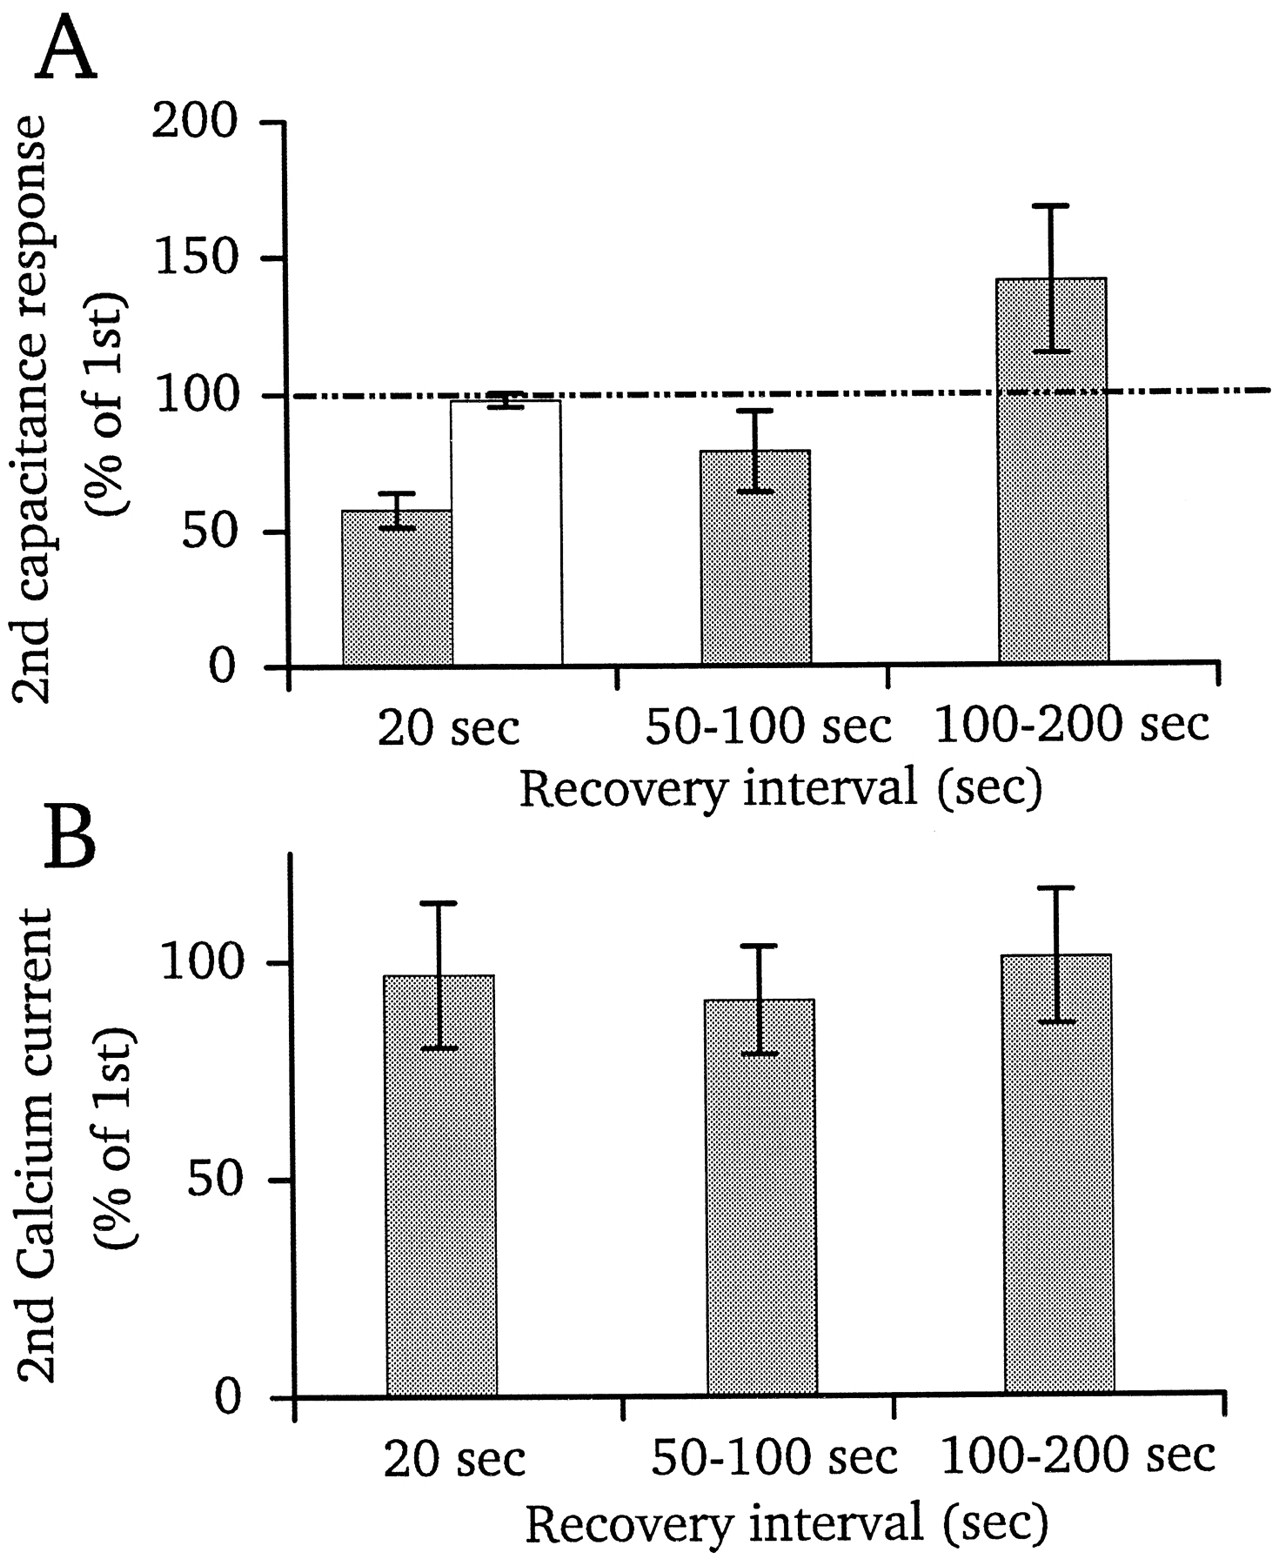
We next asked how long after a train of pulses it takes for the capacitance response to return to normal amplitude. By comparing this recovery of the capacitance response with the recovery rate from calcium current inactivation, we can further test if inactivation can account for the apparent plateau of capacitance seen during pulse trains. Figure 7A shows that after trains of pulses a longer time for the recovery of responses was necessary than for paired-pulse depression. For example, when a test pulse was given ∼20 sec after termination of the pulse train, the response was still depressed (left gray bar, Fig. 7A; average recovery time 21 sec). By contrast, with paired-pulse depression 20 sec was sufficient for complete recovery (white bar, Fig.7A; also see Fig. 2C). The calcium current elicited by the test pulse is shown in Figure 7B, relative to the control calcium current evoked by the first pulse of the pulse train. Calcium current recovered fully to its original amplitude after ∼20 sec, which suggests that inactivation of the current is not responsible for depression. When the recovery interval was between 50 and 100 sec (Fig. 7A, middle gray bar; average recovery time 79 sec), the test response was, on average, somewhat depressed as compared with the initial response, although the difference was not statistically significant. With still longer recovery time (average recovery time 155 sec), the test response was slightly larger than normal (again, not statistically significant). If saturation of capacitance during pulse trains reflects depletion of a reserve pool, then the slowing of the recovery time after trains suggests that replenishment of the reserve pool requires longer time than replenishment of the readily releasable pool (see Fig. 2).

Recovery of capacitance responses after prolonged stimulation. A, The capacitance jump to a 250 msec pulse from −60 to −10 mV was measured at various intervals after a train of pulses like those shown in Figure 6A. The size of this jump is plotted as a percentage of the first jump in the pulse train. Recovery interval refers to the time between the termination of the pulse train and the delivery of the 250 msec test pulse. The capacitance recovered to only ∼60% of the control level for pulses elicited ∼20 sec after the pulse train (n = 4). For comparison, the white bar shows the amount of recovery observed at the same time interval with paired pulse depression (n = 12; Fig.2C). Percentage of recovery of the capacitance jump also is shown for intervals in the range from 50 to 100 sec and from 100 to 200 sec. B, Recovery of calcium currents for the same set of experiments as A. Current elicited by the test pulse is expressed as a percentage of the first calcium current in the pulse train.
DISCUSSION
Depletion and refilling of vesicle pools
In bipolar cell synaptic terminals, capacitance responses evoked by strong depolarization saturate for pulse durations from 250 msec to 1 sec. Saturation of postsynaptic responses with increasing presynaptic pulse duration also occurs in Aplysia synapses (Shapiro et al., 1980), the squid giant synapse (Llinás et al., 1981), and amacrine cell synapses (Gleason et al., 1994). Pronounced synaptic depression was observed after a saturating capacitance response. In paired-pulse experiments, recovery from depression followed an exponential time course, with a time constant of 8 sec. Experiments on other presynaptic terminals (Betz, 1970; Swandulla et al., 1991; Katz et al., 1993) have yielded time constants of 5–8 sec for recovery from depression. Thus, both conventional and ribbon-type synapses have similar recovery rates. By contrast, adrenal chromaffin cells take ∼1–3 min to recover fully from depleting stimuli (von Rüden and Neher, 1993; Burgoyne, 1995; Seward and Nowycky, 1996), provided Mg-ATP is available (Parsons et al., 1995). Inactivation of presynaptic calcium current was not involved in depression in bipolar cell terminals, suggesting that the reduction in response size was attributable to depletion of a readily releasable pool of synaptic vesicles. At the squid giant synapse, calcium currents are constant during depression, also leading to the hypothesis that vesicle pools become depleted (Charlton et al., 1982). Thus, calcium current inactivation may function as a safety mechanism to protect terminals from calcium overload when synaptic vesicles are no longer available for release.
The size of the saturating capacitance response corresponds well with the estimated number of vesicles tethered to synaptic ribbons in the bipolar cell terminal (von Gersdorff et al., 1996). We assume, therefore, that depression results from depletion of the vesicles tethered to the ribbons. In fish electroreceptors, which also have ribbon-type synapses, depression of postsynaptic responses is, indeed, associated with depletion of vesicles from the ribbons (Fields and Ellisman, 1985). If this is also true for bipolar cell ribbons, then the time course of recovery from depression represents the rate of repopulation of denuded ribbons by synaptic vesicles. Fast endocytosis was not required for recovery from depression, and so the replenishment of the release-ready pool occurs from cytoplasmic reserve vesicles. Conventional active zones also have a reserve pool of synaptic vesicles that can be depleted after prolonged stimulation (Heuser and Reese, 1981; Pieribone et al., 1995).
During a train of repetitive depolarizing pulses, capacitance rose to an elevated plateau beyond which there was no further increase with continued pulsing. This plateau capacitance increase (∼300 fF) was similar in size to the capacitance increase evoked by dialysis with [Ca2+]i buffered at 50–60 μm(also ∼300 fF; von Gersdorff and Matthews, 1994a). One interpretation of the saturation of capacitance during repetitive stimulation is that a reserve pool of vesicles reloads ribbons quickly (8 sec time constant), but this reserve pool has limited capacity and can be depleted itself. From the amount of added capacitance during pulse trains, the reserve pool is estimated at 6000 vesicles, which is sufficient to reload the ribbons one time. This ready-reserve pool is much smaller than the reservoir of several hundred thousand vesicles in the giant terminal as a whole (von Gersdorff et al., 1996), and so it represents a small subgroup of the entire population of preformed vesicles. Repetitive depolarizations also have been shown to deplete distinct vesicle pools in chromaffin cells (Heinemann et al., 1993;Horrigan and Bookman, 1994). The phasic ribbon-type synapse of lobster neuromuscular junction also displays pronounced depression (Katz et al., 1993). We emphasize, however, that there are other possible mechanisms for saturation of the capacitance response during pulse trains, such as accumulation or depletion of intracellular factors that affect release and adaptation of the calcium sensor for exocytosis (Hsu et al., 1996).
If we assume that the plateau of capacitance during pulse trains represents depletion of reserve vesicles, then replenishment of this reserve pool from other vesicle reservoirs must be slower than the reloading rate of the ribbons. Otherwise, the capacitance would not saturate and instead would continue to increase during a train of stimuli. Slower replenishment was, in fact, observed: recovery of a normal capacitance response required >20 sec after pulse trains but was complete within 20 sec after single pulses. Different rates of recovery also have been reported in experiments using FM1-43 fluorescence to monitor vesicle dynamics in single hippocampal boutons (Ryan et al., 1996). For example, Stevens and Tsujimoto (1995) andRosenmund and Stevens (1996) report a recovery time of 8–10 sec for brief stimuli (∼20 vesicles released), whereas Liu and Tsien (1995)find that recovery requires 40 sec after more prolonged stimulation (∼90 vesicles released). If the hippocampal synapses behave similarly to the bipolar cell terminals, then the different stimulation protocols may explain this difference in recovery rates.
Calcium buffers, depression, and facilitation
Depression was observed whenever the initial depolarization evoked a large capacitance response. If the initial response was made smaller, either by reducing the depolarization or by adding exogenous calcium buffer, depression was attenuated or eliminated, and facilitation was observed (Fig. 6). The possibility thus emerges that differences in levels of endogenous calcium-binding proteins might underlie differences in paired-pulse facilitation and depression among different synaptic terminals or during development (Bolshakov and Siegelbaum, 1995). For example, trains of impulses produce either facilitation or depression at different Ia afferent boutons onto single spinal motor neurons (Collins et al., 1984). At crustacean neuromuscular junctions (Katz et al., 1993; Atwood et al., 1994) similar variation has been attributed to presynaptic mechanisms. Although the calcium-buffering capacity of the terminals is unknown in these instances, calcium-binding proteins are expressed differentially within subpopulations of neurons in various brain regions and during development (Baimbridge et al., 1992). We speculate, then, that synaptic terminals with a large buffering capacity would be more likely to show facilitation, whereas those with a low buffering capacity would more likely undergo depression.
Phasic synaptic transmission at Mb1 bipolar cell terminals
From capacitance measurements we infer that the synaptic terminals of type Mb1 bipolar cells release transmitter transiently. Other observations also support the idea that transmitter release is transient in this class of bipolar neuron. Tachibana and Okada (1991), have measured “postsynaptic” currents evoked in cultured horizontal cells closely opposed to patch-clamped goldfish Mb1 bipolar cell terminals. During a 2 sec activation of presynaptic calcium current in the bipolar neuron [Tachibana and Okada (1991), their Fig. 7], the postsynaptic current declined substantially, with a time course not correlated with inactivation of the bipolar cell calcium current. Because the glutamate-activated current of the horizontal cells is sustained during prolonged glutamate application (Tachibana and Okada, 1991), the decline of the postsynaptic response likely represents depletion of a readily releasable pool of vesicles. Simultaneous intracellular recordings from synaptically connected amacrine and ON-type bipolar cells in carp retina (Kujiraoka et al., 1988) also show that the postsynaptic response of amacrine cells is transient during sustained injection of depolarizing current into the presynaptic bipolar neuron, suggesting that neurotransmitter is released only transiently by bipolar cells. In the intact retina, additional mechanisms such as feedback inhibition from amacrine cells onto bipolar cell terminals also likely contribute to shaping transient responses in ganglion cells (Massey and Maguire, 1995), particularly at high light levels. It recently has been suggested on the basis of FM1-43 labeling that ON-type bipolar cells release transmitter continuously (Lagnado et al., 1996), but it is unclear that the membrane turnover revealed in those experiments is related to neurotransmitter release, especially given the physiological evidence for transient release discussed above.
Intracellular recordings in intact retina show that light responses of Mb1 bipolar neurons are similar to the depolarizing pulses used here to evoke saturating capacitance responses. A light flash elicits a large, rapid depolarization with amplitudes ranging from 22 to 32 mV positive to the −40 mV resting potential [Saito et al. (1979), their Fig. 3]. This spike-like depolarization repolarizes within ∼200 msec to a less depolarized plateau, the duration of which depends on illumination intensity. The initial spike is comparable to the depolarizations used in our capacitance measurements. Physiological stimuli thus may produce a fast burst of exocytosis in bipolar cell terminals sufficient to fully deplete the readily releasable vesicle pool. This would convert sustained responses in photoreceptors into transient responses in ganglion cells. However, under illumination conditions that produce smaller, more sustained depolarization, capacitance measurements indicate that Mb1 bipolar neurons can sustain release for longer periods (see Fig. 6). Strong stimulation thus favors phasic release, whereas weaker stimulation favors more tonic release.
We suggest that Mb1 bipolar neurons, with their high [Ca2+]i threshold for secretion (Heidelberger et al., 1994; von Gersdorff and Matthews, 1994a), operate like phasic spiking neurons, which typically have large initial synaptic responses that undergo depression after stimulation with trains of action potentials. By contrast, photoreceptors, with their low [Ca2+]i threshold for secretion (Rieke and Schwartz, 1996) and possibly OFF-type bipolar neurons, are thought to operate in a tonic manner, continuously releasing neurotransmitter in the dark. Certain classes of ON-type bipolar neurons with small, varicose synaptic terminals (Saito and Kujiraoka, 1982) also may be tonic secretors, given their graded responses to light. Morphologically distinct classes of bipolar neurons (Euler et al., 1996) thus may channel tonic and phasic information separately to ganglion cells.
Footnotes
This work was supported by National Institutes of Health Grant EY03821, National Research Service Award Fellowship EY06506, and the Alexander von Humboldt Foundation. We thank J. G. G. Borst, A. Marty, R. Miles, and E. Neher for helpful comments.
Correspondence should be addressed to Dr. Gary G. Matthews, Department of Neurobiology and Behavior, State University of New York, Stony Brook, NY 11794-5230.
Dr. von Gersdorff’s present address: Abteilung Membranbiophysik, Max Planck Institut für biophysikalische Chemie, Am Faßberg, 37077 Göttingen, Germany.


