

Abstract
The dominant efferent innervation of the cochlea terminates on outer hair cells (OHCs), with acetylcholine (ACh) being its principal neurotransmitter. OHCs respond with a somatic shape change to alterations in their membrane potential, and this electromotile response is believed to provide mechanical feedback to the basilar membrane. We examine the effects of ACh on electromotile responses in isolated OHCs and attempt to deduce the mechanism of ACh action. Axial electromotile amplitude and cell compliance increase in the presence of the ligand. This response occurs with a significantly greater latency than membrane current and potential changes attributable to ACh and is contemporaneous with Ca2+ release from intracellular stores. It is likely that increased axial compliance largely accounts for the increase in motility. The mechanical responses are probably related to a recently demonstrated slow efferent effect. The implications of the present findings related to commonly assumed efferent behavior in vivo are considered.
- cochlea
- efferent
- acetylcholine
- outer hair cell
- electromotility
- cell stiffness
- calcium
- effects of ACh on outer hair cell
- cochlear amplifier
- microchamber technique
- patch-clamp technique
- dose–response curves
Its first examination showed inhibitory effects during electrical stimulation of the efferent nerve bundle (Galambos, 1956;Wiederhold and Kiang, 1970). Small inhibitory effects have also been seen with contralateral sound stimulation (Buño, 1978; Liberman, 1988). Some efficacy in protecting the ear against overstimulation (Rajan, 1988) and small improvements in the detection of signals in noise (Nieder and Nieder, 1970; Winslow and Sachs, 1987) can also be demonstrated.
The largest effect is obtained with electrical stimulation of medial olivocochlear fibers, which provide the efferent innervation of cochlear outer hair cells (OHCs). Whether measured in the compound response of the afferent nerve trunk (Galambos, 1956), single fibers (Wiederhold, 1970), inner hair cell (IHC) receptor potentials (Brown and Nuttall, 1984), or basilar membrane motion (Dolan and Nuttall, 1994; Murugasu and Russell, 1996a), the ultimate effects are the same. These consist of a reduction of the response at the best frequency (BF) by some 20 dB, no detuning of the BF, and no significant effect on the low-frequency tail of the response pattern. A recent review on efferents is available (Guinan, 1996).
Acetylcholine (ACh) is the principal efferent neurotransmitter in the cochlea (for review, see Eybalin, 1993; Sewell, 1996). ACh receptors (AChRs) on hair cells show unusual pharmacology, which is unlike either nicotinic or muscarinic AChR but has some characteristics of both. A new subunit (α9) of the nicotinic AChR family has been cloned recently (Elgoyhen et al., 1994), which when expressed in oocytes produces functional AChRs and demonstrates pharmacological properties similar to those seen in hair cells.
Because ACh binds to receptors at the synaptic pole of the cell, the response is a rapid influx of Ca2+ through nonspecific cation channels opened by the ligand. This results in the opening of calcium-dependent potassium channels, yielding an increase in the input conductance of the cell and the efflux of K+, which hyperpolarizes the cell by a few millivolts. The currents are activated rapidly, and the potential change reaches a peak in <100 msec (Housley and Ashmore, 1991; Eróstegui et al., 1994; Blanchet et al., 1996;Evans, 1996). Second messenger activation may also occur in OHCs (Shigemoto and Ohmori, 1990, 1991; Kakehata et al., 1993), resulting in a slow effect, distinguished by its long time constant, on the order of 20–50 sec. It seems likely that the slow effect is responsible for the ability of the efferent system to provide some protection against acoustic overstimulation (Reiter and Liberman, 1995). Sridhar et al. (1995) indicated that both slow and fast effects are mediated by the same AChR and both produce inhibition of the cochlear output.
Electrical stimulation of the olivocochlear bundle affects only the medial efferents, and thus the effects are on OHCs (Guinan, 1996). OHCs are in a cochlear feedback loop in which they comprise the effector arm of the “cochlear amplifier” (Dallos, 1992). OHCs are assumed to feed cycle-by-cycle force (electromotile response) to the basilar membrane so that its vibration is amplified at BF. It is generally assumed that efferents reduce the OHC feedback force and thus the gain of the cochlear amplifier.
OHC electromotility is a membrane potential-dependent (Santos-Sacchi and Dilger, 1988) somatic elongation (on hyperpolarization) and contraction (on depolarization) of the cylindrically shaped cell (Brownell et al., 1985; Kachar et al., 1986; Zenner et al., 1986;Ashmore, 1987). As the input conductance of the cell increases, the receptor current-induced voltage drop on the basolateral (motor-bearing) membrane decreases, and the electromotile response is reduced; however, this effect is negligible above the cutoff frequency of the OHC membrane (<1 kHz) (Housley and Ashmore, 1992;Santos-Sacchi, 1992) and is unlikely to modulate cochlear amplification. Furthermore, the voltage-to-length change conversion function (δL-V) of the OHC is nonlinear (Evans et al., 1989, 1991;Santos-Sacchi, 1989). As the membrane is hyperpolarized, the operating point moves toward lower slope (gain) on the δL-V function. The gain change, corresponding to the expected maximal ∼10 mV hyperpolarization is small, approximately 10–20%; however, because the electromechanical conversion process (motility) is in the feedback path of the cochlear amplifier, even modest reduction in the feedback gain could radically reduce the total gain (Yates, 1990). It is then the expectation that ACh should reduceelectromotility, in harmony with the inhibitory influence attributed to cochlear efferents.
Interestingly, ACh invariably produces increased gain and magnitude of the motile response in isolated OHCs (Sziklai and Dallos, 1993; Sziklai et al., 1996). Because the result of increased motility seems incompatible with behavior expected from conductance increase or hyperpolarization and with the generally conceived efferent influence, other factors may be important in the control of electromotility by efferents, and these are examined.
OHC electromotility has been studied with either the whole-cell patch technique (Hamill et al., 1981; Ashmore, 1987) or the microchamber technique (Evans et al., 1989). Our previous findings (Sziklai and Dallos, 1993; Sziklai et al., 1996) were obtained with the latter. Here both techniques are used to assure that the unexpected result of increased motile response in the presence of ACh is indeed real. Simultaneous measurements of OHC length (δL) and radius (δr) changes with ACh are obtained with the microchamber technique. As demonstrated below, the effect of the ligand on the δL/δr ratio is diagnostic regarding the mechanism of ACh action. In the whole-cell patch experiment, we investigate whether the ACh effects persist when the cell is voltage-clamped. To investigate the mechanism of ACh action, we also measure its effect on Ca2+ release from internal stores and on axial stiffness and electromotility when cell length is mechanically constrained. To compare the results with other ACh effects, dose–response curves are also obtained.
Care and use of animals have been approved by the Northwestern University Institutional Review Board and by the National Institutes of Health.
Some of these results have been published previously (Dallos et al., 1996).
MATERIALS AND METHODS
Cell isolation. OHCs were obtained from the cochleae of young albino guinea pigs euthanized with sodium pentobarbital. Appropriate segments of the organ of Corti were isolated from second, third, and fourth turns of the cochlea. After light enzymatic digestion for 15 min (1 mg/ml Type IV Collagenase, Sigma, St. Louis, MO) and gentle pipetting, cells were transferred to small plastic chambers filled with enzyme-free culture medium. The normal medium was Leibovitz’s L-15 (Life Technologies, Gaithersburg, MD), supplemented with 15 mm HEPES or HBSS (Life Technologies) and adjusted to pH 7.35, 300 mOsm.
A Zeiss inverted microscope with 16× objective was used for these experiments. Cell length and diameter changes, or displacement of the driven fiber, were measured by the change in the current of a photodiode when the magnified image of the ciliated pole of the cell, a full diameter, or the edge of fibers was projected onto it through a rectangular slit. The position of the slit in front of the photodiode was adjustable so that the image of the object could always be projected to the photodiode without moving the cell or the fiber. The position of the image in the slit was monitored by a video camera behind it. Two slit-photodiode assemblies were used for simultaneous length and diameter change measurements. Photocurrent response was calibrated to displacement units by moving the slit to a fixed distance in front of the photodiode at the beginning of each trial. The photodiode measurement system, including postfiltering, had a corner frequency (3 dB down) of 1100 Hz. With some averaging, movement amplitudes as low as 10 nm could be detected routinely. In most experiments, 10–20 averages of trials were preset. Experiments were performed at room temperature (20 ± 4°C) and videotaped with a Panasonic video recorder.
Drug application. ACh was delivered by pressure ejection from a micropipette (tip diameter 2–3 μm) positioned ∼20 μm from the synaptic pole of the cell. The duration and strength of the pressure pulse were controlled (Lin et al., 1993). To prevent leakage of drug from the puffer pipette, the pressure line was vented to open air between pressure pulse applications. In some early microchamber experiments, the entire bath was exchanged when drug application was required. In the experiments in which fluorescence was measured, ACh was applied slowly to the bath as a bolus. Care was taken to assure that application of the ligand did not alter the position of the cell and influence measurements of motility or stiffness. Calibration was performed before each experimental run, and thus small positional changes, if any, were compensated for.
Microchamber methods (Fig. 1A). Healthy-appearing isolated OHCs (no obvious signs of hair bundle damage, granularity, swelling, or nucleus translocation) were drawn gently part of the way into a close-fitting glass pipette, the microchamber, with their ciliated pole inside. The microchamber was fabricated from 2 mm thin-wall glass tubing (Glass Company of America) by a two-stage microelectrode puller (Narashige, Tokyo, Japan) and heat-polished to an aperture diameter close to that of a hair cell (∼8–9 μm). The microchamber, with an access resistance of ∼0.4–0.5 MΩ, was mounted in an electrode holder that was held on a three-dimensional (3-D) micromanipulator (Leitz, Wetzlar, Germany). The position and height of the microchamber in the bath were readily adjustable with the micromanipulator. By moving the microchamber, cells in the bath could be picked up easily. The experimental bath, which contained the isolated OHCs, was placed on the stage of an inverted microscope (Zeiss). An Ag/AgCl ground electrode was installed in the bath. The internal medium (L-15) of the microchamber was connected to the voltage command generator through an Ag/AgCl wire inside the microchamber. The suction port of the microchamber holder was connected to a micrometer-driven syringe to provide positive or negative pressure to draw in or expel the cells. The inserted cell and the microchamber formed a resistive seal (4–6 MΩ) that was mechanically stable but allowed the cell to be moved in and out of the pipette without apparent damage to it. Transcellular potentials were applied across the microchamber. Negative voltage commands made the bath negative relative to the inside of the microchamber. This results in the depolarization of the excluded and hyperpolarization of the included cell membrane segments. Voltage command stimuli were generated by a programmable generator in an IBM-compatible computer, which also contained the data acquisition hardware.

A, Video image showing the experimental setup for microchamber measurements. The OHC is inserted into the microchamber with its synaptic pole outside. Fractional cell length outside the chamber is designated with q. The diameter of the cell and its cuticular plate are imaged via rectangular slits on photodiodes. The photocurrents are proportional to diameter and length changes, respectively. Command voltage (Vc) is delivered between electrolytes inside and surrounding the microchamber. ACh is delivered to the synaptic pole of the cell. B, Video image showing the experimental setup for measuring electromotility with the whole-cell patch technique. Cell length changes are measured as inA, and ACh is delivered to the synaptic pole.C, Video image showing the experimental setup for stiffness measurements and for constrained electromotility measurement. A piezo-driven glass fiber is brought up against the synaptic pole of the cell. The cell is inserted into a microchamber with ciliary pole inside and q = 0.8–0.9. ACh is delivered to the synaptic pole, and its displacement is measured as inA.
Voltage-clamp methods (Fig. 1B). OHCs were bathed in HBSS. Their membrane potentials were clamped using the standard whole-cell voltage-clamp technique (Hamill et al., 1981). A detailed procedure for getting tight seals on OHCs has been described elsewhere (Lin et al., 1993). Recording pipettes had access resistance between 4 and 6 MΩ in the bath. Access resistance approximately doubled when whole-cell recording configuration was established. At least 80% of the access resistance was compensated. Capacitance compensation was also applied. The estimated voltage-clamp time constant is probably <1 msec (calculated from the access resistance of the pipette and estimated cell capacitance) (Santos-Sacchi, 1992). In most of our recordings, whole-cell currents were below 2 nA. The estimated voltage-clamp error, therefore, should not be >5 mV. Pipette internal solution contained (in mm): 120 KF (in some early experiments) or 120 KCl (in all later experiments), 2 MgCl2, 10 EGTA 10, 10 HEPES. The solution was buffered to pH 7.4 with Trizma Base (Sigma), and osmolarity was adjusted to 300 mOsm with glucose. Whole-cell currents (filtered at 5 kHz) were amplified using patch-clamp amplifier Axopatch 200A (Axon Instruments, Foster City, CA). The currents and photodiode signals were acquired by software Clampex (pClamp version 6, Axon Instruments) running on an IBM-compatible computer and a 12 bit D/A and A/D converter (Scientific Solutions, Solon, OH). Photodiode signals were low-pass-filtered at 1600 Hz before being fed to the D/A. Data were analyzed using Clampfit of the pClamp software package.
Stiffness measurement (Fig. 1C). Glass fibers were pulled from molten glass (1.5 mm) by a microforge (Stoelting, Chicago, IL). The tapered fiber was 4–6 mm in length and 1–2 μm in tip diameter. We did not measure the actual stiffness of the fiber, but it was desirable that the compliance of the fiber be of the same order as that of the cells. This was ascertained by noting that the compression of the cell and the displacement of the fiber were approximately the same. The glass fiber was attached to an electrical piezo actuator, which was mounted on a 3-D micromanipulator (Narashige). OHCs were inserted ∼20% into the microchamber with their ciliated pole inside, and the glass fiber was brought into contact with the excluded synaptic pole of the cell. The fiber was placed perpendicular to the long axis of the OHC in such a way that the lateral motions of the fiber would compress or relax the cell. Free fiber and cell-loaded fiber motions (fiber-driven cell compression) were measured by focusing the driven pole of the cell through a slit on a photodiode. Data acquisition was performed using an IBM-compatible computer. The probe stimulus was a series of 5 Hz sinusoidal voltage bursts with a duration of 500 msec.
Fluorescence measurements. Isolated OHCs were loaded with an adjusted final concentration of 75 μm chlortetracycline (CTC; Sigma) (Caswell, 1971), which has a strong affinity for membrane-associated Ca2+ (Chandler and Williams, 1978). The cells were exposed to CTC for 20 min. Data obtained using CTC were not converted to the absolute value of intracellular Ca2+concentration in this study. OHCs were transferred from the original bath to the experimental bath via a borosilicate, wide-mouth transfer pipette. Once the OHC was released into the experimental bath, it was allowed to settle on the surface of the chamber, where it adhered. Experiments were performed on an inverted microscope (Leitz). A xenon light source was used to excite the dye at 405 nm, using a standard fluorescein isothiocyanate cube. Readings were taken using a photometer (MPV Compact, Leitz). A rear-projected aperture was imaged over the subcuticular region of the OHC from which recordings were to be taken. On illumination of the preparation, data collection was triggered. To reduce photobleaching, a shutter was opened for 5 sec intervals, at which time a reading was taken. The analog output signal was recorded at a sampling rate of 1 kHz and stored to disk on an IBM 486-PC clone.
In all the experiments, ACh (Sigma) was perfused slowly into the bath without disturbing the position of the plated cells. A 1 mmstock solution was added to the experimental bath to obtain a final solution concentration of 150 μm. The volume of the experimental bath was ∼0.25 ml, and the volume of the chemicals containing culture medium was adjusted to obtain the appropriate concentration. In some experiments, atropine sulfate (MW 676.8; Sigma) was applied to achieve a final concentration of 100 μm.
First, fluorescence of OHCs was measured. Readings were taken to obtain control curves with respect to the extinction of the fluorescence as a function of time. In the second series of experiments, after 1 min of baseline readings, ACh was added to the bath. Readings were taken at intervals for 2 min after addition of the ACh. Finally, in the last set of experiments, atropine was added to the bath. After the atropine was allowed to diffuse through the bath, the same procedure as in series 2 was followed.
EXPERIMENTAL RESULTS
Motile response under current and voltage clamp
It is our experience that immediately after whole-cell recording conditions are established, the zero current potential is low (average, −25 mV; SD = 9.8 mV in 10 cells), but on equilibration with the content of the recording pipette the cell hyperpolarizes to an average value of −55.7 mV (SD = 7.8 mV). Representative results are shown in Figure 2, where voltage clamp data and steady-state current–voltage (I–V) curves are presented for an isolated OHC.

A, Example of membrane potential from a cell clamped to zero membrane current during the delivery of an ACh puff. B, Example of membrane current waveforms from an isolated OHC (cell length L = 60 μm) under voltage clamp. The cell was held at −70 mV, and membrane potential was stepped from −140 mV to +53 mV in 13 mV increments. Eighty-five percent series resistance compensation was applied.Left, Reference responses; middle, after application of 50 μm ACh. Right graph, Steady-state I–V curves derived from the waveforms.
In Figure 2A, the ACh-evoked membrane potential change is shown over time when the net whole-cell current was clamped at 0 nA. The membrane rapidly hyperpolarizes and shows some subsequent repolarization during the persistence of the ligand. Both the control and post-ACh time patterns and I–V curves (Fig.2B) resemble those published by others for OHCs (Housley and Ashmore, 1991; Doi and Ohmori, 1993; Eróstegui et al., 1994; Blanchet et al., 1996; Evans, 1996) and hair cells from nonmammalian vertebrates (turtle: Art et al., 1984, 1985; fish:Steinacker and Rojas, 1988; frog: Housley et al., 1990; bird: Shigemoto and Ohmori, 1991; Fuchs and Murrow, 1992).
Electromotile responses were measured with the whole-cell voltage-clamp method in 14 OHCs. Three examples are presented in Figure 3; an additional example has been published (Dallos et al., 1996, their Fig. 2). Pressure ejection of ACh onto the synaptic pole of the cell produced a significant effect on electromotile response in 10 cases. The other four cells showed very small change in motile response. Figure 3 depicts a sequence of responses to bipolar square-pulse stimuli (top row). In the left-hand column electromotile response waveforms are shown. In the center column these are repeated after ACh application. From the steady-state portion of the response waveforms, δL-V curves are derived and shown in the right-hand graphs. The δL-V curves are Boltzmann functions (Santos-Sacchi, 1989), indicating larger response with saturation in the depolarizing (cell contraction) direction. In two of the examples, the pre-ACh elongation response is virtually nonexistent. The δL-V curves, obtained after focal application of ACh to the synaptic pole of the cell, are significantly affected in that the small-signal gain (slope at holding potential) and the maximum response are both increased. In the three examples presented, the gain increases are from 2.4 to 3.4, 1.8 to 3.7, and 1.2 to 6.4 nm/mV. Because of the application of ACh, the rise time appears to increase for example A and decrease for B and C, whereas the fall times appear to change in the opposite direction. We observed the rise time for nonsaturated motility in 10 cells before and after ACh application. In approximately half the cases the rise time increased; in the other half it decreased. There were no obvious correlations between various measures of motility or cell condition and either initial rise time or change in rise time with ACh application, or with the direction of change of the fall times.

Motility data for three cells stimulated in the whole-cell voltage-clamp mode. Holding potential is at −70 mV, and membrane voltage is stepped between −140 mV and +85 mV in 15 mV step increments (top traces). Cell motility is measured as in Figure 1B. Left column, Pre-Ach control responses; center column, after ACh application. Cell contraction is plotted down. Right column, Steady-state δL-V plots for the control and ACh conditions. Abscissa, membrane potential; ordinate, motile response (nm). Cell lengths: 51, 53, and 45 μm.
Dose–response relations and antagonists
To rule out nonspecific effects on motility attributable to the ligand, we obtained dose–response curves in eight cells. These measurements were made in the microchamber, and the ligand was delivered as in Figure 1A. Delivery was with a puffer pipette, and the pipette was removed, refilled, and replaced between each sequence of measurements for the different doses. Care was taken to position the pipette tip at the same location vis-à-vis the synaptic pole of the cell. Representative data from one cell are shown in Figure 4A. In Figure4B the data points give the mean normalized response (along with 2 SD) for eight cells. The smooth curve is a fit by the following form of the Hill equation: LAch = 100/[1 + (KD/[Ach])n]. Values are KD = 21.3 μm andn = 1.6.

A, Representative motile response waveforms from one cell obtained when different ACh concentrations are applied to the synaptic pole of the cell. Electrical driving signal is a 10 Hz sinusoid. B, Normalized dose–response curve obtained from eight OHCs. Data points are mean values; error bars represent 2 SD. The smooth curve is the Hill equation with half-activating concentration of 21.3 μm and slope of 1.6. C, Normalized antagonizing effect of strychnine on increased motility evoked by 100 μm ACh in six hair cells. Data points are mean values; error bars represent 2 SD. Fifty percent reduction is seen at 0.015 μm.
Sziklai et al. (1996) demonstrated that both atropine andd-tubocurarine antagonized the ACh effect on motility. Here we examine the effect of the most potent antagonist of the α9 AChR, strychnine (Elgoyhen et al., 1994). In Figure 4C we show that co-application of strychnine with 100 μm ACh resulted in a strong, dose-dependent blockade of the ACh effect. Fifty percent reduction in the increase of motile response was achieved with 0.015 μm of the antagonist. In α9 homomers, 50% blockade of the response to 10 μm ACh was obtained at a concentration of 0.02 μm (Elgoyhen et al., 1994). Clearly, the pharmacology of the ACh process, as reflected in OHC motile response, is essentially the same as that seen in other hair cell systems or for the α9 AChR.
Length versus radius change
The electromotile response of OHCs consists of axial (δL) and radial components (δr). As discussed below, joint measurement of two variables (δL and δr) produces revealing information.
It is reasonable to assume that any influence (by ACh) that occurs before the activation of the motility motors is expressed equally in δL and δr. Thus, the constancy of the length-to-radius change ratio, before and after application of the ligand, signifies that all effects occur before motor action, whereas nonconstancy of the ratio indicates effects that happen in or after motor action. This heuristic notion is developed analytically in Theoretical Results. The experimental plan is to measure the δL/δr ratio before and after application of ACh to the synaptic pole of the cell and to examine its constancy or change. In reality, instead of radius change, we measured diameter changes, but the discussion is in terms of δr.
Our results are summarized readily. In no case did we find constancy of δL/δr from the pre-ACh to the post-ACh measurement. In fact, the ratio invariably increased. This change came about by an increase in δL and a decrease in δr. Percentage changes are somewhat dependent on stimulus (voltage) level. Data are based on measurements in which the pre-ACh axial motile response (δL) was ∼200–400 nm. The actual voltage dependence was not explored. Motility waveforms of δL and δr were published previously for the pre- and post-ACh situations (Dallos et al., 1996, their Fig. 1). In Figure 5 data are summarized for 10 OHCs. Percentage diameter change [100(δrAch − δr)/δr] is plotted against percentage length [100(δLAch − δL)/δL] change. Would-be proportionality is represented by the dotted line. It is evident that all length changes are positive, whereas all diameter changes are negative. If the cells were not mechanically partitioned by the microchamber, the lack of proportionality would imply a volume change. For the partitioned cells this is not the case.

Simultaneously measured change in cell length and diameter for 10 OHCs. Reference condition is pre-ACh; experimental condition is after application of 30 μm ACh.Dotted line represents theoretical condition of equal percentage of length and diameter change. Experimental arrangement is as in Figure 1A.
Effect of calcium
Removal of Ca2+ from the medium that surrounds the synaptic pole of the cell completely inhibits the ACh effect. This is demonstrated in Figure 6. The top trace gives axial motile response to square-pulse electrical stimulus in normal medium. The middle trace depicts the response when the medium is calcium-free and contains 30 μm ACh. This response is identical to the first: lack of calcium has no effect on electromotility, but it blocks the effects of ACh. This is apparent from the bottom trace, which depicts the response in normal medium in the presence of ACh. Clearly, response magnitude is increased roughly twofold relative to the first two conditions.

Example of square-pulse electrical stimulation (top trace: stimulus waveform,Vc = ±50 mV) of an isolated OHC in the microchamber, as in Figure 1A. Cell exclusion,q = 0.2; here the displacement of the included, ciliated pole is measured. Total pulse duration: 60 msec. Cell contraction is plotted down. Second trace, Control response in normal medium. Third trace, Response in the presence of 30 μm ACh in Ca2+-free medium (containing 5 mm EGTA). Bottom trace, Response in normal medium in the presence of 30 μmACh.
The square-pulse responses shown in Figure 6 present an opportunity to examine the effect of ACh on the transient motile response versus time-dependent response components. As described previously (Hallworth et al., 1993), the square-pulse response in the microchamber is stereotyped and largely reflects the electrical behavior of the cell in the microchamber, which is a lead–lag network. The response consists of an initial rapid transient followed by an exponential transition toward steady-state. It is apparent from Figure 6 and from previously published data (Sziklai et al., 1996) that both transient and slow components are affected by ACh. Moreover, as a first approximation, one may state that both components change by a similar percentage. As discussed in Theoretical Results, such findings imply strongly that cellular mechanics is controlled by a particular configuration of stiffness and damping elements.
Time course of responses
To assess whether the motility changes seen here are attributable to the ionotropic or metabotropic action of ACh, we endeavored to compare the time courses of different events. Figure7A represents an overview of findings. The top trace serves as time calibration. Here the substance-delivery pipette was brought to a distance of 20 μm from the synaptic pole of the cell, and 130 mm KCl was pressure-ejected from it. The OHC was current-clamped, and the zero-current membrane potential was monitored. Time course of depolarization represents the speed of delivery of the substance ejected from the pipette. In six trials, using different cells, we found that the mean time value to peak depolarization is 147.5 msec (SD = 28.1 msec). The center traces give three examples of the time courses seen in experiments in which the OHCs were current-clamped to 0 nA and the membrane potential was monitored after ACh delivery. The mean response time, measured to the peak of membrane hyperpolarization and adjusted for ligand delivery time, was 213 msec (SD = 127 msec) for 10 cells. This is similar to that discernible in the data of Blanchet et al. (1996) and Evans (1996) for ACh-induced peak outward current.

A, Results of whole-cell patch recordings. Top trace is calibration of the time course of ligand delivery. Depolarization of cell on pressure ejection of 130 mm KCl from the delivery pipette (20 mV vertical scale bar). The next three traces show time course of membrane hyperpolarization from the indicated zero current potential (membrane potential) for three OHCs in response to 50 μm ACh (2 mV vertical scale bar). B, Results of microchamber experiments. Continuous electrical stimulation of the cell with 100 Hz sinusoidal voltage elicited sinusoidal electromotile response. Peak-to-peak amplitude of this response was measured in consecutive 100 msec intervals and plotted as individual data points for three cells.Dotted horizontal line is the average pre-ACh motility amplitude. ACh (50 μm) delivery starts at time 0. Note logarithmic time scales.
In Figure 7B the time course of motility change is shown for three cells. Here a 100 Hz continuous sinusoidal command voltage was delivered to the microchamber, and the ensuing motile response was monitored before, during, and after ACh delivery. Peak-to-peak responses were averaged off-line from consecutive 100 msec segments of the time record. Data points represent these averages. It is apparent from the figure that the first appearance of a change in motility (increase) occurred ∼6–7 sec after the start of the ACh puff. Time constants ranged from 12 to 30 sec. It is unclear whether the decreased motility seen in the response of one cell, beginning at 250 msec, is a result of the hyperpolarization of the cell or simply of variability. The prominent increase in motility, however, occurs after a significant latency of the order of 10 sec. These results suggest that the increased electromotile response (Sziklai et al., 1996) needs to be classified as a “slow” effect (Sridhar et al., 1995), most likely mediated by metabotropic action of the AChR.
Calcium release from internal stores
In these experiments, the brightest fluorescent signal was observed consistently in the infranuclear region and the subcuticular region, as well as in some subcellular structures, presumably mitochondria. Similar to the findings of Ikeda and Takasaka (1993), the central portion of the cytoplasm, nucleus, and cuticular plate were devoid of detectable fluorescence. The fluorescent regions are those in which Ca2+ is membrane-bound. Fluorescence measurements were taken from the cross-section of the cell below the cuticular plate.
As with most fluorochromes, the fluorescent signal strength decreases over time because of factors such as photobleaching and leakage. Therefore, control curves were measured that indicated that the decrease in fluorescence over time was approximately linear. Data representing mean + 2 SD from seven control experiments are indicated in Figure 8 by the filled circles and error bars. To reduce the decay in fluorescence, the light source was activated only when readings were to be taken from the OHC. Normalized plots of the change in fluorescence after application of ACh are seen in Figure 8 for five cells. On the addition of ACh, at time 0, a significant decrease in fluorescence was measured. The decline was steep in the beginning, and then the slope began to asymptote to a value measured before the addition of the ligand (linear decay). In the pre-ACh portion of the curves, the data best conform to a linear fit, and the slopes in this region are the same as those of control curves. On addition of ACh, however, there is a clear deviation from linearity in all cases; the post-ACh portion of the curves can be fit with exponentials having an average time constant of 42 sec. Application of 100 μmatropine essentially arrested the influence of ACh (data from three experiments are indistinguishable from control curves and hence are not shown). Atropine was added before the application of ACh to block AChRs.

Five examples of decreased fluorescence on gradual application of 150 μm ACh to the bath, starting at time 0. Fluorescence values are normalized to that measured at time 0.Heavy data points represent mean control values (no ACh) for seven cells to indicate the background decline of fluorescence, presumably attributable to photobleaching. Error bars represent 2 SD. Note that pre-ACh experimental and control results are similar.
Time-dependent volume changes
A great deal of attention had been paid to the influence on electromotile responses of cell turgor changes brought about by alterations of osmolarity (Brownell and Shehata, 1990; Chertoff and Brownell, 1994; Kakehata and Santos-Sacchi, 1995). Increased electromotile response has also been demonstrated in the case in which increased turgor was produced as a consequence of the activation of purinergic receptors (Housley et al., 1995). Consequently, we endeavored to assess cell volume changes after the application of ACh. This was achieved by monitoring cell length and diameter over time from videotaped images of OHCs. Measurements over periods of ∼6 min were made on 10 cells. Static volume change (shortening and diameter increase) was seen in eight cells. In every case, volume changes were <15%. More importantly, in no case did such detectable volume changes occur in <2 min, long after motility changes were fully developed. An example is given in Figure 9, where simultaneously recorded change in motile response and cell volume is shown.
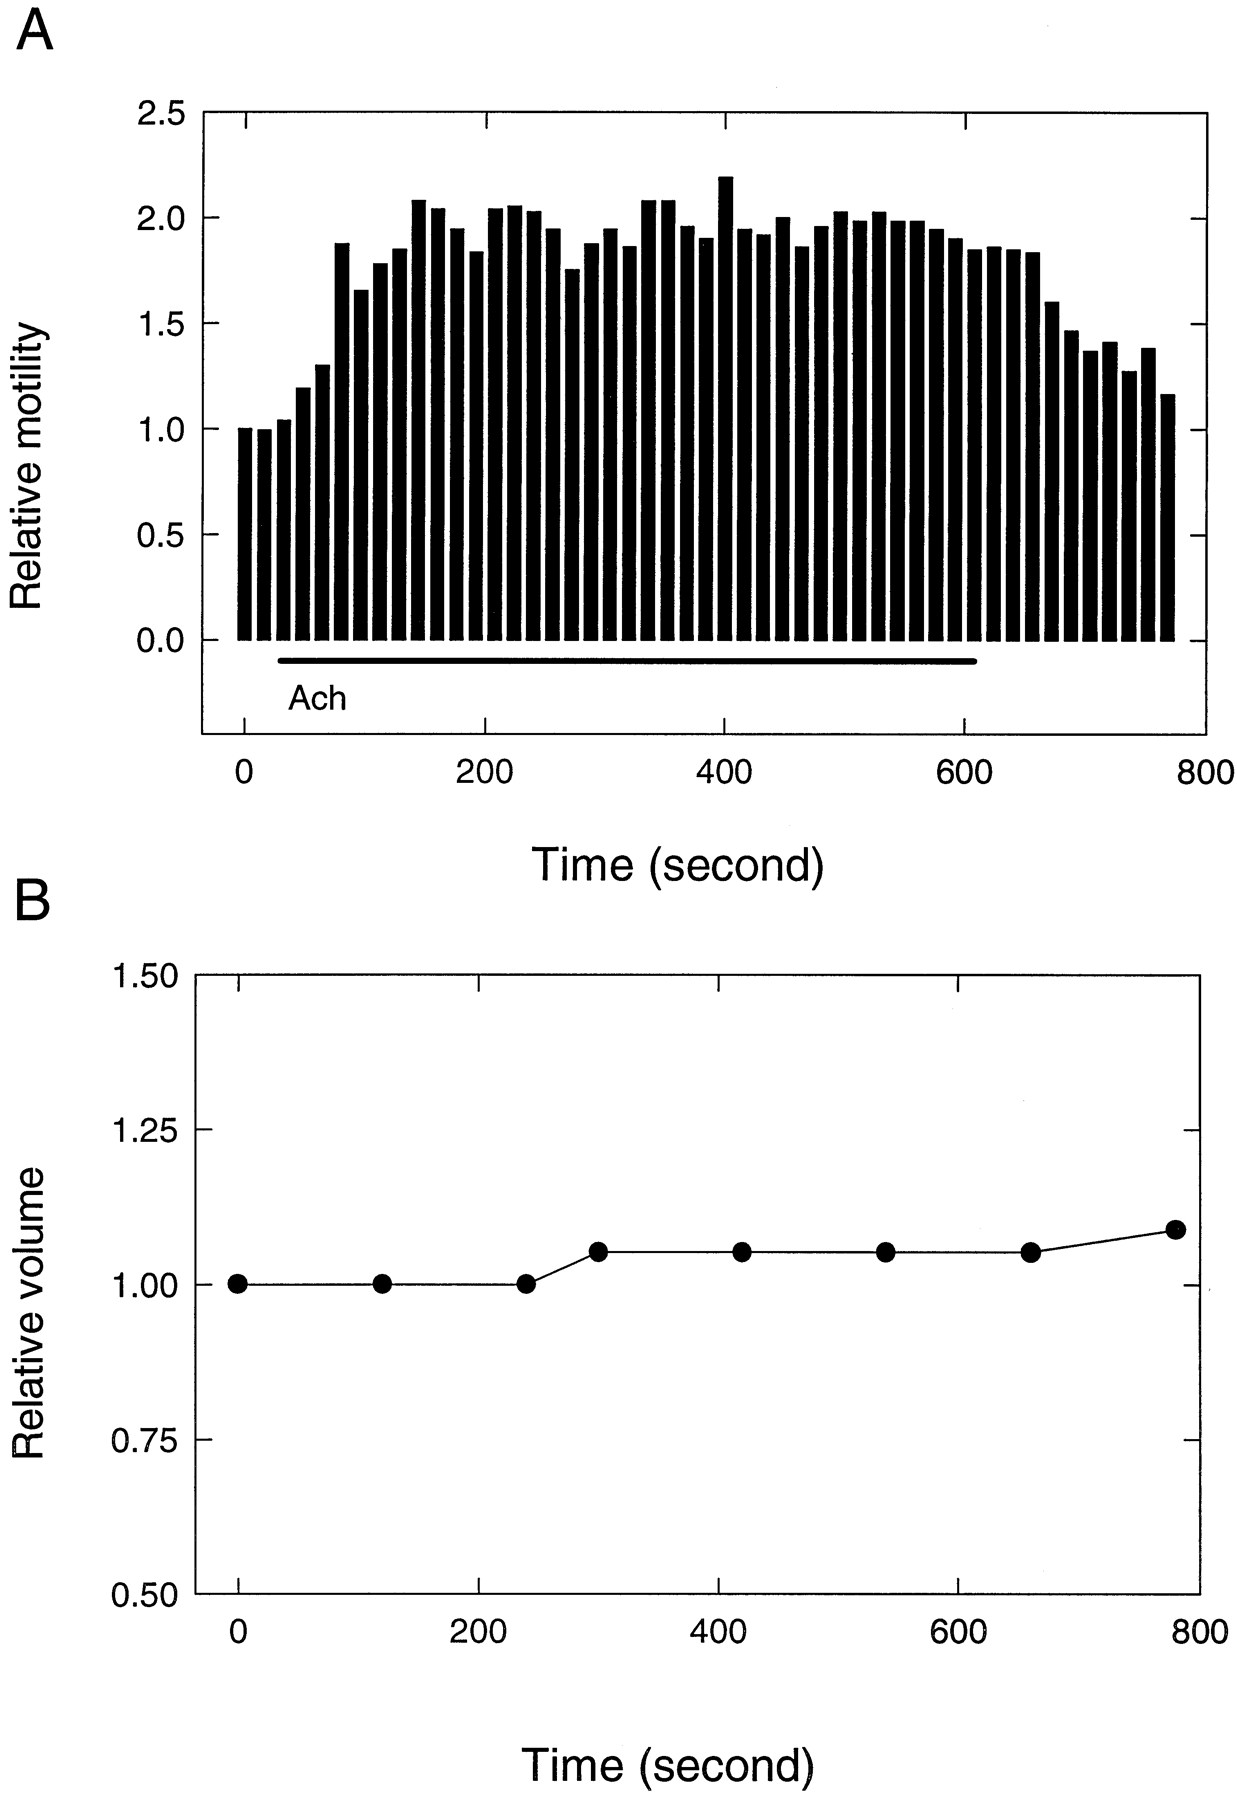
A, Motile response measured in the microchamber over time before and during the delivery of 50 μm ACh. Bars represent response magnitudes averaged over 16 sec periods with 300 msec long, 50 Hz sinusoidal electrical stimuli having a repetition rate of 3/sec. Cell length is 61 μm, q = 0.8. B, Simultaneous volume change measured off-line from the videotaped image of the cell.
The first detectable change in motility amplitude occurs at ∼30 sec after ACh delivery (the plot has 15 sec resolution), whereas the first detectable volume change is seen in excess of 3 min. The dead time for volume changes induced by hypotonic challenge was 210 sec in the data of Ratnanather et al. (1996), and a time constant of 480 sec may be obtained from their plots. In contrast to these results, activation of purinergic receptors produced cell swelling within seconds (Housley et al., 1995). We conclude that it is unlikely that gross turgor changes (manifested in significant volume changes) could be responsible for the effects described here. Although one cannot rule out subtle volume and turgor increases, the finding of ACh-related axial stiffness decrease does not seem to tally with such a possibility. An undetectable decrease in turgor would be expected to produce some decrease in electromotility (Brownell et al., 1989; Shehata et al., 1991). Also, at depolarized membrane potentials, as in our intact OHCs, decreased turgor reduces the gain of motility (Kakehata and Santos-Sacchi, 1995). We conclude that turgor changes, gross or subtle, do not seem to be the mechanism that produces ACh-induced motility changes. Thus, it seems that the two ligands, ACh (Sziklai and Dallos, 1993) and ATP (Housley et al., 1995), affect motility through different mechanisms.
Constrained motility and axial stiffness
In Figure 10, the results of an experiment are shown in which the effects of ACh on the axial stiffness of the cell and its loaded axial motility are studied. Similar experiments, in which complete data sets were obtained in a given cell, were performed on seven cells. Furthermore, stiffness changes attributable to ACh were monitored in 14 additional cells, whereas changes in loaded electromotile response were measured in eight cells. The cells were inserted into the microchamber with their ciliated poles first, so that ∼80–90% was outside the chamber. A piezo-driven glass fiber was brought up against the synaptic pole (Fig. 1C). Unloaded and loaded fiber motion and unloaded and loaded motility were measured with and without ACh in the bath. The top single trace is the motion of the fiber when it does not contact the cell. The left three traces are control, and the right three traces are corresponding responses in the presence of 50 μm ACh. In this example we first note that on pushing the fiber against the cell, its amplitude decreased to ∼40% (Fig. 10, bottom left vs top single trace). Consequently, in this case the stiffness of the fiber is ∼66% of that of the cell. Without the mechanical load by the fiber, electromotile amplitude increased ∼100% when ACh was applied (Fig.10, second row). The corresponding change in the loaded condition is 62% (Fig. 10, third row). In the fourth row of the figure the axial motion of the cell is shown as driven by the fiber. Here the cell is not stimulated electrically. On application of ACh the amplitude increased by 62% (the mean change is 69.4%; SD = 20.5% in 7 cells). This implies that the stiffness of the cell decreased because of ACh to ∼36% of its original value. A quantitative comparison of ACh results, as manifested in changed electromotile amplitude and stiffness, provides a consistency check on the model of ACh effect. This is considered in the Discussion.

Experiment as in Figure 1C.Top trace is displacement of free fiber driven by a piezoelectric actuator. Second trace, Electromotile response of the cell without the fiber loading it. Third trace, As above but with the fiber attached to the cell.Fourth trace, Loaded fiber motion driven by the piezoelectric actuator. Left column gives control conditions; right column provides corresponding data after application of 50 μm ACh. Cell length is 60 μm.
THEORETICAL RESULTS
Length versus radius changes
The electromotile response of OHCs consists of a prominent axial component (δL, shortening and elongation) accompanied by a much smaller radial component (δr, expansion and contraction) (Ashmore, 1987; Hallworth et al., 1993). In a whole-cell stimulation mode the axial and radial components are antiphasic, as the cell maintains constant volume. In the microchamber configuration (Dallos et al., 1993; Hallworth et al., 1993), length (δLi and δLo) and radius changes (δri and δro) are antiphasic for both respective partitioned cell segments (inside, i, and outside, o, of the microchamber), with the cell in toto, maintaining constant volume. In this configuration any one variable, δLi for example, does not constrain its covariant (δri), because compensatory movements can occur in the other partitioned cell segment (δLo and δro). Consequently, joint measurement of two variables can produce revealing information.
In previous publications we proposed a simple model for fast electromotility of OHCs, as expressed in microchamber measurements (Dallos et al., 1991, 1993). The model is based on the notion that motility is powered by the concerted action of a large number of voltage-sensing protein molecules associated with the cell membrane. It was assumed that the motor is anisotropic in that its displacement in the axial direction [δa = Φ(δV)cosγ] is different from that in the circumferential direction [δc = Φ(δV)sinγ]. Φ(δV) is the displacement of the motor along its hypothetical principal direction γ, where the angle may be defined from the anisotropy of the displacement as cotγ = δa/δc. The motor displacement is a stochastic function of the change in membrane potential δV, expressed as a first-order Boltzmann relationship:
 Equation 1where a and b are constants and do is the elementary displacement of the motor in the γ direction. Here a somewhat simplified version of the model is used to interpret new observations. In this initial discussion damping is ignored, because we attempt to fit the model to very low frequency phenomena.
Let us denote the length of the segment of the cell whose motility was monitored in these experiments as L, the global longitudinal stiffness as Ka, and the elementary axial stiffness (connecting individual motor elements) aska. If the linear density of molecular motors isNa in the axial and Nc in the circumferential dimensions, the number of motors summing their axial displacements is LNa (Fig.11A). The treatment ignores the mechanical partitioning of the cell by the microchamber, a practice valid for either small or large exclusion index, as in Figures 5 and 6. Here the excluded synaptic portion is devoid of motility motors (Dallos et al., 1991) and does not influence the displacement of the other, included, segment. If the voltage drop on the cell membrane is δV, assumed to be the same across all motors, then for the linear case the displacement of the cell segment (δL) can be approximated as follows:
 Equation 2where r is the radius of the cell. The above can be understood by considering that the sum of motor displacements isLNaΦ(δV)cosγ, the total elementary stiffness, which is in series with the motors is 2πrkaNc/LNa, whereas the global stiffness parallel with the motors and elementary stiffnesses is Ka. One may similarly express the radius change (δr) as:
 Equation 3where kc is the elementary stiffness andKc is the global stiffness in the circumferential direction. The total circumferential length change is 2πrNcΦ(δV)sinγ, and the sum of elementary circumferential stiffnesses isLkcNa/2πrNc. The ratio of length and radius changes is:
 Equation 4In line with our heuristic argument, the ratio δL/δr is independent of the actual motor displacement function Φ(δV) and of the voltage drop on the basolateral membrane of the cell, δV, at least in this linear treatment. Moreover, the δL/δr ratio is independent of parameters a, b, and do in Equation 1. The voltage drop on the monitored cell segment is determined by the reactive voltage divider formed by the included and excluded cell membranes. ACh-gated channel openings would modulate the resistance of the synaptic pole (Ashmore, 1992), and motor action is thought to modulate the capacitance of both cell segments (Ashmore, 1989; Santos-Sacchi, 1991). None of these electrical changes matter: the δL/δr ratio is independent of them. We conclude that changes in the length-to-radius change ratio cannot be mediated by direct electrical influences (i.e., impedance changes).

A, Mechanical equivalent circuit of the nonpartitioned cell. B, Mechanical equivalent circuit of cell partitioned in the microchamber. Cell membrane is attached at the orifice of the microchamber. Symbols: Φa, Displacement of elementary motor in the axial direction; ka, elementary stiffness;da, elementary damping;Ka, global stiffness;Da, global damping;Na and Nc, linear packing density of motors in axial and circumferential directions;L and r = cell length and radius.
Expressed in terms of the elementary (ka) and global (Ka) axial stiffnesses, the total longitudinal stiffness of the measured portion of cell is:
 Equation 5The above ignores the mechanical partitioning of the cell by the microchamber, which is permissible for the almost fully extruded cells in our stiffness measurement experiments. Results indicate that δL/δr and δL increase, δr decreases, andKL decreases when ACh is applied. These conditions can be fulfilled jointly ifKa/ka decreases and γ decreases, or if Kc /kcincreases along with a decrease of γ. The constraint onKL (Eq. 5) shows immediately that it is necessary for Ka to decrease. If the number of motors engaged in axial versus circumferential directions would change, i.e., Nc/Na were altered, then Equation 5 would require a decrease in the ratio, whereas Equations 2 and 3 would not be affected significantly. Thus the large changes in motile response attributable to the application of ACh may be obtained by a decrease in γ, coupled with a change in anisotropy. The latter implies lessening of the axial stiffness of the cell with the possible concomitant increase in circumferential stiffness and a possible change in the ratio of effective motor densities,Nc/Na. The latter could come about through a differential change in coupling between motors and the cortical lattice. As we show below, the dominant effect seems to be a decrease in Ka.
Interaction of cell stiffness and damping
The above argument assumed that damping of OHCs is insignificant and that the cell can be modeled as a pure compliance. We now briefly consider how damping would influence response dynamics.
Consider the equivalent mechanical circuit of a nonpartitioned cell (Fig. 11A). The aggregate of motors is in series with the aggregate of elementary stiffness elements (ka) and is parallel with the aggregate of elementary damping elements (da). This complex works against a load comprising the global stiffness (Ka) and damping (Da) of the cell. Assuming that da = 0 (the justification for this is developed below), the input stiffness of the cell is expressed by Equation 5. The motile response may be computed from the following transfer function for the linear case:
 Equation 6This system has a single time constant:
 Equation 7The combination of Equations 5 and 7 yields a simple relation between τ, Da, andKL:
 Equation 8We did not make absolute stiffness measurements; however, these are available from the literature. Hallworth (1995) recently summarized various measurements of the axial stiffness of the OHCs (KL). Although different experimenters obtain a rather broad range of values, KL = 10−3 N/m is representative. With the assumption that motor density is the same in axial and circumferential directions (Na = Nc), all constants are now estimated except Ka,ka, and Da. The first two, however are related via Equation 5. Taking an approximate resting value of Ka = 2 10−4 N/m andka = 1.5 10−3 N/m, the appropriate axial stiffness obtains for a 60 μm long cell. The determination ofDa is postponed until we consider responses for partitioned cells. Then, if ka andDa are assumed to be constant, one can examine the influence of Ka on the nature of the step-response of δL, as we do below.
It is of interest to consider transient and steady-state responses inpartitioned cells. Sziklai et al. (1996) showed that both steady-state and initial transients change after application of ACh. When the cell is inserted into the microchamber with its synaptic pole outside, so that only the infranuclear region extrudes, then the outside segment does not possess motility motors (Dallos et al., 1991;Huang and Santos-Sacchi, 1993). Thus, although there is no active mechanical input contributed by the outside segment, it does function as an added mechanical load. One may derive a transfer function based on Figure 11B for the displacement of the cell segment inside the microchamber, using the exclusion coefficientq (Fig. 1A).
 Equation 9

 This transfer function posesses one zero and two real poles. The step response derived from it does not have an instantaneous transient step component, in contrast to all available microchamber data (Fig.6). If the elementary damping is neglected (da = 0), the transfer function reduces to that shown in Equation 10:
 Equation 10
 When the cell is partitioned mechanically by the microchamber, the two cell segments both possess arrays of elementary stiffness and damping elements, assumed to be associated with the elementary molecular motors. The two cell segments are also connected by some global internal stiffness and damping (Fig. 11B). If the elementary damping is negligible, analysis of the equivalent mechanical circuit reveals that the frequency response of either cell segment is all-pass (Eq. 10). This mirrors the all-pass (lag–lead network) nature of the electrical partitioning of the cell membrane in the microchamber. Previously we assumed that the frequency response of electromotility measured in the microchamber could be completely accounted for by the electrical properties of the cell membrane and that the mechanical properties of the cell were unlikely to influence the response (Dallos and Evans, 1995). In fact, the microchamber configuration yields both electrical and mechanical partitioning, and measurements reflect this combined all-pass nature. Thus we obtained zero-slope high-frequency asymptote in the frequency response function up to 24 kHz (Dallos and Evans, 1995). The step response obtained from Equation 10, reflecting this all-pass characteristic, possesses an initial instantaneous transient rise, followed by an exponential transition to steady-state, as demonstrated by all of our microchamber data.
Equation 10 can provide one additional useful result. For a fully inserted cell (q = 0), the equation reduces to a form identical to that derived for the patched whole cell (Eq. 6). The function has a single pole; hence its step response is a single exponential. This result reflects the fact that for a fully inserted cell there is no longer mechanical partitioning; however, in the microchamber there is still electrical partitioning (Dallos and Evans, 1995). In Equation 6 this means that the voltage drop across the motor-bearing membrane (δV) has all-pass properties. It is then possible to determine the time constant of the mechanical system (Eq. 7) from step responses obtained in the microchamber at q = 0. We examined a sample of nine onset responses obtained with an A/D sampling rate of 1 MHz and a D/A sampling rate of 100 kHz and found that the average τ is 48.8 μsec (SD = 14.6 μsec). Using KL = 10−3 N/m, Equation 8 yields Da = 5 10−8 N sec/m.
Analysis suggests that there are two ways to achieve joint changes seen in both the initial rise (the transient response) and the steady-state plateau attributable to ACh. As we have shown before (Sziklai et al., 1996), in a partitioned cell, both response components change (also see Fig. 6). The experimental results can be duplicated if the global damping is small and global stiffness decreases are caused by ACh. Alternatively, the results also obtain if global stiffness and damping are both decreased because of ACh. The possibility of elementary stiffness increase, also yielding response changes in the right direction, can be ruled out because it would also increase the longitudinal stiffness of the cell, contrary to results (Fig. 10). Using values derived above, ka = 1.5 10−3 N/m, Da = 5 10−8N sec/m, along with q = 0.2, L = 60 μm, r = 5 μm, Na =Nc = 80/μm, γ = 15°, one can examine the effect of varying Ka on transient and steady-state responses. Simulation reveals that both of these components increase approximately the same amount, with a decrease in global stiffness, Ka, which is similar to experimental evidence (Sziklai et al., 1996). It is then concluded that changes in Ka attributable to ACh are sufficient to account for the behavior of step responses.
Are the measured stiffness changes sufficient to explain low-frequency changes in electromotility? In other words, does a given measured change in Ka provide quantitative agreement with the change in δL, via Equation 2? This question can be answered by returning to the data shown in Figure 10. Indicate the ratio of amplitudes of driven fiber motion loaded by the cell to free fiber motion as A1. Then
 Equation 11where Kfiber is the stiffness of the driving fiber and Kcell is the axial stiffness of the cell (KL in Eq. 5). Denote the ratio of cell deflection driven by the fiber in the presence and in the absence of ACh as A2. Then one can compute the following relationship:
 Equation 12Next, one measures the ratio of electromotile responses under fiber load in the presence of and without ACh asA3. Then with the assumption that elementary stiffness does not change (see above) and that global stiffness change is solely responsible for the change in axial motility, one can express:

 Equation 13This is a powerful prediction, which seems to be fulfilled. From Figure 10 one measures A1 = 0.4,A2 = 1.6, and A3 = 1.6. From similar data obtained in four cells, we compute the averageA2 as 1.52 and the averageA3 as 1.54.
Finally, one more internal check is available. IfA4 is the ratio of unloaded motility with and without ACh, then, again assuming that only the global cell stiffness changes:
 Equation 14The right-hand side of the equation is already available from Equation 12 and yields a value of 2.5. The measuredA4 is 2.2, giving acceptable agreement. It is concluded that the global axial stiffness decrease attributable to ACh can account for the low-frequency change in electromotile response.
DISCUSSION
Mechanism of the ACh effect
Figure 2 shows that I–V curves obtained by us, with or without ACh, are similar to those of others (Housley and Ashmore, 1991; Eróstegui et al., 1994; Blanchet et al., 1996;Evans, 1996). The effect of ACh is to increase conductance and hyperpolarize the cell. Intact cells are generally depolarized, as ascertained from the initial zero-current membrane potential; however, all mechanical effects discussed below are similar in intact (low membrane potential) and patch-clamped cells held at normal membrane potential (−70 mV) (Dallos et al., 1982). The principal effect on electromotility is a significant increase in small-signal gain and an increase in response magnitude. Magnitude increase occurs at all input voltage levels, even if the pre-ACh motile response is saturated. All effects are eliminated if the bathing medium is free of calcium.
Nonspecific effects of the ligand can be ruled out by the demonstration of a well defined dose–response relation (Fig.4A,B), showing half-activation concentration and Hill coefficient similar to those found by others using ACh-activated membrane current as an index. Thus our values areKD = 21.3 μm and n= 1.6. For comparison, in various hair cell preparations Housley and Ashmore (1991) obtained KD = 13.5 μm, n = 1.9; Shigemoto and Ohmori (1991), 19 μm, n = 1.6; and McNiven et al. (1996), 22 μm, n = 1.7. The corresponding values for the α9 AChR are 10 μm, n = 1.3 (Elgoyhen et al., 1994). Also, strychnine, a potent antagonist of the hair cell AChR (Eybalin, 1993) and the α9 receptor (Elgoyhen, 1994), produced effects similar to those shown by others (Fig.4C). One concludes that the increased electromotile response is mediated by the well studied hair cell AChR.
Ligand-produced conductance change of the synaptic membrane alters the voltage drop on the motor-bearing cell membrane. In a previous publication (Sziklai et al., 1996), theoretical δL-V curves were presented, showing the effect of a change in conductance and hence in driving voltage. Assuming that cellular mechanics is linear and that response saturation is attributable to the stochastic nature of the motor (Dallos et al., 1993) (Eq. 1), a change in driving voltage cannot alter the saturation levels of steady-state functions but can only contract and expand them horizontally: the gain changes but the maximum response does not. This is contrary to all data presented, which show that not only the gain but the maximum (saturated) response increases because of ACh. Consequently, the change in electromotile response does not occur because of a conductance change. The same argument applies to the possibility that ACh influences the gain of the motor molecule (a in Eq. 1). Assuming that Equation 1 is a correct model for the motor, a change in gain (a) cannot influence the saturated response magnitude. It was also shown that a change in membrane resistance does not affect the transient response, because the high-frequency content transient input voltage is divided on the capacitive voltage divider formed by included and excluded cell membranes in the microchamber. Changes in transient responses attributable to ACh are prominent (Fig. 6) (Sziklai et al., 1996), and once again we conclude that they cannot be mediated by membrane conductance changes. The presence of both transient and steady-state changes with ACh, in the context of the theoretical considerations presented above, also suggests that there is essentially no damping in the connection between adjacent motor elements and that the total internal damping of the cell is small. Conversely, there is probably elastic coupling between adjacent motor molecules, and in addition the aggregate of motors works against some global internal stiffness (plus small damping) of the cell. It is principally the global stiffness (Ka) that seems to be controlled by the efferent neurotransmitter.
Both fast (rapid changes in membrane current and membrane potential) and slow ACh effects (motility and stiffness changes) can be elicited in OHCs, regardless of their length (or as a rough correlation, cochlear position of origin). Although ACh effects on motility are greater for shorter (more basal) OHCs (Sziklai et al., 1996), all cells show similar qualitative results. This is in contrast to in vivo experiments, which indicate that slow effects are greatest for ∼14 kHz (Sridhar et al., 1995). Our results suggest that the basic cellular mechanism that produces the slow effect is present in all OHCs.
The arguments presented above suggest that the principal cause of increased electromotile response is a decreased global axial stiffness of the OHC. In other words, the aggregate of molecular motors that drive motility works against a smaller load in the presence of ACh and thereby produces larger cell excursion for a given electrical stimulus. The precursor events to these stiffness changes are largely clarified (Art et al., 1985; Housley and Ashmore, 1991; Fuchs and Murrow, 1992;Eróstegui et al., 1994; Blanchet et al., 1996, Evans, 1996;McNiven et al., 1996). The immediate cause of the stiffness decrease, however, is as yet obscure.
Activation of the AChR produces a sequence of transient Ca2+ influx and subsequent K+ efflux. The latter hyperpolarizes the cell membrane. These initial events are the straightforward manifestations of the ionotropic receptor process of the AChR. The OHC AChR shows unusual α9-type pharmacology (Elgoyhen et al., 1994), and the initial events have further, delayed consequences. Whether AChR acts via G-protein-coupled second messenger cascade (Kakehata et al., 1993) or uses calcium as a second messenger directly (Sridhar et al., 1995; Murugasu and Russell, 1996b), it is almost certain that one step in the metabotropic action of the AChR is the release of calcium from internal stores. Our demonstration of calcium release from internal stores, with a time course similar to “slow” efferent effects, suggests the possibility that the global stiffness decrease is somehow tied to either decreased sequestered Ca2+ levels in the cisternal region or to an increased level of cytosolic calcium. A possible target is the largely axial spectrin links between adjacent circumferential actin filaments in the cortical lattice (for summary, see Holley, 1996). A possible mechanism is protein phosphorylation (Sziklai et al., 1997).
Implications for in vivo efferent action
Finally, let us consider that an increased motile response attributable to the action of the neurotransmitter ACh seems to be contrary to available data on the influence of the medial efferent system on cochlear response, which is inhibitory. Moreover, it is the consensus that efferent inhibition occurs by the reduction in the gain of the cochlear amplifier (Kim, 1986; Guinan, 1996). A majority assume that somatic length change of OHCs (producing “negative damping,” Neely and Kim, 1983) is the effective feedback variable. The alternative view is that basilar membrane reactance (stiffness) changes can account for cochlear amplification (Allen, 1990; Kolston et al., 1990). Both the classical fast and newly described slow efferent effects (Sridhar et al., 1995) are inhibitory, and both have been assumed to result from electrical conductance changes in OHCs. Although our data do not examine fast effects, it is clear that the slow effects might be interpreted differently: they could be attributable to OHC stiffness change. Yet, assuming that stiffness change of the basilar membrane–organ of Corti system underlies cochlear amplification to produce increased basilar membrane vibration, local stiffness needs to decrease. It is hazardous to extrapolate from changes in isolated cells to the complex organ of Corti–basilar membrane feedback system, and the results could be counter-intuitive. Nevertheless, one might assume that both increased motility amplitude and decreased stiffness would increase basilar membrane vibration. We seem to have a fundamental contradiction between the effects produced by the efferent neurotransmitter ACh on isolated OHCs and its alleged influence in vivo. To examine this contradiction profitably, let us examine what is commonly meant by “efferent inhibition.”
Electrical stimulation of the olivocochlear bundle (Guinan, 1996) produces inhibition via both the fast and slow mechanisms. Electrical stimulation is likely to excite most myelinated medial efferent fibers. Thus virtually the entire efferent system is activated, producing a family of effects in most OHCs. This implies that with the “standard” means of activating the efferents, the well known inhibition arises from a nonselective mass influence by most OHCs. It is commonly assumed that cochlear amplification arises from energy delivered to the basilar membrane from a group of OHCs that are somewhat basal to the location corresponding to the stimulus frequency (Neely and Kim, 1983). Shock-activated efferent influence on OHCs is presumably similar at both locations—indeed, at all locations. The integrated effect of these spatially similar efferent inputs is a preferential reduction of response at the BF place. The experiment ofMurugasu and Russell (1996b) demonstrated reduction in basilar membrane motion at BF on perfusion of scala tympani with ACh and also showed clearly that the integrated influence of the ligand on a wide array of OHCs produces the inhibition at BF. Considering the time course of changes seen by Murugasu and Russell (1996b), theirs is obviously a slow effect. It is not readily apparent how the integration occurs, and the matter has not been examined in the literature. Whether the individual unit (OHC) is inhibited, which is the general notion, or facilitated, which is suggested by the present data, has yet to be proven. It is not obvious whether facilitation or inhibition may be more effective.
Another presumed means of activating the efferent system is with contralateral sound input (Buño, 1978; Liberman, 1988). It is observed that contralateral sounds, with frequency content similar to the ipsilateral target sound, can produce small attenuation of the response to the latter. This attenuation is probably the result of sound-evoked activity (Fex, 1962) in medial olivocochlear fibers. These fibers show tuning, that is, frequency selectivity, and they clearly deliver their information to spatially limited segments of the ipsilateral cochlea. This implies that whatever the efferents do in that target region, it ultimately produces a reduction in the input of inner hair cells. In other words, cochlear mechanical response is reduced. Contralateral sound presumably influences the ipsilateral ear via the fast efferent effect. Whether there is a slow contralateral effect is as yet unknown.
It is difficult to ascribe an inhibitory influence to the changes in OHC properties reported here and thus to reconcile the results with thein vivo experiment most akin to ours, that of Murugasu and Russell (1996b). Two possible explanations could be invented. First, as alluded to above, the local feedback system in the organ of Corti is extremely complex, and we simply do not understand how spatially distributed changes in some of the elements affect the overall response. It is thus conceivable that mechanical changes in a large group of OHCs produce an overall effect opposite to that intuited from the behavior of a single element. Second, if somatic OHC motility is not the principal variable in cochlear amplification, then the present results simply tell a story about changes in an epiphenomenon. It has not been ruled out that voltage-controlled ciliary stiffness changes (Hudspeth, 1989; Evans and Dallos, 1993) are the important mechanism.
Footnotes
This work was supported by grants from the National Institute on Deafness and Other Communication Disorders, National Institutes of Health. We thank Drs. M. A. Cheatham, P. J. Kolston, C. P. Richter, and J. H. Siegel for their comments on this manuscript. Step-function responses obtained in the microchamber were provided by Drs. S. Vranic-Sowers and C. P. Richter.
Correspondence should be addressed to Peter Dallos, Northwestern University, 2299 North Campus Drive, Evanston, IL 60208.


