

Abstract
We report here that brief depolarizations such as action potentials trigger exocytosis in thin mouse adrenal slices. The secretory rates obtained in membrane capacitance recordings from chromaffin cells in slices are faster than those observed in isolated cells. Fast exocytosis in slices is attributable to the rapid release of a small pool of vesicles. The pool recovers from depletion with a time constant of 10 sec. Recruitment of the rapidly released vesicles is strongly hindered by the fast Ca2+ chelator BAPTA and much less by the slower chelator EGTA. We suggest that these vesicles are located in close proximity to Ca2+ channels. Spatial coupling of Ca2+ entry and exocytosis may be sensitive to cell isolation and culture.
- exocytosis
- membrane capacitance measurement
- chromaffin
- adrenal slice
- calcium chelators
- calcium-secretion coupling
- neuroendocrine
- calcium current
- secretory depression
Exocytosis is triggered by an elevation in cytosolic [Ca2+] in both neuroendocrine cells and nerve terminals (Douglas, 1968; Katz, 1969). Furthermore, just as in presynaptic terminals, action potentials (APs) are physiological stimuli for hormone release in neuroendocrine cells (Kidokoro and Ritchie, 1980; Wakade, 1982; Zhou and Misler, 1995). Nevertheless, there are distinct differences between hormone secretion from isolated neuroendocrine cells and release of transmitters from small clear-cored vesicles at neuronal synapses. For example, catecholamine release from isolated chromaffin cells is only loosely coupled to action potentials (Zhou and Misler, 1995), with latencies of several tens of milliseconds, whereas neurotransmission is highly synchronized (Katz and Miledi, 1965). The majority of the time delay of release in isolated chromaffin cells is attributed to the time required for Ca2+ to diffuse from a Ca2+ channel orifice to the release sites (Chow et al., 1996). On this basis a mean diffusional distance on the order of 300 nm has been estimated (Klingauf and Neher, 1997). Exocytosis of chromaffin granules can occur very quickly if the [Ca2+] at the release site is elevated to a sufficiently high level (Heinemann et al., 1994). In fact, isolated chromaffin cells release a small fraction of granules well synchronized with depolarizing stimuli, with latencies of <5 msec (Chow et al., 1994). This more synchronous release has been suggested to result from exocytosis of a small population of vesicles located closer to Ca2+ channels (Klingauf and Neher, 1997).
Morphological studies have suggested a polarized phenotype for adrenal chromaffin cells in situ (Carmichael, 1986). Synaptic inputs occur at the neural pole, and exocytosis may take place preferentially at the capillary pole (Carmichael et al., 1989). We were interested in whether chromaffin cells in situ show substantial synchronous secretion, as would be expected if distances for Ca2+ diffusion were short in a specialized region of the cell.
We performed patch-clamp measurements of membrane capacitance (Cm) (Neher and Marty, 1982) in mouse chromaffin cells in thin slices of adrenal glands and in primary culture. We report here that kinetics of exocytosis is more neuron-like in mouse chromaffin cells in slices than in culture. Cells in our slice preparation typically responded to individual APs with sizable exocytotic capacitance changes (ΔCexo), whereas only one of seven isolated cells showed comparable responses to single APs. Cells in slices secreted more than isolated cells for equivalent Ca2+ current integrals during short step depolarizations. Two different protocols, both evoking secretory depression, were used to demonstrate the existence of a small, rapidly secreted pool of vesicles in slices. The rapid kinetics of secretion in chromaffin cells in slices is suggested to result from close spatial coupling of release sites and Ca2+ channels.
MATERIALS AND METHODS
Adrenal slice preparation and whole-cell recordings.NMRI mice (4- to 10-week-old females) were killed by decapitation. After adrenal glands were removed, they were embedded in a 3% agar solution. The hardened agar block was then glued with cyanoacrylate onto the stage of a slicing chamber. The chamber contained ice-cold bicarbonate-buffered saline (BBS, solution 2). Slices of 100–200 μm thickness were sectioned on a vibrating tissue slicer (Campden Instruments, Cambridge, UK) at a frequency of 6 Hz. After the slices were sectioned, they were immediately transferred into a holding chamber containing oxygenated BBS (solution 1, continuously bubbled with 95% O2 and 5% CO2). Slices were kept at 37°C for 15 min and thereafter at room temperature.
For recording, slices were fixed in the recording chamber by means of a grid of nylon threads. After the slices were mounted onto the stage of an upright microscope (Axioscope, Zeiss), the chamber was perfused with bubbled BBS (95% O2 and 5% CO2, solution 1) at a flow rate of 1–2 ml/min. Usually a cleaning pipette was used to remove loose material from the cell surface. Conventional whole-cell recordings (Hamill et al., 1981) were performed with 3–4 MΩ pipettes, and an EPC-9 patch-clamp amplifier together with Pulse software (HEKA, Lambrecht, Germany) were used. Usually, gigaohm seals were formed on the nucleus-containing region. The access resistances ranged from 5 to 12 MΩ. Stable recordings could be obtained between 15 min and at least 8 hr after the slicing.
Evoked Ca2+ currents were measured under conditions in which potassium currents were blocked by intracellular Cs+and extracellular d-tubocurarine (Park, 1994). We did not use tetrodotoxin to block sodium channels because it prolongs a transient nonsecretory capacitance change (ΔCt) (Horrigan and Bookman, 1993), which is observed after depolarization of chromaffin cells. Instead, when the whole-cell current was integrated for estimation of the Ca2+ charge (QCa), the current during the first 1.9 msec was neglected for both preparations. Thus, our QCaestimate presumably missed the activating phase of the Ca2+current. For 2 msec pulses, therefore, QCarepresents mainly the Ca2+ tail current (QCa was measured until 1 msec after the end of the depolarization). No leak correction was applied; instead, cells with resting currents of more than −30 pA were discarded from analysis. Experiments on both preparations were carried out at room temperature.
Isolated chromaffin cell preparation and whole-cell recordings. After they were removed, 8–12 mouse adrenal glands were minced in cold calcium-free saline (Locke’s buffer). The tissue was then incubated with collagenase (Collagenase A, Boehringer Mannheim, Mannheim, Germany; catalytic activity 0.97 U/mg) in Locke’s buffer at a concentration of 3 mg/ml, in a shaking bath at 37°C for 15, 10, and 5 min. The tissue was triturated between incubations. The collagenase was then washed, and the resuspended material was filtered through a nylon mesh. After centrifugation, cells were resuspended in culture medium (M199 medium, Biochrom KG, Berlin, Germany) supplemented with penicillin/streptomycin, 10% FCS, and 1 mg/ml bovine serum albumin, plated on poly-l-lysine-coated coverslips, and incubated at 37°C with 10% CO2.
Cells were used for experiments starting 16 hr after isolation up to day 2 of primary culture. Chromaffin cells could easily be discriminated from cortical cells and fibroblasts by their round and smooth appearance. Experiments were carried out on an inverted microscope (Zeiss Axiovert 100). An EPC-9 patch-clamp amplifier was used together with PULSE software (Heka, Lambrecht, Germany). The access resistance ranged from 4 to 10 MΩ.
Whole-cell capacitance measurements. After the whole-cell configuration was established, the membrane capacitance was compensated by means of the “C-slow” compensation feature of the EPC-9. Capacitance measurements were performed using the Lindau–Neher technique implemented as the “sine+dc” mode of the “software lock-in” extension of PULSE software. A 1 kHz, 70 mV peak-to-peak sinusoid stimulus was applied at a DC holding potential of −80 mV.
Estimation of ΔCexo. Capacitance changes obtained in mouse chromaffin cells in response to depolarizations show, in addition to stable Cmincrements (attributable to exocytosis), a transient, nonsecretory component (ΔCt). Estimation of the exocytotic capacitance change (separation of ΔCexo from ΔCt) was performed using three different approaches (Figs. 1B, 2A,3C). In all cases the average prepulseCm served as baseline.

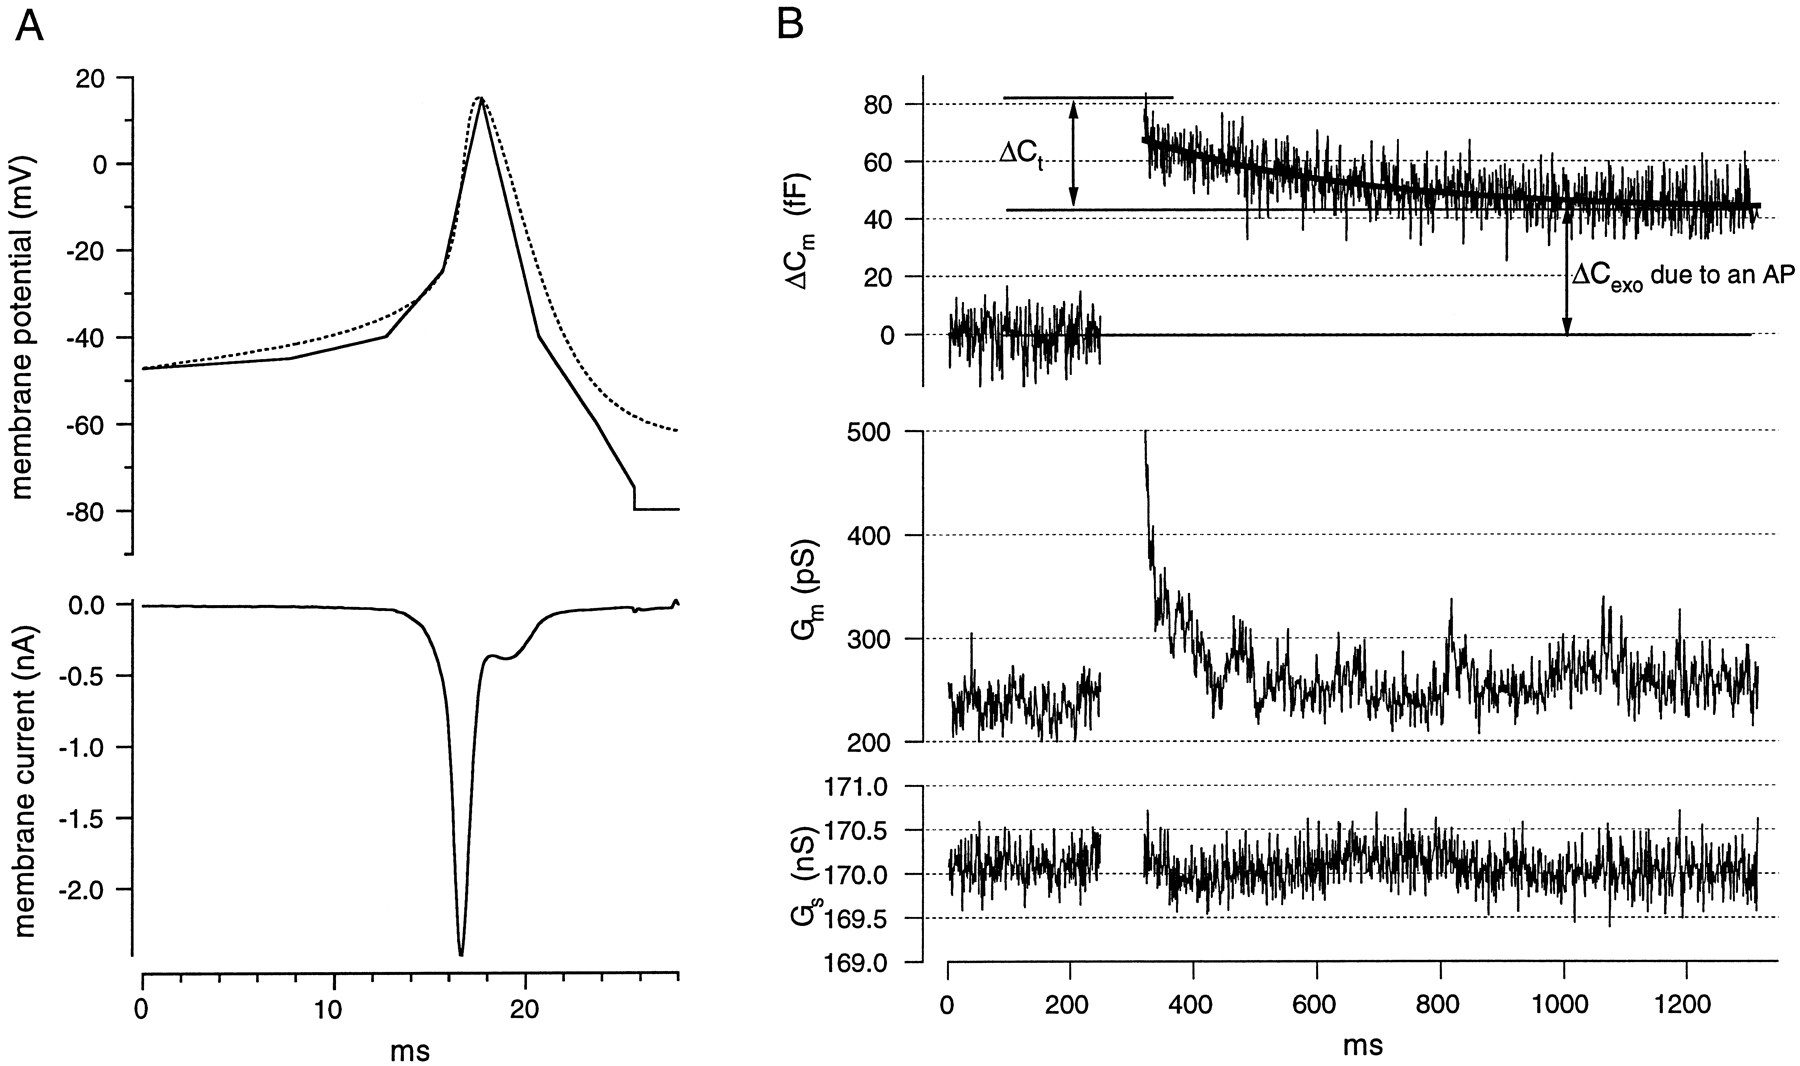
Single AP-like voltage commands cause exocytoticCm changes in mouse chromaffin cells in slices. A (top), Shape of a representative mouse chromaffin cell AP measured in current clamp with a potassium-based pipette solution (dashed line). Thesolid line shows the simulated AP-like voltage command used to study secretory responses to single APs. A, (bottom), A typical current response to the AP-like command, with K+ currents blocked by a Cs+-containing pipette solution (solution A) and d-tubocurarine in the extracellular saline (solution 1).B, Representative Cmmeasurement before and after application of a simulated chromaffin cell AP from a holding potential of −80 mV. The top tracedisplays the AP-induced Cm change. After an initial decay (ΔCt) (for more detail, see Results), a stable Cm increment (ΔCexo) remains. The asymptote of the exponential fit to ΔCm was used to quantify the ΔCexo evoked by the individual APs (approach 1 in Materials and Methods).Middle and bottom traces, Membrane conductance (Gm) and series resistance (Gs) are shown to illustrate that there was no major cross-talk among Cm,Gm, and Gsestimates.

Exocytotic Cm changes in response to short depolarizations are restricted to the time during the stimulation. Starting 30–60 sec after whole-cell recording, cells were depolarized for different durations 7–15 times, with an interpulse interval of 30 sec (depolarizing potential 0 mV). Solution 1 was used as external saline. [Ca2+]i was buffered to 300 nm (pipette solution B or C) by mixing Ca2+-free and Ca2+-loaded buffers to accelerate the vesicle replenishment (von Rüden and Neher, 1993). The holding potential was −80 mV. A (top), Typical capacitance changes in response to a 5 msec depolarization early (top trace: high release probability, 1 response) and late (bottom trace: after exhaustion of secretion, 20 responses averaged) in the experiment. The numbered shaded areas indicate the time periods over which ΔCm was averaged for the estimation of ΔCexo by approaches 1–3, as described in Materials and Methods. For this particular cell, the three approaches estimated ΔCexo with 27.8 and 27 fF (average over period 1 and asymptote of the exponential fit, respectively: approach 1), 24.4 fF (average ΔCm of period 2: 35.9 and 11.5 fF for the early trace and the average of late traces, respectively, approach 2), and 22.9 fF (average ΔCm of period 3: 49.5 fF; correction term: 8.3 fF/nA × 3.2 nA sodium current, approach 3). The bottom of A displays the same early ΔCm trace as above after subtraction of the exponential fit to the average of the late traces.B, Cm traces depicting ΔCexo of another slice cell in response to depolarizations of 2, 30, 100, and 200 msec duration (frombottom to top) recorded at comparable experimental times. As in the bottom of A, an exponential fit to the average ΔCm in response to 5 msec depolarizations at low release probability was subtracted from each trace. Both the 2 and the 30 msec responses do not exhibit increases in Cm after the end of the depolarization, indicating that ΔCexo is synchronized to Ca2+ entry for short pulses; however, longer depolarizations caused some secretion after the end of Ca2+ entry.
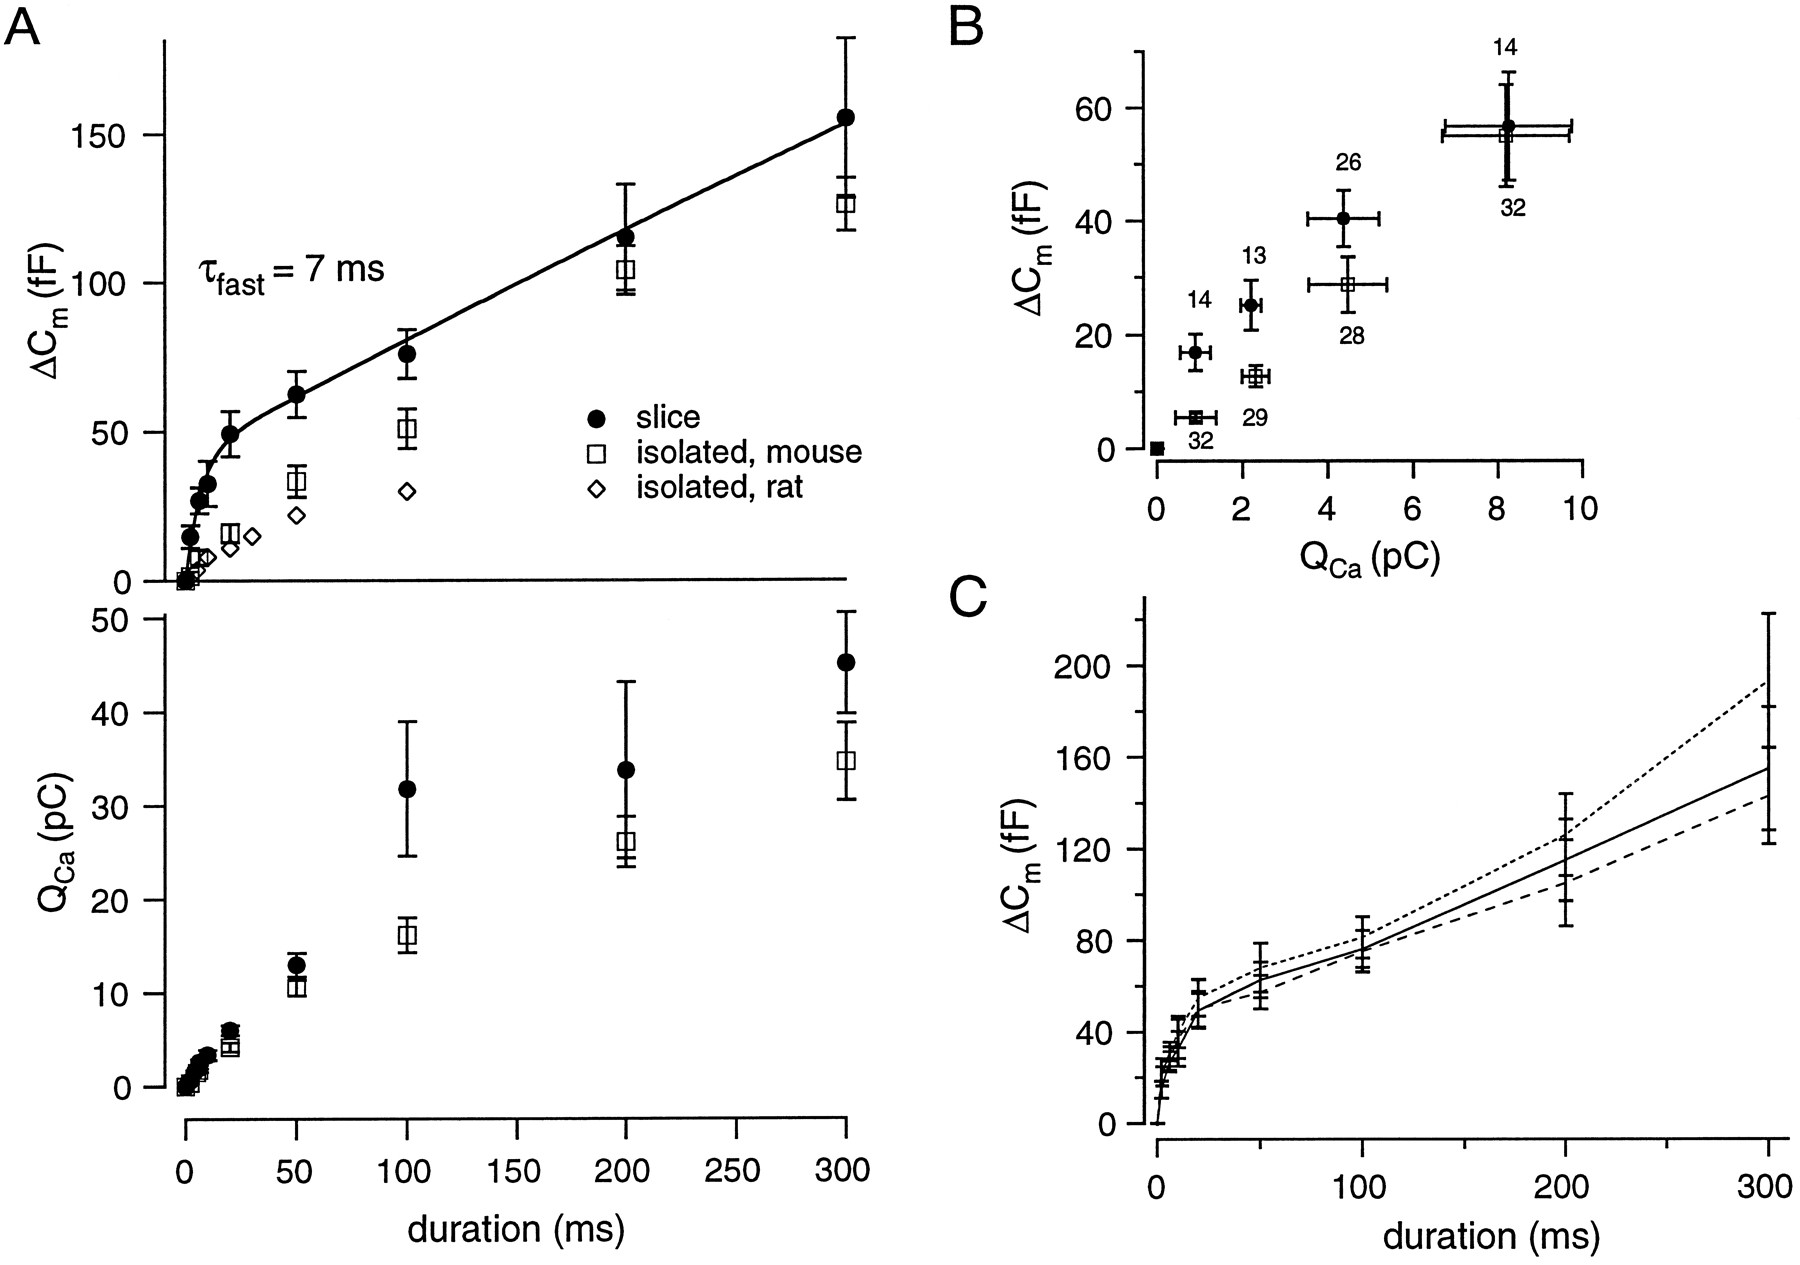
Mouse chromaffin cells in slices show a biphasic rise of ΔCexo with increasing duration of Ca2+ current injection. A(top), The filled circles represent pooled data of 10 slice cells with ΔCexoestimated by approach 2 in Materials and Methods. For convenience these data were fitted by a double exponential (solid line). The slow secretory component, however, did not saturate with our maximal stimuli. The empty squares plot the ΔCexo versus pulse duration data of 20 isolated mouse chromaffin cells. No clear separation into two secretory components was observed. Experiments were carried out as described above (pipette solution B), except that an external [Ca2+] of 10 mm was used. The ΔCexo versus pulse duration data obtained from isolated rat chromaffin cells by Horrigan and Bookman (1994) are displayed for comparison (diamonds).Bottom, A plot of QCa versus pulse duration demonstrates that for short depolarizations,QCa rises linearly with increasing pulse duration for both preparations. Furthermore, it shows that theQCa values of slice (filled circles) and isolated (empty squares) cells more or less overlap for short pulses. B, The same ΔCexo data as in Figure 3Awere related to their corresponding Ca2+ current integrals (QCa). The filled circlesrepresent pooled and binned data from slice experiments. The data for isolated mouse cells are displayed as empty circles. Note that the ΔCexo–QCarelation is displayed only for small QCavalues (where a difference between both preparations was observed). Thenumbers of data points per bin are printedabove and below the graph for slice and isolated chromaffin cells, respectively. The vertical bars are SEM for ΔCexo values, whereas the horizontal bars indicate SD of binnedQCa values. C, The different lines represent ΔCexo data from the same experiments in slices as those analyzed in Figure 3A, estimated by three different approaches (see Materials and Methods and Fig. 2A). The dashed line(approach 3 in Materials and Methods) represents early ΔCexo estimates, whereas the solid line (approach 2) and the dotted line (approach 1) result from later measurements after the pulse. This figure demonstrates that all three approaches give quite similar ΔCexo estimates at short depolarizations. The discrepancy between the estimates at 200 and 300 msec pulse durations is most likely attributable to some “post-pulse” secretion.
(1) ΔCexo was estimated after decline of ΔCt, either as the asymptote of an exponential fit to ΔCm (Figs.1B, 4) or as the ΔCm average taken over the time from 700 to 900 msec after the depolarization (Fig.2A, and dotted line in Fig.3C).

Secretory depression of slice cells is obtained with a pair of 20 msec depolarizations. This figure shows a representative ΔCm trace in response to a pair of 20 msec depolarizations (to −6 and 0 mV respectively; seetop panel for illustration of the voltage-clamp protocol). Pipette solution B and external solution 1 were used. The sum response (S) to both stimuli was measured as the asymptote of an exponential fit (solid line) to ΔCm after the second depolarization. The nonexocytotic ΔCt makes direct separate measurement of the exocytotic responses to the first and second depolarization (ΔCexo1 and ΔCexo2) difficult. Here, ΔCexo2 was estimated as the difference of ΔCm averages over the initial 300 msec after the second and the first depolarization, respectively. ΔCexo1 was then calculated asS − ΔCexo2. This analysis relies on the assumption that the nonsecretory transient (ΔCt) is the same after the first and the second depolarization. This is reasonable, because ΔCt saturates for depolarizations as short as 5 msec (Horrigan and Bookman, 1994). For illustration, the exponential fit to the ΔCm trace after the second depolarization in addition was overlayed onto the ΔCm segment after the first pulse (dashed line).
(2) ΔCt was measured in response to 5 msec depolarizations late in the experiment after the release probability was lowered by reduction of Ca2+ influx (omission of Ca2+ from the extracellular solution or application of 50 μm Cd2+) or by exhaustion of secretion by repetitive stimulation. For the purpose of illustration, an exponential fit to the averaged low release probability ΔCm traces of a cell was subtracted from early ΔCm traces of the same cell in Figure 2, A and B. For quantitative analysis, ΔCt was estimated by averaging ΔCm between 100 and 400 msec after the end of depolarization in low release probability traces. The same averaging time window was used for estimation of ΔCm at high release probability early in the experiment. Finally, ΔCt was subtracted from the early ΔCm estimates to yield ΔCexo shown in Figures3A,B,C (solid line) and 5. The different ΔCm estimates at early and late experimental times are most likely attributable to different amounts of exocytosis, because in the rare cases in which cells did not show Ca2+ influx but had robust voltage-dependent Na+ currents, there was no such change in ΔCm with time (data not shown).
(3) For comparison, we also measured ΔCm by averaging over the initial 10 msec after the depolarization and then subtracting 8.3 fF times the peak sodium current amplitude in nanoamperes (a correction term given byHorrigan and Bookman, 1994) (Fig. 2A, dashed line in Fig. 3C). Figure 3C shows that all three approaches result in similar values for responses to short depolarizations.
ΔCm estimation and other analyses were performed in Igor software (Wavemetrics, Lake Oswego, OR). Data are given as mean ± SEM unless indicated otherwise. A paired Student’s t test was used for comparison of means.
Potential contamination of the capacitance measurements by electrical coupling of mouse chromaffin cells in situ. In our study only a fraction of mouse chromaffin cells showed electrical coupling, and most of the coupled cells seemed to be connected to only one neighboring cell with low junctional conductance (200–500 pS; T. Moser, unpublished observation). Thus, for calculation of the potential contribution of the neighbors to the capacitance measured in the patch-clamped cell, we assumed that a cell was coupled to one neighbor with a 2 GΩ resistance. For the high frequency of the sinusoidal excitation voltage used (1 kHz), we can simplify the equivalent circuit of the coupled neighbor cell to an RC circuit consisting of the junctional resistance (Rj ) and the membrane capacitance (Cm). The real and imaginary components of this RC-circuit will contribute very little to the Cm estimation in the patch-clamped cell, because the break frequency of this RC element is 8.6 Hz (more than 100 times less than the excitation frequency). Thus, assuming a 9 pF neighbor cell coupled with a Rj of 2 GΩ, we estimate that the Cm recording would be in error by <1 fF because of cell coupling.
Recording solutions. The standard BBS (solution 1) used for slice recordings contained 125 mm NaCl, 26 mm NaHCO3, 2.5 mm KCl, 1.25 mm NaH2PO4, 2 mmCaCl2, 1 mm MgCl2, 10 mm glucose, 0.2 mm d-tubocurarine. For reduction of Ca2+ influx, we either omitted extracellular Ca2+ (replacing it with 2 mm MgCl2) or added 50 μm CdCl2. Our low-Ca2+ BBS (solution 2) was identical to solution 1 except that it contained 0.1 mm CaCl2, 3 mm MgCl2, and no d-tubocurarine. All BBS solutions were adjusted to pH 7.4 by bubbling with 95% O2and 5% CO2. The standard extracellular solution used for recordings from isolated chromaffin cells (solution 3) contained 150 mm NaCl, 2.8 mm KCl, 10 mmCaCl2, 1 mm MgCl2, 10 mm sodium-HEPES, 0.2 mmd-tubocurarine, pH 7.2.
All pipette solutions contained 145 mm cesium-glutamate, 8 mm NaCl, 1 mm MgCl2, 2 mm magnesium-ATP, 0.3 mm Na2-GTP (Boehringer Mannheim), 10 mm cesium-HEPES [CsOH was purchased from Aldrich (Milwaukee, WI)]. Pipette solution A contained 200 μm EGTA and no added Ca2+. Pipette solutions (B, C, D, and E) were all buffered to a [Ca2+] of ∼300 nm using mixtures of Ca2+-free and Ca2+-loaded chelator solutions, but they differed in the amount and type of the chelator. Scatchard plot analysis was used to determine the Kd for Ca2+ and the purity of BAPTA to be 220 nm and 98.8%, respectively (the Ca2+ electrode was from Microelectrodes, Londondarry, NH; cesium-BAPTA was from Molecular Probes, Eugene, OR). Ca2+-loaded EGTA was prepared as described in Neher (1988), and its Kd for Ca2+ was assumed to be 150 nm. Pipette solutions B and C contained 100 μm Ca2+-free EGTA or BAPTA, respectively; D and E included 1 mm Ca2+-free EGTA or BAPTA, respectively. Chemicals were from Sigma (St. Louis, MO) unless stated otherwise. The liquid junction potentials of extracellular solutions against the cesium–glutamate-based internal solutions were measured to be +10 mV for all extracellular solutions used, and all clamp potentials were corrected accordingly.
RESULTS
Mouse chromaffin cells in slices secrete in response to single APs
Patch-clamped mouse chromaffin cells in slices were stimulated with AP-like voltage commands. The AP voltage template used was similar to the average shape of mouse chromaffin cell APs (n = 80) recorded from three cells in slices in the current-clamp mode (Fig.1A). To monitor the secretory response, we measured Cm before and after each stimulus (Cm cannot be measured during the depolarization). In each of the seven cells we studied, AP stimulation caused a stable Cm increment after a rapidly decaying Cm transient (for an example, see Fig.1B). Although the stable Cmincrements most likely represent exocytotic Cmchanges (ΔCexo), the initialCm transient (ΔCt) is probably attributable to a nonsecretory capacitance change caused by gating charge movement of sodium channels (Horrigan and Bookman, 1994). Thus, we could still observe ΔCt after rundown of the secretory response as well as after reduction of the voltage-gated Ca2+ entry (see Materials and Methods). LikeHorrigan and Bookman (1994), we could abolish ΔCt by incubation with dibucaine (200 μm, data not shown), which blocks gating charge movement in squid axons (Gilly and Armstrong, 1980). ΔCt in mouse chromaffin cells in slices on average decays with a time constant of ∼230 msec. During this study we used three different approaches to separate exocytotic capacitance changes (ΔCexo) from ΔCt, which result in similar estimates for ΔCexo (see Materials and Methods and Figs.2A, 3C).
To quantify the exocytotic response to individual APs, we applied five to seven stimuli at intervals of 30–45 sec to seven cells starting 30–60 sec after the beginning of whole-cell recording. After subtraction of the prepulse capacitance, the ΔCm traces of a cell were averaged, and ΔCexo was estimated as the asymptote of an exponential fit to ΔCm (representing the part of ΔCm remaining after decline of ΔCt; approach 1 in Materials and Methods). For the pooled data, an average ΔCexo of 16.6 ± 3.6 fF (n = 7) was determined.
Analogous experiments were performed in isolated mouse chromaffin cells. We used 10 mm extracellular [Ca2+], instead of the 2 mm [Ca2+] in the experiments in slices, to compensate for the reduction of calcium current caused by the cell isolation (see “Comparison with isolated mouse chromaffin cells” below). Nevertheless, only one of seven cells showed comparable exocytotic responses to single APs, although all of them secreted in response to longer depolarizations (data not shown). The average ΔCexo of the seven isolated cells was 4.4 ± 2.6 fF.
For comparison of the observed AP-induced capacitance changes with the results of an amperometric study on AP-stimulated catecholamine secretion from isolated rat chromaffin cells by Zhou and Misler (1995), capacitance units must be converted to numbers of granules. The size of chromaffin granules varies (diameters range from ∼50 to 500 nm) (for review, see Carmichael, 1986), and thus variation is also observed for membrane capacitance increments attributable to fusion of individual chromaffin granules (Neher and Marty, 1982). The mean capacitance of individual chromaffin granules has been measured to be 2.5 fF in bovine chromaffin cells (Neher and Marty, 1982; Chow et al., 1996). Therefore, isolated mouse chromaffin cells would secrete less than two granules per single AP if one assumes an analogous mean capacitance for mouse chromaffin granules. Zhou and Misler (1995) detected less than one release event/AP at low AP frequency (0.2–1.0 Hz). Considering that the efficiency of their amperometric detector was only ∼25% (Zhou and Misler, 1995), whereas all fusion events are revealed by Cmmeasurements performed in the present study, the numbers obtained in isolated mouse and rat chromaffin cells seem compatible. On the other hand, mouse chromaffin cells in slices did respond to individual APs with larger capacitance changes, which on average would correspond to approximately six to seven granules/AP (if a mean capacitance of 2.5 fF is assumed for chromaffin granules).
Unfortunately, it was not technically possible to confirm by amperometry that the secretory capacitance changes in response to APs observed in slices represent fusion of chromaffin granules. In particular, there was a large amperometric background current, probably resulting from catecholamines set free from damaged cells (data not shown). From fluctuation analysis of capacitance changes in response to repetitive, brief (10 msec) depolarizations in slices, we have estimated a mean capacitance contribution of single vesicles compatible with values expected for chromaffin granules (T. Moser and E. Neher, unpublished observations). Thus, it is likely that the bulk of the 16.6 fF capacitance change measured in slices in response to individual APs is attributable to exocytosis of chromaffin granules instead of small synaptic-like microvesicles that have been observed in neuroendocrine cells (for review, see Thomas-Reetz and De Camilli, 1994).
High secretory rates in mouse chromaffin cells in slices result from rapid release of a small pool of vesicles
The rate of secretion is commonly modeled as the product of the number of release-ready vesicles and the Ca2+-dependent rate constant of secretion (Thomas et al., 1993; Heinemann et al., 1994). Thus, high secretory rates can be obtained by a large pool of fusion-competent vesicles and/or by fast release kinetics. The existence of a distinct depletable pool of vesicles is suggested by the observation that the secretory rate drops despite continued stimulation. This secretory depression is commonly interpreted as depletion of a pool of fusion-competent vesicles, which cannot be refilled sufficiently fast to maintain rapid secretion. We used two protocols designed to deplete pools to characterize the kinetic components of depolarization-induced secretion in mouse chromaffin cells in slices.
Protocol 1: secretory responses to Ca2+ current injections of different duration
Ideally, the study of release kinetics would include measurements of the secretory rate throughout the time of stimulation. Then, in principle, increasing the duration of the stimulation (depolarization-induced Ca2+ current injection) should lead to a drop in secretory rate, indicating pool depletion. However, voltage-dependent conductances make Cmmeasurements unreliable during the depolarization. In addition, amperometric measurements of catecholamine release, which can be performed during a depolarization, are problematic in slices (see above).
Instead, we reconstructed the relation between secretory response and duration of Ca2+ current injection by measuring the ΔCexo in response to step depolarizations (to 0 mV) of different durations. This protocol has been used previously to study secretion in bipolar terminals (von Gersdorff and Matthews, 1994), isolated rat chromaffin cells (Horrigan and Bookman, 1994), bovine chromaffin cells (Gillis et al., 1996), and nerve terminals in thin slices of the neurohypophysis (Hsu and Jackson, 1996).
Pulses of different duration were applied in random order. Thirty seconds were allowed for recovery between the depolarizations. In the course of the experiments, decline of ΔCexoand Ca2+ currents was observed for all pulse durations, which we interpreted as run-down (Augustine and Neher, 1992; Burgoyne, 1995). Interpretation of recent results has suggested that after decline of ΔCexo attributable to run-down, secretion in a different kinetic mode may persist (threshold-type secretory mode) (Seward and Nowycky, 1996).
Figure 2, A and B, shows representative ΔCt-corrected responses to pulses of different length and demonstrates that for short stimuli, the exocytotic capacitance change occurred only during the stimulation. Therefore, even when ΔCexo was measured at different times after short depolarizations (see Materials and Methods and Figs.2A, 3C), it could be interpreted as the exocytotic capacitance change during the time of depolarization. The highest secretory rate (calculated as ΔCexo/pulse duration) was observed for the shortest (2 msec) depolarizations, indicating a very short delay of secretion to the onset of the stimulus. On average, 2 msec depolarizations resulted in a ΔCexo of 14.7 ± 3.7 fF (nine depolarizations in three cells), which corresponds to a maximal secretory rate of ∼7300 fF/sec.
The top of Figure 3A (filled circles) shows the biphasic rise of ΔCexo, with increasing pulse duration in mouse chromaffin cells in slices (pooled data from 10 cells). The fast component of a double exponential fit to the data had a time constant (τfast) of ∼7 msec (n = 10 cells, 112 depolarizations). The observed drop in the secretory rate could be attributable to depletion of fusion-competent vesicles or result from lessening of the stimulus intensity (for example, because of Ca2+ current inactivation). The integrals of the Ca2+ currents (QCa) are plotted as a function of the pulse length in the bottom of Figure 3A (filled circles). The slope of this plot (which is the average calcium current) does not decline for short pulses even if durations are much longer than τfast. Thus, the observed drop of the secretory rate is most likely attributable to depletion of available vesicles rather than to Ca2+ current inactivation. Therefore, the fast component is interpreted as secretion from a limited pool of vesicles, with τfast being the time constant for pool depletion (7 msec) and its amplitude of ∼42 fF representing the pool size. Similar results were obtained in five mouse chromaffin cells in slices that were dialyzed with pipette solution A, which contained 200 μm free EGTA without added Ca2+ (data not shown).
The slow secretory component apparent in the ΔCm versus pulse duration plot could be fitted equally well by a line or a slow exponential. The slope of the best fit line between 20 and 300 msec is ∼270 fF/sec. Interpretation of this component is complicated by two observations. Secretion often persists after the end of long depolarizations (Fig. 2B), such that for longer pulses the rise of the ΔCexoestimates with increasing pulse duration cannot be easily interpreted as secretory rate. Also, the bottom of Figure 3A shows that Ca2+ current inactivation is significant for long pulses.
Comparison with isolated mouse chromaffin cells
Figure 3 also presents data obtained from 20 isolated mouse chromaffin cells (empty squares) in experiments analogous to those performed in slices. Again, 10 mm extracellular [Ca2+] was used for isolated cells. In most of the isolated cells, short depolarizations (<50 msec) caused much less secretion than in slices; however, longer stimuli (>100 msec) gave similar ΔCexo values for the two preparations. The highest secretory rate was observed for 5 msec depolarizations, which on average caused ΔCexo of 7.6 ± 2.52 fF (n = 46 responses from 20 cells), corresponding to a secretory rate of ∼1300 fF/sec. Responses of isolated mouse chromaffin cells to short depolarizations were similar to those obtained from isolated rat chromaffin cells (diamonds in Fig. 3A, taken from Horrigan and Bookman, 1994) or from isolated bovine chromaffin cells (Gillis et al., 1996).
The bottom of Figure 3A shows that isolated mouse chromaffin cells, on average, have smaller Ca2+ currents despite the higher extracellular [Ca2+] (10 vs 2 mm). Nevertheless, a plot of ΔCexo versusQCa (Fig. 3B) depicts that cells in slices still secrete more for a given amount of Ca2+ influx for small QCa values. The difference between mean ΔCexo values of slice and isolated cells was statistically significant at QCa values of 0.9 pC and 2.2 pC (p < 0.01 andp < 0.02, respectively). At higherQCa, ΔCexo values from both preparations were hard to distinguish statistically.
Protocol 2: secretory responses to pairs of depolarizing pulses
To obtain a second estimate for the number of rapidly releasable vesicles (pool size), we further studied secretory depression using a paired-pulse protocol. We applied short depolarizations (20 msec, ∼3 × τfast, see above; interval between both stimuli: 300 msec) to preferentially recruit vesicles with fast-release kinetics. Starting 30–60 sec after whole-cell recording, dual pulses were applied with intervals of at least 30 sec to allow replenishment of fusion-competent vesicles.
Figure 4 shows a typical ΔCm trace and illustrates the analysis. Using the sum (S) of the secretory Cmresponses to the first (ΔCexo1) and second (ΔCexo2) stimulus and the ratio (R) of ΔCexo2 over ΔCexo1, an upper boundary for the pool size (Bmax) can be calculated according to:
 Equation 1if depression is achieved [R < 1; see Gillis et al. (1996) for derivation].
The actual pool size would be given exactly by Equation 1 if both stimuli released the same fraction of the pool of releasable vesicles. Here, the depolarizing potentials were adjusted to match theQCa values of both pulses. Using potentials of −6 mV and 0 mV for the first and second pulses, respectively, the ratio QCa2/QCa1 was 1.05 ± 0.04 (21 double pulses in seven cells). The second Ca2+ injection of the dual pulse, however, presumably caused a higher and spatially more extended rise of [Ca2+]i than the first pulse, because of residual Ca2+ and submembrane “buffer depletion” (or saturation) remaining 300 msec after the first stimulus. In terms of the kinetic pattern revealed by the ΔCexoversus pulse duration plot, we assume that the second depolarization recruited not only vesicles involved in the fast secretory component but also those comprising the slower phase of secretion. This assumption is supported by the finding that a second pulse several seconds after the first actually gave a smaller response than a pulse that followed the first depolarization by only 300 msec (Fig. 6). It is therefore likely that Bmax overestimates the actual pool size (hence the “max” notation). This may not be the case if shorter pulses are used in the dual-pulse protocol. Here,Bmax is taken as an upper boundary for the size of the pool. ΔCexo1, on the other hand, is a reasonable lower boundary.

Recovery time course of the fast secretory component in mouse chromaffin cells in slices. The ratio of ΔCexo caused by two identical 20 msec depolarizations (ratio of the second over the first ΔCexo) is plotted versus the separation times of the two stimuli. Intervals of 30 sec or more were allowed between the pairs of stimuli for complete recovery of the fast secretory component. The filled triangles represent ratios of responses to accordingly separated, individual 20 msec depolarizations to 0 mV. The data were obtained in five cells from two preparations (pipette solution B, external solution 1). ΔCexo was estimated by approach 1 in Materials and Methods. The filled circles represent data from a different set of eight cells in which we applied pairs of dual pulses at varying separation times (configuration of the dual pulses as described in Fig. 4, pipette solution B, external solution 1). ΔCexo1 of the second and the first dual pulses (estimated as described in Fig. 4) were related to each other. The fit to the pooled ratios from both sets of experiments revealed a recovery time constant of 10 sec. Back-extrapolation to 0 sec separation time indicates that the maximum depletion by the first stimulus was 80% (empty square). For comparison, thestar symbol represents the mean ratio ΔCexo2 over ΔCexo1 within a dual pulse (300 msec separation, 40% depletion) determined for the same experiments.
In all seven cells analyzed, secretory depression (R < 1) was observed in the majority of the pulses (R = 0.60 ± 0.06; n = 21 dual pulses from seven cells). The mean ΔCexo1 was 31.7 ± 4.1 fF, and the mean ΔCexo2 was 17.6 ± 2.4 fF. Three of twenty-one dual pulses were excluded from theBmax estimation because their R was >0.8. The average Bmax was then 73.1 ± 10.7 fF. Thus, the dual-pulse analysis (in this set of experiments) indicated a size of the pool of rapidly releasable vesicles between 31.7 and 73.1 fF.
The fast secretory component in slices is more sensitive to BAPTA than to EGTA
In the case of close spatial coupling of Ca2+ channels and release sites, secretion should be more sensitive to intracellular application of fast Ca2+ chelators like BAPTA than to slow Ca2+ chelators like EGTA (Adler et al., 1991). The rapid-release kinetics in mouse chromaffin cells in slices prompted us to test the effects of 1 mm free BAPTA and EGTA on the fast secretory component. Ten cells were investigated under each condition, using the same protocol as depicted in Figures 2 and 3.
Both the amplitude and the time constant of the fast exponential component were slightly altered by EGTA (∼28 fF and 8 msec, respectively, as compared with 42 fF and 7 msec at low buffering conditions). In contrast, the fast secretory component was hardly detectable in cells dialyzed with BAPTA (Fig.5A). The delayed rise of ΔCexo in cells dialyzed with BAPTA most likely represents recruitment of vesicles after the chelator became locally increasingly saturated by the incoming Ca2+. Responses to longer depolarizations were comparable between EGTA- and BAPTA-buffered cells but smaller than those observed at low buffering conditions, indicating that both buffers similarly suppress the slow secretory component. A plot of ΔCexo versusQCa (Fig. 5B) shows a small inflection for the case of BAPTA at small QCavalues, but otherwise is quite similar in shape to the ΔCexo pulse duration plot for both chelators (Fig. 5A).

The fast secretory component in mouse chromaffin cells in slices is strongly reduced by BAPTA but much less by EGTA. Experiments were performed similarly as described in Figure 2. Stimulation was started ∼60 sec after the whole-cell configuration was established. ΔCexo values were estimated by approach 2 in Materials and Methods. For both pipette solutions (D and E), [Ca2+] was adjusted at ∼300 nm by mixing Ca2+-free and Ca2+-loaded buffers. The holding potential was −80 mV.A, ΔCexo versus pulse duration plot of pooled data from experiments with either 1 mm free EGTA (filled circles;n = 10 cells; solution D) or 1 mm free BAPTA (empty circles; n = 10 cells; solution E). Experiments were carried out in the same slice preparations for both conditions (five different preparations). In the BAPTA-buffered cells, short depolarizations caused much less secretion than in those dialyzed with EGTA. With longer pulses, however, the secretory responses under both buffering conditions were comparable or even larger with BAPTA (possibly because of the lessening of Ca2+ channel inactivation). B, The same ΔCexo data as in A were plotted against their corresponding Ca2+ current integrals (QCa). The raw data were arbitrarily binned;vertical bars are SEM of ΔCexo, and horizontal barsare SD of QCa. The right-most BAPTA point indicates that the higher ΔCexo values at longer pulse durations were at least partly attributable to larger Ca2+ currents in the BAPTA-buffered cells.
Recovery of the fast secretory component in slices (pool refilling)
We investigated the recovery time course of the fast secretory component by comparing ΔCexo for two “pool-depleting” depolarizations (20 msec) separated by different intervals. Figure 6 shows the time course of recovery with 300 nm [Ca2+]free in the pipette. The symbols represent ratios of second over first ΔCexo responses. Secretion was elicited either by separated individual depolarizations (triangles) or by separated dual pulses (circles; the dual pulses had the same configuration as depicted in Fig. 4). In the latter case, ratios were calculated for the first depolarizations (ΔCexo1; see Fig. 4) of the two separated dual pulses. Pool refilling measured in both ways is quite similar and well fitted by a single exponential with a time constant of ∼10 sec (pooled data from 13 cells, seven preparations). Back-extrapolation to time 0 gave a ratio of 0.2 (empty square in Fig. 6), indicating 80% pool depletion for the first stimulus.
If a first-order kinetic scheme can be assumed for the pool refilling, as indicated by the mono-exponential time course, then the maximal refilling rate is given by the product of the recovery rate constant (1/τ) and the pool size. Applying the dual-pulse analysis (see above) to each first of the separated dual pulses (which recruited the completely filled pool in these experiments), we estimated the lower (ΔCexo1) and upper pool size bounds (Bmax) to be 25.4 ± 2.35 fF and 55.7 ± 4.8 fF, respectively (n = 26 pulses from eight cells). Taking ΔCexo1,Bmax, and the refilling rate constant, we calculated lower and upper bounds for the maximal refilling rate as 2.5 and 5.6 fF/sec, respectively.
DISCUSSION
Chromaffin cells in situ can secrete in response to individual APs. We demonstrated that this rapid exocytosis is from a small pool of vesicles that probably experience a very high [Ca2+] during the stimulation. Furthermore, the characterization of secretion kinetics for wild-type mouse adrenal chromaffin cells lays the foundations for future comparison with transgenic mice.
Kinetic components of depolarization-induced secretion in mouse chromaffin cells in slices
Fast secretory component
When voltage step depolarizations of varying duration are applied to mouse chromaffin cells in slices, a rapid secretory component is observed that can be well separated from a slower secretory component. The fast component most likely represents a pool of vesicles similar in size (42 fF) to rapidly recruited pools found in isolated rat chromaffin cells (33.9 fF) (Horrigan and Bookman, 1994), isolated bovine chromaffin cells (34 fF) (Gillis et al., 1996), and peptidergic nerve terminals in slices of the rat posterior pituitary (40 fF) (Hsu and Jackson, 1996). The size of our fast secretory component also falls well into the range for the pool size derived from the dual-pulse analysis (25–73 fF) in our slice preparation.
The recovery time constant of the rapidly recruited pool in our slice preparation (10 sec) is in good agreement with time constants of pool refilling in other preparations. Thus, Stevens and Tsujimoto (1995)obtained a time constant of 10 sec for synapses of cultured hippocampal neurons, and a time constant of 8 sec was measured in bipolar terminals by von Gersdorff and Matthews (1997). The time needed for complete recovery (∼3τ) of the fast secretory component in our slice preparation (with [Ca2+]i buffered to 300 nm) is slightly shorter than that required for complete pool refilling in bovine adrenal chromaffin cells (60 sec, without addition of Ca2+-loaded buffers to the pipette solution) (von Rüden and Neher, 1993). This difference could well be caused by the slightly elevated [Ca2+]i in our experiments, because refilling is Ca2+ dependent (von Rüden and Neher, 1993).
Slow secretory component
We did not explore the slow secretory component in detail. Although we cannot exclude that it represents a fast delivery or priming process, we favor the idea that longer Ca2+injections lead to a spatially more extended rise in submembrane [Ca2+] and thereby recruit fusion-competent vesicles located at greater distances from the Ca2+ channels. The rate of pool recovery (upper boundary: 5.6 fF/sec) is almost 50 times smaller than the slope of the slow Cm rise (270 fF/sec). Even though [Ca2+]i is higher during a pulse (when the slow secretory component is measured) than between pulses (as in the recovery experiments), it seems unlikely to us that the supply rate could increase fiftyfold because of an increased [Ca2+]. Thus, it was concluded from experiments in which catecholamine secretion was triggered by dialysis with high [Ca2+] that the vesicle delivery rate may be half-maximal already at a [Ca2+]i of 1.2 μm(Heinemann et al., 1993).
The concept of a “releasable pool” implies a set of vesicles in the same state of fusion competence; however, spatial heterogeneity of the Ca2+ signal during membrane depolarization can divide a pool of vesicles with homogeneous fusion competence into kinetically distinct subpools (Horrigan and Bookman, 1994). The fractions of vesicles comprising the fast and slow secretory components described here might represent subpools of a large readily releasable pool. This large pool was presumably only marginally depleted by our maximal stimuli.
Thus, at least two kinetic components might ensure catecholamine release over a wide range of splanchnic nerve activities. Release at low chromaffin cell AP frequencies will be mediated by the small fast pool, whereas the large slow secretory component is probably recruited during stronger stimulation.
The fast kinetics of secretion in mouse chromaffin cells in slices suggests close spatial coupling of release sites and Ca2+channels
The average initial secretory rate for mouse chromaffin cells in slices (7300 fF/sec) is much faster than that obtained for isolated mouse (1300 fF/sec), rat (680 fF/sec) (Horrigan and Bookman, 1994), and bovine (860 fF/sec) (Chow et al., 1994) chromaffin cells. We conclude that a fast release kinetics rather than a large pool underlies the high secretory rate in mouse chromaffin cells in slices, because their fast secretory component compares well in size with rapidly secreted pools described previously for isolated chromaffin cells (see above). High average secretory rates have also been obtained from peptidergic nerve terminals in slices of the posterior pituitary (Hsu and Jackson, 1996). The different kinetics in mouse chromaffin cells in slices and in primary culture are not simply attributable to the larger Ca2+ currents in slices, because cells in slices show more secretion for a given amount of Ca2+ entry when the responses to short depolarizations are compared (Fig. 3B). Possible explanations for the faster release kinetics in chromaffin cells in slices include (1) higher [Ca] at the release sites because of particular spatial arrangements of Ca 2+ channels and release sites, (2) higher [Ca] at the release sites in slices caused by contribution of fast calcium-induced calcium release (CICR) present only in the slice preparation, and (3) different Ca2+dependencies of secretion in slice and isolated cells.
Possibilities (2) and (3) are unlikely. When we intracellularly applied ruthenium red, an inhibitor of CICR (Miyamato and Racker, 1982), rapid exocytosis remained unaffected (50 μm in the presence of 1 mm free EGTA; data not shown), ruling out a major contribution of CICR. Regarding possibility (3), it seems important to note that the amount of secretion in slice and isolated cells was clearly distinguishable only for small amounts of Ca2+ influx. Therefore, one would have to postulate that only the fast release component is more sensitive to [Ca2+] in slices, whereas the slow component shares the same (low) Ca2+ sensitivity with the isolated cells.
We favor the interpretation that the Ca2+ sensors of a fraction of release sites in chromaffin cells in slices experience a very high [Ca2+] because of their close spatial relation to the Ca2+ channels [possibility (1)]. A global elevation of [Ca2+]i of 40–80 μm by flash photolysis in bovine chromaffin cells (Heinemann et al., 1994) provides a vesicle release rate constant comparable to the average value in slices (140 sec−1). Buffering [Ca2+]i with BAPTA strongly decreased the fast secretory component. The different effects of equimolar concentrations of BAPTA and EGTA on the fast secretory component in mouse chromaffin cells in slices suggest that Ca2+ is trapped by the Ca2+ sensor of the release site before Ca2+ binding to the chelators has reached an equilibrium. This is taken as additional support for short diffusional distances between Ca2+ channels and release sites.
Possible explanations for a high [Ca2+] at the release sites with Ca2+ originating solely from Ca2+entry include clustering of Ca2+ channels with or without co-clustering of release sites and molecular coupling of release sites and Ca2+ channels. The polarized phenotype of chromaffin cells in situ (Carmichael, 1986) certainly motivates speculation of a co-clustering of “exocytotic” Ca2+channels and release sites at the capillary pole (Michelena et al., 1995), which then would favor directional catecholamine release into the capillaries. Robinson et al. (1995) reported overlap of hotspots of submembrane [Ca2+] and of secretion in isolated bovine chromaffin cells and argued for release from active zone-like structures in these cells. On the other hand, Robinson et al. (1995)acknowledged that hotspots of submembrane [Ca2+] were seen only in a fraction of cells. Furthermore, functional studies on the same preparation indicated that the majority of the release sites is located, on average, several hundreds of nanometers away from the nearest channel (Klingauf and Neher, 1997). The two findings can be accommodated if it is assumed that morphological specializations, which exist in situ, are preserved only to a variable extent in primary culture. The different secretion kinetics observed for slice and isolated cells in the present study support this assumption.
Molecular coupling has been demonstrated for syntaxins with N- and P/Q-type Ca2+ channels (Bennett et al., 1992; Rettig et al., 1996). To our knowledge, however, no data are available showing to what extent Ca2+ influx through different Ca2+channel types triggers secretion in mouse chromaffin cells in situ or in isolation. Whether the high [Ca2+] at release sites of chromaffin cells in slices during depolarization is attributable to molecular coupling of release sites to Ca2+channels or to segregation of Ca2+ channels into specialized regions of the plasma membrane remains to be clarified.
Footnotes
This work was supported by grants from the Human Frontiers Science Program (RG-4/95B) and the Deutsche Forschungsgemeinschaft (SFB 523) to E. Neher. We thank Drs. Kevin Gillis, Henrique v. Gersdorff, Corey Smith, and C. Matthes for critical feedback on this manuscript. We thank F. Friedlein and M. Pilot for expert technical assistance. We thank Dr. R. J. Bookman for providing the rat chromaffin cell data shown in Figure 3A.
Correspondence should be addressed to E. Neher at the above address.


