

Abstract
The responses of individual salamander L-cones to light steps of moderate intensity (bleaching 0.3–3% of the total photopigment) and duration (between 5 and 90 s) were recorded using suction electrodes. Light initially suppressed the circulating current, which partially recovered or “sagged” over several seconds. The sensitivity of the cone to dim flashes decreased rapidly after light onset and approached a minimum within 500 ms. Background light did not affect the rising phase of the dim flash response, a measure of the initial gain of phototransduction. When the light was extinguished, the circulating current transiently exceeded or “overshot” its level in darkness. During the overshoot, the sensitivity of the cone required several seconds to recover. The sag and overshoot remained in voltage-clamped cones. Comparison with theory suggests that three mechanisms cause the sag, overshoot, and slow recovery of sensitivity after the light step: a gradual increase in the rate of inactivation of the phototransduction cascade during the light step, residual activity of the transduction cascade after the step is extinguished, and an increase in guanylate cyclase activity during the light step that persists after the light is extinguished.
Introduction
A common feature of sensory systems is their ability to function under widely varying stimulus conditions. Cone photoreceptors, which provide the dominant input to daylight vision, operate over a range of more than one million in mean light intensity. Even within a single visual scene, cones encounter light intensities that vary as much as 10,000-fold (Xiao et al., 2002). To encode these visual inputs effectively, cones must adjust their sensitivity, or adapt, to large changes in illumination.
Visual information is encoded in photoreceptors by a G-protein-coupled signal transduction cascade (for review, see Yau, 1994; Arshavsky et al., 2002) (see Fig. 7). Light absorption by the photopigment (R) triggers the serial activation of multiple G-proteins, causing the amplified stimulation of the enzyme phosphodiesterase (PDE). The activated phosphodiesterase (PDE*) hydrolyzes the second messenger cGMP, causing cGMP-gated channels in the cone outer segment to close, suppressing the circulating current and causing a fall in intracellular Ca2+. The decrease in Ca2+ activates guanylate cyclase, accelerating its rate of cGMP synthesis. This negative feedback counters the light-induced increase in hydrolytic activity, partially restoring the cGMP concentration. Light-activated photopigment (R*) and PDE* are inactivated through a separate series of biochemical reactions. The decrease in circulating current hyperpolarizes the cell and modulates the release of neurotransmitter at the cone output synapse, sending a signal to the rest of the retina.
In rods, many of these biochemical steps appear to be modulated during adaptation (for review, see Fain et al., 2001). Adaptation in cones is less well understood; it is not clear whether the same mechanisms are active and how they affect the function of the cone. Here, cone responses to step increments and decrements in illumination are examined using suction electrode recordings from individual cones. A model of the cone phototransduction cascade is constructed to test specific biochemical mechanisms for adaptation.
Materials and Methods
Preparation of the retina.
Experiments were performed on larval tiger salamander (Charles Sullivan, Nashville, TN) cone photoreceptors as described previously (Rieke and Baylor, 2000). After 3–10 h in darkness, the animal was killed in accordance with procedures approved by the Administrative Panel on Laboratory Animal Care at the University of Washington. The eyes were removed and hemisected under infrared illumination, using infrared/visible converters. The posterior half of each eye was transferred to a Petri dish containing HEPES-buffered Ringer's solution (in mm): 136 NaCl, 2 KCl, 1.6 MgCl2, 2 NaHCO3, 3 HEPES, 0.01 Na2EDTA, and 1.5 CaCl, pH 7.4 (gassed with 100% oxygen). Each eyecup was cut into four to six pieces. The retina from a single piece was removed from the pigment epithelium, transferred to a droplet containing Ringer's solution with ∼1 Kunitz unit of DNase, and manually dissociated using with fine needles. The suspension was transferred to an inverted microscope equipped with an infrared viewing system and allowed 10–15 min to settle to the glass bottom of the recording chamber pretreated with concavalin-A (0.25 mg/ml; in mm: 1 NaCl, 10 HEPES, and 0.1 CaCl2, pH 8.5) to promote cell adhesion. During recording, cells were perfused with bicarbonate buffered Ringer's solution (in mm): 110 NaCl, 2 KCl, 1.6 MgCl, 30 NaHCO3, 0.01 EDTA, and 1.5 CaCl (osmolarity of 260 mOsm, pH 7.4, when equilibrated with 95%O2, 5%CO2, 20–22°C).
Suction electrode recording.
Cone outer segment membrane currents were recorded using a suction electrode (Baylor et al., 1979; Rieke and Baylor, 2000). Isolated cones or cones in small clusters were distinguished from rods by their smaller outer segments and distinct morphology. An individual cone outer segment was drawn into a suction electrode filled with HEPES-buffered Ringer's solution, and the current flowing into the outer segment was measured. Long-wavelength-sensitive (L) cones were identified based on their strong responses to a 595 nm flash of light. Cones with maximal responses <20 pA were rejected. Typical recordings lasted 1–1.5 h, permitting repeated measurements of the response of the cone to long light steps (5–90 s) and systematic characterization of how the sensitivity and kinetics of the cone changed during the light step. Recorded currents were filtered at 1 kHz.
Whole-cell patch-clamp recording.
Whole-cell patch recordings were used to measure the voltage dependence of the cone cGMP-gated channel and inner segment currents. Patch pipettes were filled with an internal solution containing the following (mm): 125 K-aspartate, 1 MgCl2, 10 KCl, 10 HEPES, 5 HEDTA, 0.5 CaCl2, 4 ATP, and 0.5 GTP, pH 7.2 (osmolarity, 260 mOsm). Voltages were corrected for the ∼10 mV liquid junction potential. Isolated L-cones maintained a potential in darkness of −40 ± 9 mV (n = 10). The membrane voltage was ramped from −80 to −30 mV (250 mV/s), and the resulting current was recorded. Voltage ramps were repeated before, during, and after a light step. Light responses in voltage-clamped cells were measured at a holding potential of −70 mV to prevent the activation of voltage-gated Ca2+ channels, which can make whole-cell recordings unstable.
Light stimulus protocols.
Light stimuli were delivered using a light-emitting diode (LED) (Hosfelt Electronics, Steubenville, OH) with peak spectral output at 595 nm. Calibrated photon fluxes (photons per square micrometer per second) were converted to photoisomerizations per second using the LED spectral output, the L-cone spectral sensitivity (Makino et al., 1990), and an effective collecting area of 0.75 μm2. A control voltage from the computer was translated into a high-frequency (>1 kHz) series of frequency-modulated pulses by a voltage-to-frequency converter (Pokorny et al., 2004). Brief (10 ms) flashes were used to measure the dim flash sensitivity of the cell, and saturating flashes (105 photoisomerizations) were delivered periodically to check stability of the dark current. In experiments with steps containing superimposed flashes of varying delays, the delays were randomized. Steps lacking flashes were interspersed at regular intervals so that any drift in the recording would affect them equally, on average. Typically, traces shown are averages of five to six repetitions.
Analysis.
The sag and overshoot of the response to a step of light are defined as shown in Figure 1a. The sag is the difference between the current at the peak of the response and at a point immediately before the termination of the step. The overshoot is the difference between the circulating current before the onset of the step and the maximum current after its offset. Both measures of the step response are expressed as a percentage of the total steady-state dark current.

The sag and overshoot vary as a function of the intensity and duration of the light step. a, Average normalized responses (circulating current/dark current) of salamander cones to 5 s light steps delivering 7.8 × 10³, 1.6 × 10⁴, 3.2 × 10⁴, or 6.5 × 10⁴ photoisomerizations/s. Each trace is the average response of three to six cells to a light step at a single intensity; in each cell, between 19 and 84 trials were averaged together. The sag and overshoot for the largest response (see Materials and Methods) are indicated by the arrows. Inset, The overshoot is plotted as a function of the sag. Each point is the sag and overshoot measured in a single cell. The line is the best-fit linear regression, constrained to intercept the origin. b, The response of a single cone to 13 light steps with the same intensity (1.6 × 10⁵ photoisomerizations/s) but varying in duration from 0.01 to 40 s. All steps begin at time 0, which is not shown because the timescale is logarithmic. c, Sag and overshoot as a function of step duration, for steps longer than 320 ms. Dashed lines are ±SEM (n = 7). The sag and overshoot are expressed as percentage of dark current. d, Overshoot plotted as a function of the sag; data are the same as in c.
The sensitivity of the dim flash response is defined as the peak amplitude of the response divided by the flash strength. In some cases, sensitivity is normalized to that in the dark.
Changes in the dim flash response time course were measured by calculating the weighted duration of the response, defined as follows:
 where t is the time after the light stimulus was delivered, and r(t) is the absolute value of the normalized response as a function of time. This is a measure of the “center of mass” of the response: if the response waveform is a step, the weighted duration of the response is the midpoint of the step. By taking the absolute value of the response, the negative and positive phases of the response are weighted identically. Other measures of response kinetics, i.e., time-to-peak and integration time (Baylor et al., 1979), gave similar qualitative results but were more susceptible to noise.
The raw data were preprocessed and entered into a custom object database written in Mathematica. The dim flash response was fitted with numerical models using standard nonlinear least-squares error minimization algorithms (FindFit routine). Forced parameters were computed using the standard differential equation solver (NDSolve routine). The model (supplemental information, available at www.jneurosci.org as supplemental material) was written as a set of five coupled differential equations and solved using standard differential equation numerical algorithms. The light stimulus was one input to the model, and, in later “forced parameter” analysis, the experimental data were used as another time-varying input.
Results
The experiments that follow investigate the origin of the slow sag in current after light onset and overshoot after light offset and their relationship to changes in the amplitude and kinetics of the dim flash response of the cone. The first half of the paper presents empirical measurements of the step response and changes in the dim flash sensitivity and kinetics during and after the light step. Experiments described indicate that the sag and overshoot are not caused by changes in the initial gain of the phototransduction cascade during the light step or by changes in voltage during the light step. The second half of the paper uses theoretical models of the cone phototransduction cascade to investigate the molecular origin of the sag and overshoot. It begins with a model of the cone phototransduction cascade based on existing models of the rod phototransduction cascade. This model accounts for many of the features of the dim flash and step response but fails to account for the sag and overshoot. This model is then systematically modified to test possible mechanisms for the sag and overshoot.
Empirical characterization of the step response
The sag and overshoot increase with the intensity and duration of the light step but evolve separately over time
The basic phenomenon is shown in Figure 1a, in which an individual cone was exposed to 5 s light steps of varying intensity. At all intensities, the initial suppression of the circulating dark current at light onset was followed by partial recovery (Fig. 1a, sag). The sag continued at a slow rate for steps up to 90 s (data not shown). After the termination of the light step, the circulating current transiently exceeded (overshot) the resting dark level before gradually returning to the original baseline. The sag and overshoot occurred, although the stimulus was constant during the light step. They are unexpected from the monophasic and relatively rapid dim flash response (Fig. 2c, blue trace); if the response to the light step was simply a linear combination of the dim flash responses, the step response would be expected to reach quickly a steady plateau and not overshoot after the light was turned off. Indeed, this is the case when Ca2+ is held fixed (Matthews et al., 1990).

The sensitivity of the cell decreases rapidly when light is turned on and recovers more slowly after the light is extinguished. a, b, Response of the L-cone to the light step by itself (red) and to light steps with superimposed flashes (black). The breaks in the graph indicate jumps in the time axis. Data from early (0–1.2 s) and late (3.6–4.0 s) in the step and after the light is turned off (0–1.2 and 6–7 s) are plotted. The duration and intensities of the step and flash stimuli are as in Figure 3. c, d, The normalized dim flash response (difference between step responses with and without superimposed flashes divided by the strength of the flash) is shown as a function of time. In both panels, the normalized dim flash response in darkness (blue) is shown for comparison.
The size of the step response increased in proportion to the logarithm of the step intensity (Fig. 1a), consistent with previous reports (Matthews et al., 1990). Over the range of step intensities probed, the magnitude of the sag and overshoot were linearly related (Fig. 1a, inset), also consistent with previous work (Nakatani and Yau, 1988). However, the sag and overshoot evolved separately over time. Figure 1b plots the superimposed responses to light exposure ranging in duration from 0.01 to 40 s. The response initially increased with the duration of the stimulus, reaching peak amplitude ∼300 ms after light onset for stimuli lasting 160 ms or longer. After reaching a peak, the response slowly declined for the duration of the stimulus. The overshoot after light offset became prominent only for steps exceeding a few seconds in duration. Figure 1c plots the magnitude of the sag and overshoot against the step duration. The sag and overshoot had different dependencies on step duration, with the sag initially increasing rapidly with step duration and the overshoot increasing slowly. Figure 1d plots the overshoot against the sag. If the sag and overshoot depended similarly on step duration, the points would fall along a straight line. The failure of this simple prediction indicates that the sag and overshoot do not reflect the activation and inactivation of a single mechanism, e.g., a current that is activated during the step and lingers after the light is extinguished.
Changes in sensitivity and kinetics during the sag and overshoot
How the slow sag and overshoot affect the sensitivity and kinetics of the phototransduction cascade is not known. Depending on the mechanism for the sag and overshoot, the sensitivity and kinetics of the cascade may be affected strongly, or not at all. Previous studies in rods assume that the sag in circulating current during a light step corresponds to a decrease in dim flash sensitivity (Calvert et al., 2002), but it is not clear that this is assumption is valid in cones.
To measure the sensitivity and kinetics of the phototransduction cascade during the light step, dim flashes were delivered at varying times during and after a 5 s step that suppressed 50–70% of the dark current (Fig. 2) and bleached ∼0.3% of the cone photopigment. The delay of the first flash after the onset and offset of the step was varied in each trial (Fig. 2, stimulus monitor). The strength of the test flashes was adjusted so that the response was large enough to measure but suppressed <20% of the circulating current. Under these conditions, responses scale linearly with the flash strength (data not shown), permitting sensitivity to be estimated by dividing the response by the flash strength.
The suppression of circulating current after step onset was accompanied by a rapid decrease in the sensitivity and duration of the dim flash response. This is illustrated in Figure 2a, which shows the cone step response without (red trace) and with (black traces) superimposed dim test flashes at the beginning and toward the end of the 5 s stimulus. Figure 2c shows the flash responses (with step response subtracted), divided by the strength of the flash. Flashes at the start of the light step (Δt = 0 ms) produced smaller and faster responses than flashes presented in darkness (blue trace). Responses to test flashes reached a constant size for Δt = 320–640 ms. The sensitivity and kinetics of the test responses recovered gradually after the termination of light step, taking several seconds to recover fully to the dark-adapted condition (Fig. 2d). During this time, the current transiently overshot its dark level (Fig. 2b).
Figure 3 summarizes the changes in circulating current, dim flash sensitivity, and weighted duration at several times during and after 5 s steps of four intensities. Each trace is the average of 7–10 trials from four to six cells. For all step intensities, the sag began after 300–700 ms and continued until the light was extinguished (Fig. 3a). The dim flash sensitivity declined during the initial decrease in current and remained nearly constant during the sag (Fig. 3c). The dimmest step intensity produced a small, transient increase in sensitivity for the first flashes after step onset (Fig. 3c, top traces).

The changes in circulating current, sensitivity, and kinetics depend strongly on the intensity of the light step. a, Circulating current in response to 5 s light steps delivering 7.8 × 10³, 1.6 × 10⁴, 3.2 × 10⁶, or 6.5 × 10⁴ photoisomerizations/s. Each trace is the average response of four to six cells; error bars indicate ±SEM. The circulating current is measured at the time of the flash and expressed as a fraction of the dark current. b, The circulating current of the last response before the end of the step (Δt = 3.6 s) as a function of the intensity of the light step. Error bars are ±SEM (n = 4–6). Lines are fit to a Hill-type function with n = 0.6 and km = 1.1 × 10⁵. c, Sensitivity of the cell during and after the light step, normalized by the sensitivity in darkness. Points are plotted according to the time of the flash. d, Sensitivity of the response to the last flash before the end of the step as a function of the intensity of the light step, fitted with a Weber-type function (I0 = 9.8 × 10⁴). e, Weighted duration (see Materials and Methods) of the response, normalized by the duration in darkness. f, Weighted duration of response to last flash before the end of the step as a function of step intensity.
Figure 3, b and d, plots the dependence of circulating current and sensitivity (measured at 3.6 s) on step intensity. The decrease in sensitivity was fit by a Weber function with a half-maximal sensitivity of I0 = 105 photoisomerizations/s (Fig. 3d), consistent with other reports (Matthews et al., 1990).
At step onset, the weighted duration of the dim flash response (see Materials and Methods) decreased by 45–80% compared with its value in darkness (Fig. 3e). The weighted duration then partially recovered for all but the dimmest step. For all step intensities, the weighted duration recovered abruptly at the termination of the step to an intermediate level and then subsequently recovered to its dark value over several seconds. Figure 3f shows the intensity dependence of the weighted duration of the response to the last flash before light offset.
In summary, the dim flash response rapidly becomes smaller and faster after light onset. The recovery after light offset is, in comparison, relatively prolonged: the dim flash response requires several seconds to return to its dark amplitude and speed. These changes do not bear a simple relationship to the slow changes in circulating current.
Background does not affect the rising phase of the response
Background light could cause the dim flash response to become smaller through several mechanisms: (1) by decreasing the early amplification of the phototransduction cascade; (2) by increasing the strength of the negative feedback loop that follows the change in current with a brief delay (Hodgkin and Nunn, 1988); or (3) by speeding the shutoff of the photopigment or its downstream activation products. The first mechanism predicts a slowing of the initial rising phase of the flash response (Gray-Keller and Detwiler, 1994; Lagnado and Baylor, 1994), whereas the second and third act only after a delay and thus leave the initial part the flash response unaltered (Lamb and Pugh, 1992; Nikonov et al., 2000).
The onset of the dim flash response is normally obscured by noise. To obtain a reliable estimate of the response onset, composite dim flash response estimates were calculated by averaging together sections of the normalized responses to a series of dim and bright flashes (Baylor et al., 1979). Figure 4a illustrates this procedure. It shows the cone response family to 10 ms flashes of eight different strengths. Each trace is the average of 15–35 trials. Figure 4b shows two responses (black traces) on an expanded scale. Points outside the linear response range, i.e., in which >20% of the dark current was suppressed, were discarded (gray triangles and circles), and the remaining points were scaled by flash strength. Sections of each response in which <20% of the dark current was suppressed (Fig. 4c, black) fall along a common trajectory, whereas the discarded points (gray) “peel off” from the common trajectory as the brighter responses begin to saturate. The traces are in reverse order from Figure 4a because they are normalized by flash strength: responses to the brightest flashes peel off first, followed by responses to dimmer flashes. The solid and dashed lines plot the average ± SEM of the included points.

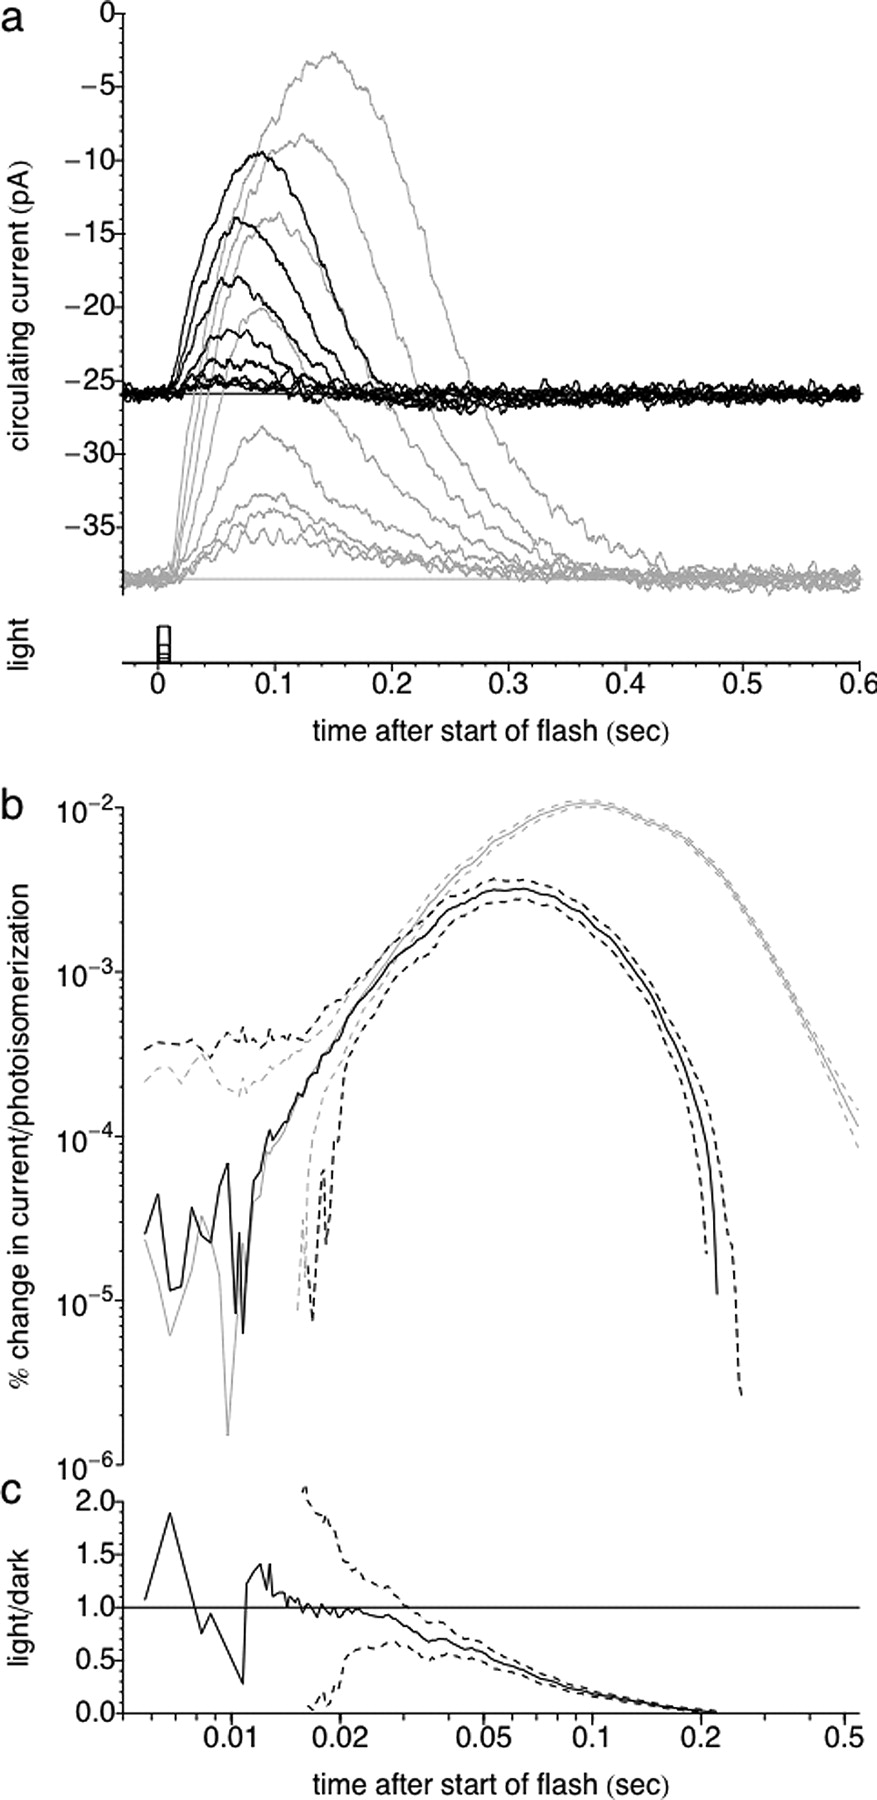
The rising phase of the dim flash response can be measured by averaging together multiple responses to different light intensities. a, Responses of an L-cone to 10 ms flashes delivering 5 × 10², 7.5 × 10², 1 × 10³, 2 × 10³, 5 × 10³, 1 × 10⁴, 2 × 10⁴, or 4 × 10⁴ photoisomerizations. Each trace is the average of 15–35 responses. Two representative responses are highlighted in black. b, Representative responses to flashes delivering 2 × 10³ and 4 × 10⁴ photoisomerizations on an expanded timescale. Individual sample points are plotted for clarity. The dashed line indicates the threshold at which 20% of the dark current is suppressed; the gray points are excluded from additional analysis. c, All eight responses, normalized by flash strength, plotted on double-logarithmic coordinates. Black points are included in the average; gray points are excluded. The solid trace is the weighted average of all points that were included; dashed traces are ±SEM. Data were binned in equal time bins on the logarithmic scale, so at early times each bin contains as few as eight points, and at late times bins contain as many as 400 points.
To determine whether adaptation affected the initial rising phase of the flash response, the procedure of Figure 4 was repeated for responses measured in the presence and absence of background light (Fig. 5a). Figure 5b shows composite dim flash responses averaged across cells in darkness (gray trace) and in background light (black trace). The peak amplitude of the dim flash responses in the presence of background light was approximately one-third the amplitude in the dark, with the peak occurring 50 ms earlier. Despite the large difference in response amplitude and kinetics, the initial part of the responses in darkness and in background light follows a common trajectory until ∼25 ms after the presentation of the flash. Correspondingly, the ratio between the dark and light responses (Fig. 5c) begins near unity and deviates significantly (i.e., 1 SEM) from unity at 35 ms. This is close to the faster of two measured Na+:Ca2+, K+ exchanger time constants in salamander L-cones [∼43 ms (Sampath et al., 1999)] and is a measure of when Ca2+-dependent negative feedback is likely to become significant. Thus, the early amplification of the cone transduction cascade was not noticeably affected by background light; instead, adaptation was dominated by later stages: either more rapid shutoff of the amplifying steps in the cascade or an increased strength of negative feedback.

The initial rising phase of dim flash responses in background light follows the same trajectory as responses to dim flashes in darkness. a, Responses of L-cone in darkness (gray) and on a steady background of 1.3 × 10⁵ photons/s (black) to a family of 10 ms flashes. Flash strengths and average number of responses per trace are as in Figure 4. b, Average dim flash response of five cells; gray is response in darkness, and black is response in background light. The dim flash response for individual cells was calculated using the procedure described in Figure 4, normalized by the baseline circulating current, and averaged. c, Ratio of response in light divided by response in dark as a function of time. Mean ± SEM is shown (n = 5).
The sag and overshoot are present in voltage-clamped cones
Unlike rod cGMP-gated channels (Baylor and Nunn, 1986), the current through cone cGMP-gated channels depends on membrane voltage in the physiological range (Rieke and Schwartz, 1994; Rebrik et al., 2000). The sag and overshoot in the outer segment current could therefore be caused by a slow change in the membrane voltage of the cone over the course of the light step. Hyperpolarization during the light step, for instance, would increase the driving force across the cGMP-gated channel, causing an increase in the circulating current. Such a mechanism predicts that the sag and overshoot would be eliminated by holding the cone voltage fixed. This was not the case. Figure 6a shows step responses of an L-cone voltage clamped at −70 mV; the sag and overshoot persisted without changes in cone voltage.

The sag and overshoot are present in a voltage-clamped cell. The cone inner segment and cGMP channel I–V curves are approximately linear over the physiological range of voltages. a, Response of a voltage-clamped L-cone to light steps delivering 4.1 × 10⁴ and 8.8 × 10⁵ photoisomerizations/s. The cone was held at −70 mV. b, Response of an L-cone to combined voltage ramps (250 mV/s) and 6 s light step delivering 1.3 × 10³ photoisomerizations/s. c, Averaged responses of cone to voltage ramp in darkness (solid trace) and during the light step (dashed trace). d, Average I–V curve for L-cone in darkness (solid trace) and in light (dashed traces). The thin traces are the responses to the rising and falling phases, and the dark lines are the average of both rising and falling phases. e, The light induced normalized difference in current (current in light − current in darkness)/difference at −80 mV for 11 cells, as a function of voltage. Thick trace is the average over all cells.
Molecular mechanism of adaptation
The cone inner segment and cGMP-gated channel I–V curves are approximately linear over the physiological range
Because current through cone cGMP-gated channels is voltage dependent, models of the phototransduction process must consider the change in membrane potential that occurs during the cone light response. Figure 6b–e illustrates measurement of the voltage dependence of the cGMP-gated channel and the current–voltage relationship of the inner segment. A voltage-clamped L-cone was held at −50 mV (Fig. 6b) while the voltage was ramped from −80 to −30 mV and back. This voltage range includes the physiological range of cone voltages. Current responses to voltage ramps were measured before, during, and after a light step (Fig. 6b). Figure 6c shows average current responses in the dark (solid trace) and light (dashed trace). Light closed cGMP-gated channels in the cone outer segment, reducing the current at all voltages. Figure 6d plots the ramp responses from Figure 6c as a current–voltage relation.
The light–dark difference in the current in Figure 6d measures the voltage dependence of current flow through cGMP channels. Figure 6e collects such measurements for 11 cones; the cGMP channel current had a near-linear dependence on voltage between −80 and −30 mV, unlike the lack of voltage dependence of the rod cGMP current over this voltage range (Baylor and Nunn, 1986).
The entire inner segment current, not only the light-dependent component, depended near-linearly on voltage over the physiological range (approximately −40 to −70 mV) (Fig. 6d). Thus, for voltage ramps, the L-cone inner segment behaves electrically like a simple resistor, and, more generally, the inner segment can be approximated as a parallel resistance–capacitance (RC) circuit (Perry and McNaughton, 1991). Comparison of voltage-clamped (in which there is no capacitance contribution) and current-clamped light responses showed that the RC filter time constant was ∼25 ms (data not shown). This time constant is consistent with the measured resistance (∼400 mΩ) and capacitance (∼60 pF) and is in agreement with reported values (59 pF, 45 ms median time constant) (Perry and McNaughton, 1991).
All models used the voltage dependence of the cGMP current from Figure 6e and assumed a dark resting potential of −40 mV (supplemental information, available at www.jneurosci.org as supplemental material). The model behavior was not sensitive to the value of the membrane time constant, the choice of dark resting potential, the slope of the inner segment current–voltage relationship, or the slope of the cGMP-gated channel current–voltage relationship.
A model of cone phototransduction
To understand what mechanisms could cause adaptation, the experimental data were compared with the predictions of a mathematical model of the cone phototransduction cascade that included standard elements used in previous models of cone (Sneyd and Tranchina, 1989; Tranchina et al., 1991) and rod (Forti et al., 1989; Sneyd and Tranchina, 1989; Tranchina et al., 1991; Lamb and Pugh, 1992; Detwiler et al., 2000; Hamer, 2000; Nikonov et al., 2000; Korenbrot and Rebrik, 2002) phototransduction, as well as cone-specific elements. The model, which consists of five coupled differential equations, is shown in the right panel of Figure 7. Included in the model is a linear G-protein-mediated amplification stage (Fig. 7, steps 1 and 2), cGMP synthesis and hydrolysis reactions (step 3), cGMP-sensitive ion channels (step 4), and Na+:Ca2+, K+ exchanger kinetics (step 5). Cone-specific elements included the voltage dependence of cone cGMP-gated channel currents and inner segment electrical properties discussed in the previous section (step 6). The output of the model is the current carried by the cGMP-gated channels (I), which is measured by the suction electrode. A more detailed description of the model is presented in supplemental information (available at www.jneurosci.org as supplemental material).

The phototransduction cascade and model. 1, Light converts an inactive molecule of photopigment (R) to an active form (R*); the active molecule inactivates at rate βr and also spontaneously activates at rate Rdark. 2, Activated photopigment converts PDE to its active form (PDE*) at a rate vr per active R*; PDE* inactivates at rate βpde. 3, The concentration of cGMP depends on the difference between synthesis of cGMP by guanylate cyclase (first term) and hydrolysis by PDE*. The rate of synthesis is inversely dependent on the concentration of Ca2+ with maximal rate vcyc and sensitivity kcyc and Hill coefficient ncyc. The rate of hydrolysis is dependent on the product of PDE* and cGMP concentrations and scaled by the specific activity of a single PDE* molecule (vpde). 4, The cGMP-gated channels open cooperatively with increasing cGMP concentration. The open probability popen is modeled as approximation of a Hill-type dependence with Hill coefficient nchn and sensitivity kchn valid for cGMP ≪ kchn. 5, The concentration of Ca2+ depends on the difference between influx through the cGMP-gated channels and extrusion by the Na+:Ca2+,K+ exchanger. The total change in calcium includes the approximately linear dependence of the current carried by the channel (Ichn) on membrane voltage (Vm) and a scaling factor γin. The rate of Ca2+ extrusion is first order with Ca2+ concentration with rate constant βexch. 6, The electrical characteristics of the cone are modeled as an RC circuit, with membrane capacitance Cis, input current from the cGMP-gated channels Ichn, and linear leak current Ileak. Both Ichn and Ileak are approximately linear with voltage and are derived from measurements described in Results.
The model has seven fixed and six free parameters (Table 1). The free parameters were fitted to the dark-adapted dim flash responses of individual cells and the adaptational properties of the resulting model studied. The predicted flash responses during and after the light step are smaller in amplitude and slower to recover than the measured responses (Fig. 8c,d). The model also fails to reproduce the waveform of the step response (Fig. 8a). At the onset of a step of light, the model response quickly reaches a constant steady-state current, which does not sag over time, and, after the light is extinguished, the model current recovers monotonically to the resting dark current without the transient overshoot characteristic of the observed step response. These shortcomings are consistent across cells and step intensities (data not shown).
Fixed and free parameters in the phototransduction cascade model

A model without a slowly changing component fails to predict the observed changes in circulating current and sensitivity during the light step. a, b, The model response (black traces) to step and flash stimulus diverges from the measured response to the light step alone (gray trace). The timescale and light stimulus are indicated at the bottom. The duration and intensity of the light steps and flashes are as in Figure 3. c, d, Normalized dim flash responses for model (black) and data (gray) to flashes superimposed on the light step. The dashed trace in both panels is the response to a dim flash presented in darkness; the overlying solid trace is the model fit to the dim flash response.
The failure of the model to fit the sag and overshoot of the step response is not surprising because these features of the response evolve slowly compared with the known time constants of the cone transduction cascade, i.e., ∼50 ms for Ca2+ changes (Sampath et al., 1999), 250–500 ms for turnover of the cGMP pool (Cornwall et al., 1995; Corson et al., 2000), and a time-to-peak of 150 ms for the cone dim flash response (Fig. 2c).
Force fitting the model to the waveform of the step response
The sag and overshoot of the step response can be explained most simply by a gradual change in the activity of a single element in transduction cascade that occurs over the course of the light step and persists for a short time after the step is turned off. In principle, such a slow change in any of the 13 parameters in the model (supplemental information, available at www.jneurosci.org as supplemental material) could account for the waveform of the step response. Two of these, the dark activity of photopigment (rdark) and a shift in membrane voltage, can be ruled out. First, to account for the sag, rdark would have to become negative, which is not possible. Second, the sag and overshoot persisted when the cone voltage was held fixed (Fig. 8a), inconsistent with an explanation based on a shift in membrane voltage.
The remaining eleven parameters can be divided into four categories that affect (1) the activation rate of the amplification stages of the cascade (vr and vpde), (2) the inactivation rate of the cascade (βr and βpde), (3) the strength of feedback by guanylate cyclase (kcyc, vcyc, ncyc, kchn, nchn, and kin), and (4) the speed of Ca2+ feedback (βexch). The difference between the recorded step response and one predicted by the model was used to calculate how each of four representative parameters (vpde, βpde, kcyc, and βexch) would have to change over time to account for the sag and overshoot (for details, see supplemental information, available at www.jneurosci.org as supplemental material). The other parameters in each category produce similar effects if allowed to vary (data not shown). Slow modulation of the initial amplification is considered for completeness, although the invariance of the initial rising phase of the flash response indicates that these parameters (vr and vpde) are unaffected by background light.
To match the waveform of the step response, βpde (or equivalently, βr) must gradually increase to approximately three times its dark rate during the course of the step and remain elevated for a short period after the light is turned off (for details, see supplemental information, available at www.jneurosci.org as supplemental material). In this model, the increase in the inactivation rate (through either an increase in βpde or βr) causes a decrease in hydrolysis, leading to an increase in cGMP and circulating current during the step. After the light is turned off, the increase in inactivation rate persists, causing PDE* to fall below the level normally maintained in the dark by the basal activity of the photopigment (rdark). The low PDE* activity after the light is turned off causes the cGMP concentration to exceed its level in darkness and the circulating current to overshoot. Similar force fit calculations for each of the other representative parameters can be summarized as follows: the Na+:Ca2+, K+ exchanger rate constant βexch must accelerate twofold, the rate at which individual PDE* molecules hydrolyze cGMP, vpde (or equivalently, vr) must decrease during the light step approximately threefold, and the parameter controlling the Ca2+ sensitivity of the rate of cGMP production, kcyc, must increase twofold.
Only an increase in the inactivation rate cascade can cause the observed acceleration in the kinetics of light-adapted dim flash response
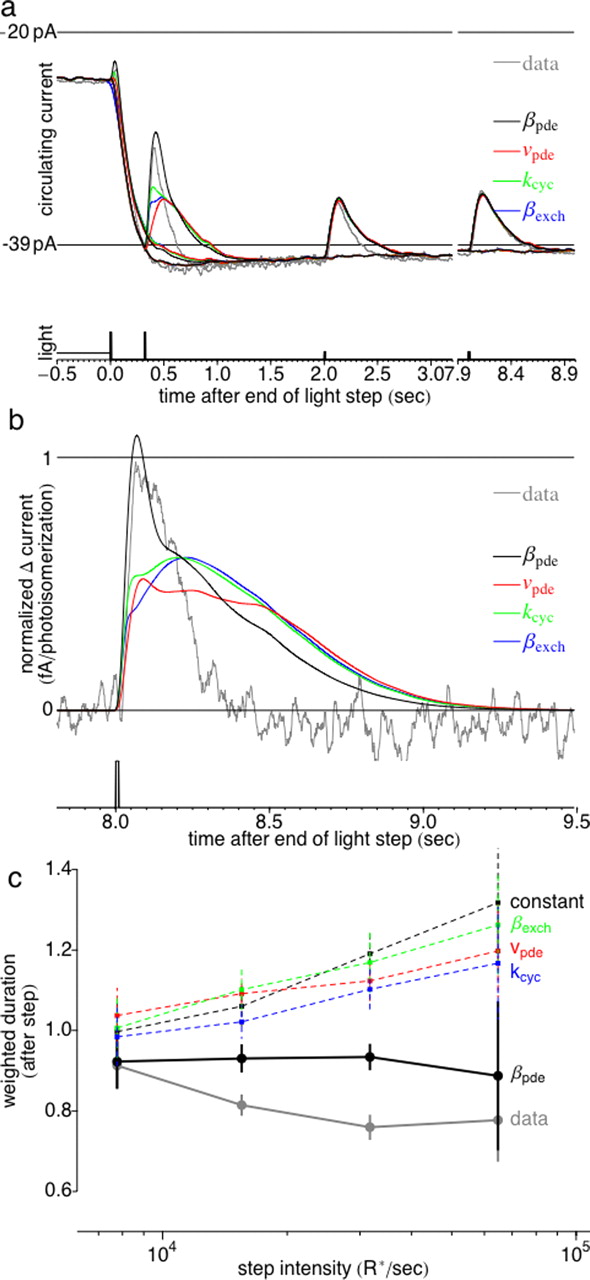
Figure 9 compares the amplitude and time course of the adapted flash response for the four models described in the previous section, assuming that each of the parameters changes over time as required to fit the measured waveform of the step response. As illustrated in Figure 9a, the model responses in which an increase in βpde is responsible for the sag match the experimentally measured responses more closely than the responses of other models. Figure 9c summarizes the changes in kinetics for each model by plotting the weighted duration of the last flash response before the light is extinguished for each model and experiment. Only the model in which βpde changes (black trace) matches the speeding of the response kinetics observed experimentally.

A slow increase in βpde during the light step accounts for the increase in circulating current and acceleration of dim flash kinetics. a, Force-fit model step responses (black, red, green, and blue traces) compared with experimentally measured response (gray). Light stimulus is as in previous figures. b, Normalized response to the last dim flash on the step (Δt = 3.64 s) before the step is turned off, with response to step alone subtracted. c, Average weighted duration of the response to the last dim flash (steady-state response) as a function of the intensity of the light step. The model without any slow adaptation (black dashed trace) is included for comparison.
The unique ability of βpde (or equivalently, βr) to speed the responses can be explained in the following way. In the dark, the cGMP pool is completely synthesized and hydrolyzed (“turned over”) at least five times per second ((Estevez et al., 2006). The average in the models is 7.2 ± 3.4 s−1, mean ± SD), which is comparable with the model PDE* decay rate (5.2 ± 2.0 s−1, Table 1). Thus, both inactivation of PDE* and the synthesis of cGMP contribute to the time course of the recovery of the dim flash response in darkness. In light, however, the cGMP turnover rate increases to >40 s−1 (Estevez et al., 2006) (also consistent with model estimates), which makes the inactivation of the cascade rate limiting for the recovery of the adapted flash response. If the sag is caused by a gradual acceleration in βpde or βr over time, the recovery of the dim flash response should become faster, as seen in the measured dim flash responses (Fig. 9c). If the sag is caused only by a change in parameters in any of the other three categories (e.g., vpde, kcyc, and βexch), the decay of the dim flash response should be unchanged.
The model predictions of the slope of the initial rising phase, time-to-peak, and peak amplitude of the dim flash response vary as expected. The rising phase of the response in which vpde decreases is shallower than in all of the other models because of the decrease in initial gain. The “notch” after the peak of the response attributable to ringing in the Ca2+ feedback loop (Schnapf et al., 1990) is earlier in the model in which βexch is accelerated. In the model in which kcyc increases, the peak of the response is shifted to earlier times because the cGMP turnover rate is accelerated, causing the response to be attenuated at earlier times by negative feedback. This also explains why the response of the model in which βpde is accelerated is larger than the others: in this model, the turnover rate of cGMP slows during the sag, and so the dim flash response grows larger before it is attenuated by negative feedback.
The responses to dim flashes after the light is turned off are smaller and faster than expected
None of the models reproduced the prolonged acceleration of dim flash kinetics after the light was turned off (Fig. 10). The experimentally measured dim flash responses after the light is turned off are always faster than the dim flash response in the dark (weighted duration <1) (Fig. 10c, gray trace). In contrast, all of the models except for βpde predict that the responses after the light is turned off become slower than in the dark (weighted duration >1; red, green, and blue traces). The discrepancy persists for several seconds after the light is extinguished and is larger for brighter light steps. For clarity, the response to the first flash immediately after step offset, with the waveform of the step response subtracted, is shown in Figure 10b. All of the models predict that the decay phase of the dim flash response has a long “tail” (black, red, green, and blue traces) not present in the experimentally measured response (gray trace). The model in which βpde changes slowly over time (black trace) has a large initial transient but still has a long tail.

All models fail to account for the prolonged acceleration of the dim flash response after the light is turned off. a, Force-fit model responses after the light step is turned off (black, red, green, and blue traces) compared with experimentally measured response (gray). Light stimulus is as in previous figures. b, Normalized response to the first dim flash after step offset (Δt = 0 s). c, Average weighted duration of the response to first dim flash after step offset as a function of the intensity of the light step, normalized by the weighted duration of the response in darkness. Data responses are always faster than the response in darkness (weighted duration <1), whereas all model responses are slower than response in darkness (weighted duration >1). The model without any adaptation (black dashed trace) is included for comparison.
These results demonstrate that models in which a single mechanism causes both the sag and the overshoot cannot fully explain the dynamics of recovery after the light is turned off. Instead, an additional mechanism or mechanisms must prolong the recovery of dim flash response kinetics after light offset.
Discussion
The cone response to step changes in light intensity suggests that at least three adaptive mechanisms are activated by prolonged exposure to light. The first mechanism is the acceleration of inactivation of the phototransduction cascade during light exposure. A model in which the inactivation rate of PDE* (or equivalently, R*) accelerates over time explains the slow, continuous recovery of circulating current as well the changes in dim flash kinetics during the light step. This model did not explain, however, the relatively slow recovery of dim flash kinetics or the overshoot in circulating current after the light was turned off.
Two additional mechanisms (elevated guanylate cyclase and residual PDE* activity) acting in concert are required to explain the acceleration of dim flash kinetics and the overshoot in circulating current after the light is turned off. An elevation of guanylate cyclase activity after light offset would by itself cause an overshoot in current but not the accelerated flash response kinetics. Conversely, residual PDE* activity after the light is extinguished could cause prolonged acceleration of dim flash kinetics but would, by itself, suppress the circulating current. The change in dim flash kinetics and the overshoot in current could be explained, however, if the guanylate cyclase activity after the step is elevated sufficiently to overwhelm the residual PDE* activity, causing the overshoot in circulating current.
Although all three mechanisms may be activated by exposure to light, their effects on the light response are manifested at different times during the step response. During the light step, the model suggests that inactivation of the phototransduction cascade dominates the decay kinetics of the dim flash response. According to the model, during light steps, PDE* is highly activated, and the cone is kept out of saturation by a corresponding increase in the activity of guanylate cyclase. The resulting rapid turnover of cGMP attributable to the acceleration of both synthesis and hydrolysis means that, at any moment, the cGMP concentration closely tracks the activity of PDE*, as has been proposed in rods exposed to background light (Nikonov et al., 2000). Under these conditions, the decay of the dim flash response is limited by the inactivation rate of the cascade (through inactivation of the photopigment, or PDE* itself) and is insensitive to small changes in guanylate cyclase and PDE* activity.
After the light is turned off, the acceleration of guanylate cyclase activity and residual PDE* activity dominate the dim flash response kinetics. Turning the light off causes the light-driven activity of PDE* to decay rapidly but not completely to its dark value. This residual activity can be thought of as a “dark light” that maintains the cone in a state of slight light adaptation, less than during the light step but more than in darkness. Under these conditions, the rate at which guanylate cyclase replaces the cGMP hydrolyzed after a brief flash of light is sufficiently slowed so that it becomes rate limiting in the decay of the dim flash response, so that the dim flash kinetics are relatively insensitive to changes in the inactivation rate of PDE*.
The residual activity of PDE* after the light step is turned off may be caused by the activity of Meta II-like decay products of the activated cone photopigment. It has been proposed that, for light exposures in which >0.1% of the cone photopigment is bleached, the Meta II decay product may be rate limiting in the decay of photopigment activity (Estevez et al., 2006) and that this activity decays in 6–10 s. This is consistent with the multi-second timescales of recovery seen here (Fig. 2e) and the level of photopigment bleach for steps that produce substantial overshoots (Fig. 1b).
A competitive interaction between residual activation of PDE* and acceleration of guanylate cyclase activity can explain why some light stimuli produce overshoots (our study; Nakatani and Yau, 1988), whereas others cause current suppression for several seconds after the light is extinguished (Estevez et al., 2006). During brief intense bleaching light steps (Estevez et al., 2006), residual PDE* activity dominates the recovery of the response and no overshoots are produced. During longer light steps, however, the guanylate cyclase activity is upregulated and steadily increases over time. The slow change in cyclase activity could be caused by several mechanisms: (1) desensitization of the guanylate cyclase to suppression by Ca2+; (2) a decrease in the concentration of intracellular Ca2+ caused by a change in the Na+:Ca2+, K+ exchanger; or (3) a decrease in the Ca2+ flux through the cGMP-gated channels. If the light step is sufficiently long and dim, the increased cyclase activity overwhelms the residual activation of PDE*, giving rise to an overshoot at the termination of the step. Slow sensitization of guanylate cyclase activity is also consistent with the slow evolution of the overshoot as the duration of the light step is increased (Fig. 1c).
Rod and cone adaptation
Although the sag and overshoot have been observed previously in rods and cones (Nakatani and Yau, 1988; Matthews et al., 1990; Schnapf et al., 1990; Koutalos et al., 1995; Nikonov et al., 2000; Calvert et al., 2002; Dunn et al., 2007), their relationship to changes in dim flash response amplitude and kinetics has not been systematically examined. In rods, the slow sag in circulating current during the light step has been interpreted as a decrease in sensitivity during the step response (Calvert et al., 2002). Contrary to this view, speeding of PDE* inactivation during the sag is expected to increase the peak dim flash response amplitude and accelerate the response over that expected if the sag did not occur (Fig. 8). This is because the speeding of PDE* inactivation causes a decrease in the average PDE* activity and a slowing of guanylate cyclase feedback, allowing the dim flash response to grow larger before being attenuated. In this sense, the sag is associated with an increase, rather than a decrease, in the sensitivity of the cell.
Existing reports suggest that the inactivation rate of rhodopsin or PDE* are accelerated by exposure to light in salamander (Nikonov et al., 2000) and mouse (Krispel et al., 2003) rods, respectively. Our measurements cannot, by themselves, distinguish whether the inactivation rate of PDE*, the photopigment, or both increase during light exposure. Our measurements do suggest that the rate-limiting step of inactivation is also responsible for the sag in circulating current. This is true only during the light step; in darkness, the feedback from the guanylate cyclase slows and becomes rate limiting. The mechanism for the increase in inactivation rate is not known. In rods and cones, the sag is abolished if the intracellular Ca2+ is held fixed (Nakatani and Yau, 1988; Matthews et al., 1990; Koutalos et al., 1995), indicating that the mechanism is Ca2+ dependent. In mouse rods, the acceleration of dim flash kinetics during light steps is abolished by removal of phosphorylation sites on the γ subunit of PDE (Fain et al., 2007), indicating that inactivation rate of PDE* may be controlled through phosphorylation.
How adaptation in the cone is related to visual behavior is poorly understood. Adaptation in the cone occurs on multiple timescales, with different mechanisms governing the dynamics of adaptation after light increments and decrements. Light adaptation in human observers also occurs over multiple timescales and is also strongly asymmetric with respect to light increments and decrements (Crawford, 1947; Poot et al., 1997). Beyond these superficial similarities, however, little is known about how specific physiological phenomena in the cone are propagated downstream of the photoreceptor and affect performance of the visual system. For instance, during light adaptation, the initial response of the cone to a light increment remains constant, whereas the initial response to a light decrement should become more rapid. Whether this change in sensitivity to light decrements is also found in bipolar and ganglion cell responses is not known.


