
Abstract
Astrocytes provide the glutamine required by neurons to synthesize glutamate and GABA. However, the mechanisms involved in glutamine transfer from glia to neurons have remained poorly understood. Recent work has implicated the System N transporter SN1 in the efflux of glutamine from astrocytes and the very closely related System A transporters SA1 and SA2 in glutamine uptake by neurons. To understand how these closely related proteins mediate flux in different directions, we have examined their ionic coupling. In contrast to the electroneutral exchange of H+ for Na+ and neutral amino acid catalyzed by SN1, we now show that SA1 and SA2 do not couple H+ movement to amino acid flux. As a result, SA1 and SA2 are electrogenic and do not mediate flux reversal as readily as SN1. Differences between System N and A transporters in coupling to H+ thus contribute to the delivery of glutamine from glia to neurons. Nonetheless, although they are not transported, H+ inhibit SA1 and SA2 by competing with Na+.
- glutamine-glutamate cycle
- system A
- system N
- glutamine
- synaptic transmission
- H+ coupling
The large amounts of neurotransmitter stored in synaptic vesicles and the high rates of exocytotic release observed at many synapses require mechanisms to recycle the released transmitter. Considered primarily to terminate signaling at the synapse, Na+-dependent reuptake also recycles many classical transmitters (Amara et al., 1993;Kanner, 1994). Indeed, targeted disruption of the dopamine transporter gene in mice drastically reduces brain dopamine storage and release (Giros et al., 1996; Jones et al., 1998). Related neuronal transporters for monoamines, GABA and glycine apparently have a similar role in transmitter recycling (Roux and Supplisson, 2000). However, the plasma membrane transporters for glutamate belong to a distinct family of proteins (Kanai and Hediger, 1992; Pines et al., 1992; Storck et al., 1992) that generally reside either on astrocytes or, if expressed by neurons, are postsynaptic rather than on the nerve terminal (Rothstein et al., 1994; Chaudhry et al., 1995).
Excitatory synapses have been proposed to recycle glutamate indirectly. Glutamate can be produced from the carboxylation of pyruvate or the transamination of α-ketoglutarate (Hassel and Brâthe, 2000;Lieth et al., 2001), but most of the glutamate used as excitatory transmitter in the brain derives from glutamine (Hamberger et al., 1979; Broman et al., 2000). After release from the nerve terminal, glutamate accumulates in astrocytes through the action of known transporters (Rothstein et al., 1994; Chaudhry et al., 1995). Inside astrocytes, the glutamine synthetase expressed in glial processes (Martinez-Hernandez et al., 1977; Derouiche and Frotscher, 1991) converts glutamate to glutamine (Rothstein and Tabakoff, 1984). Glutamine then exits glia and reappears in neurons before conversion back to glutamate by glutaminase (Conti and Minelli, 1994; Pow and Crook, 1996). Because GABA derives from the decarboxylation of glutamate, inhibitory neurons also appear to rely on the glutamine–glutamate cycle for transmitter biosynthesis (Pow and Robinson, 1994). However, the mechanisms responsible for glutamine transfer from astrocyte to neuron have remained less well understood.
Recent work has implicated the protein responsible for classical amino acid transport System N (SN1) in glutamine efflux from astrocytes (Chaudhry et al., 1999). Although System N was originally characterized as a Na+-dependent uptake activity sensitive to inhibition by low pH, the analysis of intracellular pH (pHi) showed that SN1 also acts as a H+ exchanger (Chaudhry et al., 1999). In addition, SN1 appears to mediate flux reversal induced simply by the removal of external glutamine, and the electroneutrality conferred by H+ exchange may contribute to the ease of flux reversal (Chaudhry et al., 1999). Together with its expression on astrocytes, these observations suggest that SN1 confers the efflux of glutamine from glia required to sustain the glutamine–glutamate cycle. SN1 also shows strong sequence similarity to the proteins responsible for another classical amino acid transport system, System A (Reimer et al., 2000; Sugawara et al., 2000; Varoqui et al., 2000; Yao et al., 2000).
We now report that two System A transporters, although related to SN1, have the properties required to generate steeper concentration gradients required for the uptake of glutamine by neurons. Similar to SN1, uptake by SA1 [also known as SAT2 or ATA2 (Sugawara et al., 2000;Yao et al., 2000)] and SA2 [also known as GlnT or ATA1 (Varoqui et al., 2000; Wang et al., 2000)] is inhibited by low pH, but unlike SN1, the System A transporters do not couple H+translocation to amino acid flux. As a result, transport by SA1 and SA2 is electrogenic rather than electroneutral, and the coupled currents do not reverse at resting membrane potential. We also show that H+ competitively inhibit the activation of SA1 and SA2 by Na+. Furthermore, we have recorded membrane potential changes in hippocampal neurons with the properties of SA1 and SA2, supporting their role in the uptake of glutamine by neurons required to sustain the glutamine–glutamate cycle.
MATERIALS AND METHODS
CDNA cloning of SA2. A fragment of the EST sequenceAA190522 was amplified by PCR from fetal human brain cDNA and used to screen a rat brain cDNA library (Chaudhry et al., 1999). Sequence analysis indicated that one cDNA contained the entire open reading frame with an additional 140 bp 5′ untranslated region (UTR) and an 820 bp 3′ UTR.
Northern analysis and in situ hybridization.Poly(A+) RNA prepared from multiple rat tissues was subjected to Northern analysis as previously described (Reimer et al., 2000) with a 32P-labeled probe generated from the full-length cDNA. For in situhybridization, 35S-labeled probes corresponding to nucleotides 43–451 were hybridized in 5% dextran sulfate at 55°C for 16 hr as described elsewhere (Sassoon and Rosenthal, 1993). After washing, the sections were dehydrated in alcohol, dried in air, exposed to film for 1–3 d at −80°C, dipped in photographic emulsion, and developed after 4–8 weeks for visualization by dark-field microscopy. In all cases, 6-week-old Sprague Dawley rats were used.
Transfection. The full-length SA2 cDNA and SA1 cDNA (nucleotides 160–1928) were expressed in HeLa cells using the vaccinia virus-T7 polymerase system (Povlock and Amara, 1998). Briefly, HeLa cells were plated at 1.5 × 10⁵ per well. After incubation for 12 hr, 5 pfu of vaccinia virus were added per cell, followed by 1 μg of DNA and 3 μl of Lipofectin (Invitrogen, San Diego, CA) 30 min later. The cells were then incubated for ∼20 hr at 37°C before assaying transport.
Transport assay. Transfected HeLa cells were rinsed with Krebs–Ringer's HEPES (KRH) containing (in mm): 120 NaCl, 4.7 KCl, 2.2 CaCl2, 1.2 MgSO4, 1.2 KH2PO4, and 10 HEPES, pH 7.4, and 0.18% glucose and preincubated in KRH at pH 8.0 for 10–20 min before the addition of 0.1 μCi [14C]methylaminoisobutyric acid (MeAIB; NEN, Boston, MA) in KRH, pH 8.0. After incubation at 37°C for the indicated times, the reactions were stopped by two washes of 2 ml of cold KRH, pH 8.0, and the cells lysed in 1% SDS before scintillation counting in Ecolume (ICN Biochemicals, Costa Mesa, CA). The reactions were performed in duplicate, and the number of assays is indicated in Results. Ultrafit (Biosoft) was used to fit the data to Michaelis–Menten kinetics or for the determination of Hill coefficient.
Measurement of pHi.Na+/H+exchanger-deficient PS120 cells were grown in DMEM with 5% fetal bovine serum, transfected with N-terminally hemagglutinin (HA)-tagged SA1, SA2, or SN1 cloned in the eukaryotic expression vector pcDNA3, and stable transformants selected in the neomycin analog G418 (Chaudhry et al., 1999). Colonies were picked after selection for 2–3 weeks and screened with commercially available antibodies to the HA epitope (Babco, Richmond, CA). Only colonies with >70% positive cells were used. Alternatively, cDNA for SA1, SA2, or SN1 were expressed using the vaccinia virus-T7 polymerase system as described above. To measure pHi, the cells were incubated for 10 min in the pH-sensitive dye BCECF-AM (5 μm), and ratiometric determinations made in individual cells by excitation at 440 and 490 nm (Chaudhry et al., 1999). We imaged ∼200 PS120 cells stably expressing SA2, ∼100 stably expressing SN1, ∼60 transiently transfected HeLa, and ∼75 transiently transfected PS120 cells expressing SA2. Xenopusoocytes were imaged by excitation at 490 nm, subtracting the background fluorescence at 440 nm (which did not change on addition of amino acid).
Electrophysiology. cRNA transcripts were synthesized from linearized SA1 and SA2 cDNAs using T7 RNA polymerase (Ambion, Houston, TX). After rinsing in oocyte Ringer's (OR)–Mg (composition in mm: 82 NaCl, 2 KCl, 5 HEPES, and 20 MgCl), the oocytes were treated with OR–Mg-containing collagenase A (2 mg/ml, Boehringer) for 1–1.5 hr. One to five days after injection of the defolliculated oocytes with 15 ng cRNA, two-electrode voltage clamp recordings were performed at room temperature using GeneClamp 500B (Axon Instruments, Foster City, CA). Except where noted in the text and figure legends, all voltage-clamp experiments were performed in ND96 (composition in mm: 96 NaCl, 2.0 KCl, 1.8 CaCl2, 1.0 MgCl2, and 5 HEPES). Water-injected and uninjected oocytes were used as controls and treated in the same way as oocytes injected with SA1 or SA2 cRNA. Charge–flux ratios were determined by integrating the charge induced by 1 mm3H-alanine over 10 min in individual oocytes and by measuring the radioactivity accumulated by the same isolated oocytes over that time. Background3H-alanine uptake by uninjected oocytes was subtracted.
Hippocampal slices were prepared from young adult [postnatal day 16 (P16)–P22) Sprague Dawley rats. In brief, the animals were deeply anesthetized with halothane, decapitated, and the brains were removed. Tissue blocks containing the subicular area and hippocampus were mounted on a Vibratome in a chamber filled with cold (∼4°C) artificial CSF (ACSF) containing (in mm): NaCl, 119; NaHCO3, 26; KCl, 2.5; NaH2PO4, 1; CaCl2, 2.5; MgSO4, 1.3; glucose, 10, and saturated with 95% O2 and 5% CO2, pH 7.4. Transverse slices were cut at 300 μm thickness and stored for 1–7 hr submerged in ACSF before transfer to the recording chamber where they were perfused at 2–3 ml/min in a 2 ml chamber. The recording chamber was mounted on an Olympus microscope equipped for infrared (IR)-differential interference contrast (DIC) microscopy, and the slices were incubated in ACSF for at least 1 hr before recording in the same solution. Whole-cell recording electrodes were filled for current-clamp measurements with (in mm): 130 K-gluconate, 5 KCl, 1 MgCl2, 10 HEPES, and 2 Na2ATP, pH adjusted to 7.3 with KOH. For whole-cell voltage-clamp recordings, the internal solution contained (in mm): 80 Cs-CH3SO3, 50 CsCl, 1 MgCl, 10 HEPES, 5 EGTA, 2 MgATP, 0.3 Na3GTP, and 5 QX-314, pH adjusted to 7.3 with CsOH. Electrode resistances ranged from 4 to 7 MΩ for interneuron recordings and from 2 to 4 MΩ for CA1 pyramidal cell recordings. Access resistances were continuously checked during the recording, ranged between 4 and 20 MΩ, and were not allowed to vary >15% during the course of the experiment. No series resistance compensation was used. Bipolar tungsten electrodes were placed in stratum radiatum of CA1 to stimulate GABAergic fibers in the presence of NBQX or CNQX (100 μm), GYKI 53655 (100 μm), d-AP-5 (50 μm), (±)-amino-4-carboxy-methyl-phenylacetic acid (500 μm), or LY341495 (20 μm) and SCH50911 (20 μm). Average values are expressed as mean ± SEM.
RESULTS
The ability of SN1 to mediate glutamine efflux from astrocytes has raised the possibility that related transporters SA1 and SA2 (Fig.1A) might contribute to other aspects of the glutamine–glutamate cycle, such as the uptake of glutamine by neurons. SA1 transports glutamine and resides on neurons as well as astrocytes (Reimer et al., 2000; Sugawara et al., 2000). However, SA1 recognizes other neutral amino acids with equal or greater affinity than glutamine and appears in virtually all cells. In contrast, SA2 preferentially recognizes glutamine and shows a more restricted distribution (Varoqui et al., 2000). We have observed substantial amounts of SA2 mRNA in the heart and brain but not many other tissues (Fig. 1B).

Restricted tissue distribution of SA2.A, The sequence of the rat SA2 (rSA2) cDNA predicts a protein with strong similarity to rat SA1 (rSA1) and rat SN1 (rSN1) transporters. The bars indicate putative transmembrane domains,black indicates the amino acids identical to at least one other of the three proteins, and gray indicates similar amino acid residues. B, Northern analysis of poly(A+) RNA (2 μg/lane) from different tissues shows expression of an ∼8 kb SA2 transcript restricted to the heart and brain.
Electrogenic transport and coupled currents
We have recently found that the currents associated with SN1 are largely if not entirely uncoupled from transport (F. A. Chaudhry, M. Kavanaugh, and R. H. Edwards, unpublished observations), raising the possibility that currents associated with closely related System A transporters are also uncoupled (Reimer et al., 2000; Sugawara et al., 2000; Varoqui et al., 2000; Yao et al., 2000). To reassess the relationship of currents to transport by both SA1 and SA2, we first measured uptake of the prototypic System A substrate3H-MeAIB. Expression of SA2 using a vaccinia virus-T7 polymerase system confers increased uptake of3H-MeAIB relative to untransfected cells (Fig. 2a), as previously reported for SA2 (Varoqui et al., 2000) and SA1 (Reimer et al., 2000;Sugawara et al., 2000; Yao et al., 2000). MeAIB saturates transport by SA2 with a Km 1.6 ± 0.33 mm, n = 3 (Fig. 2b), substantially higher than the 0.15–0.5 mmKm reported for SA1 (Reimer et al., 2000; Sugawara et al., 2000; Yao et al., 2000). Very similar to SA1, MeAIB flux mediated by SA2 tolerates substitution of Na+ by Li+but not choline and replacement of chloride by thiocyanate (Fig.2b,c). Depolarization with increased K+ (with or without the K+ ionophore valinomycin) reduces3H-MeAIB uptake by SA2 as well as SA1 (Fig. 2d). Consistent with a specific role for depolarization rather than K+, depolarization of Xenopus oocytes expressing SA1 and SA2 by voltage clamp inhibits the uptake of3H-alanine (data not shown). Transport by both System A proteins thus appears electrogenic and hence differs from SN1, which mediates transport unaffected by membrane potential (Chaudhry et al., 1999).

Transport by SA1 and SA2 depends on membrane potential. a, HeLa cells expressing SA2 with the vaccinia virus-T7 polymerase system (filled circles) show greater uptake of 3H-MeAIB at pH 8 than cells expressing vector alone (open circles);n = 3. b, Expression of SA2 confers saturable transport of 3H-MeAIB in the presence of either Na+ or Li+ (120 mm). The Km for MeAIB at pH 8 in the presence of Na+ is 1.54 ± 0.28 mm(Vmax, 4.04 ± 0.40 nmol/3 min) and 9.62 ± 1.34 mm(Vmax, 3.74 ± 0.68 nmol/3 min) in the presence of Li+; n = 3.c, Na+ and to a lesser extent Li+ but not choline support the uptake of3H-MeAIB by SA2 (left panel).Filled bars indicate HeLa cells transfected with the rat SA2 cDNA, and open bars indicate cells transfected with the vector alone. Transport by SA2 tolerates the replacement of Cl− by SCN− (right panel); n = 3. d,Depolarization by 60 mm KCl (with 60 mm NaCl in the presence or absence of the K+ ionophore valinomycin) reduces the uptake of 3H-MeAIB by HeLa cells expressing SA2 (left panel) and SA1 (right panel); n = 3.
Because transport by both SA1 and SA2 is electrogenic, we used two-electrode voltage clamp to study their function inXenopus oocytes. Figure3a shows that alanine and glutamine produce inward currents in cells injected with SA2 cRNA and held at −50 mV. Uninjected oocytes exhibit no such currents (Fig.3d). At 1 mm, glutamine generates a slightly larger current than alanine, but MeAIB produces a substantially smaller current than either glutamine or alanine (Fig.3a), very similar to SA1 (Fig. 3b) (Reimer et al., 2000; Yao et al., 2000). In addition, SA2 exhibits relatively larger currents for asparagine and histidine and smaller currents for cysteine than SA1 (Fig. 3e) (Reimer et al., 2000).

Currents associated with SA1 and SA2.a, Alanine (A), MeAIB (m), and glutamine (Q) (all 1 mm) produce inward currents in oocytes expressing SA2 and held at −50 mV, pH 8. Glutamine and alanine produce currents considerably larger than MeAIB. b, Oocytes expressing SA1 exhibit the largest currents in response to addition of alanine, followed by glutamine and MeAIB. c, Currents associated with SA2 are inhibited by low pHo. d,Uninjected oocytes show no significant currents induced by these amino acids. e–g, Different amino acids (all at 1 mm) produce currents of different magnitudes in oocytes expressing SA2 (e, f) and SA1 (g) in Na+(e) or Li+ (f, g). The responses are normalized to the currents induced by alanine. The letters refer to the standard single-letter amino acid code, with m representing MeAIB,g representing GABA, c representing cystine, and t representing taurine. h,Relationship of SA2 currents induced by glutamine to membrane potential. Replacement of Na+ by choline dramatically reduces the size of the currents produced by 1 mm glutamine. However, the currents produced by 1 mm glutamine in Li+ almost equal the currents produced by 1 mm glutamine in Na+. i, Current–voltage relationship of oocytes expressing SA2 in NaCl and Na gluconate, with and without addition of 1 mm glutamine. Replacement of chloride by gluconate has little effect on these unsubtracted currents and in particular on their reversal potential. However, glutamine shifts the reversal potential in the positive direction, consistent with electrogenic amino acid transport.
The currents associated with SA1 and SA2 have an ionic dependence similar to the amino acid flux catalyzed by these proteins. Replacement of Na+ by choline dramatically reduces the currents produced by glutamine in cells expressing SA1 (Reimer et al., 2000; Yao et al., 2000) and SA2 (Fig. 3h), confirming the anticipated Na+ dependence. Similar to SN1 and SA1 (Chaudhry et al., 1999; Reimer et al., 2000), glutamine-induced currents as well as flux mediated by SA2 tolerate the substitution of Li+ for Na+(Fig. 3h). Li+ substitution does not change significantly the relative recognition of different amino acids by SA2 (Fig. 3e,f). In contrast, SA1 does not recognize glutamine nearly as well as alanine (Fig. 3g). Low pH inhibits the currents as well as flux associated with SA1 (Reimer et al., 2000; Yao et al., 2000) and SA2 (Fig. 3c). Replacement of Cl− by gluconate has a minor effect on the unsubtracted currents observed in both the presence and absence of glutamine (Fig. 3i).
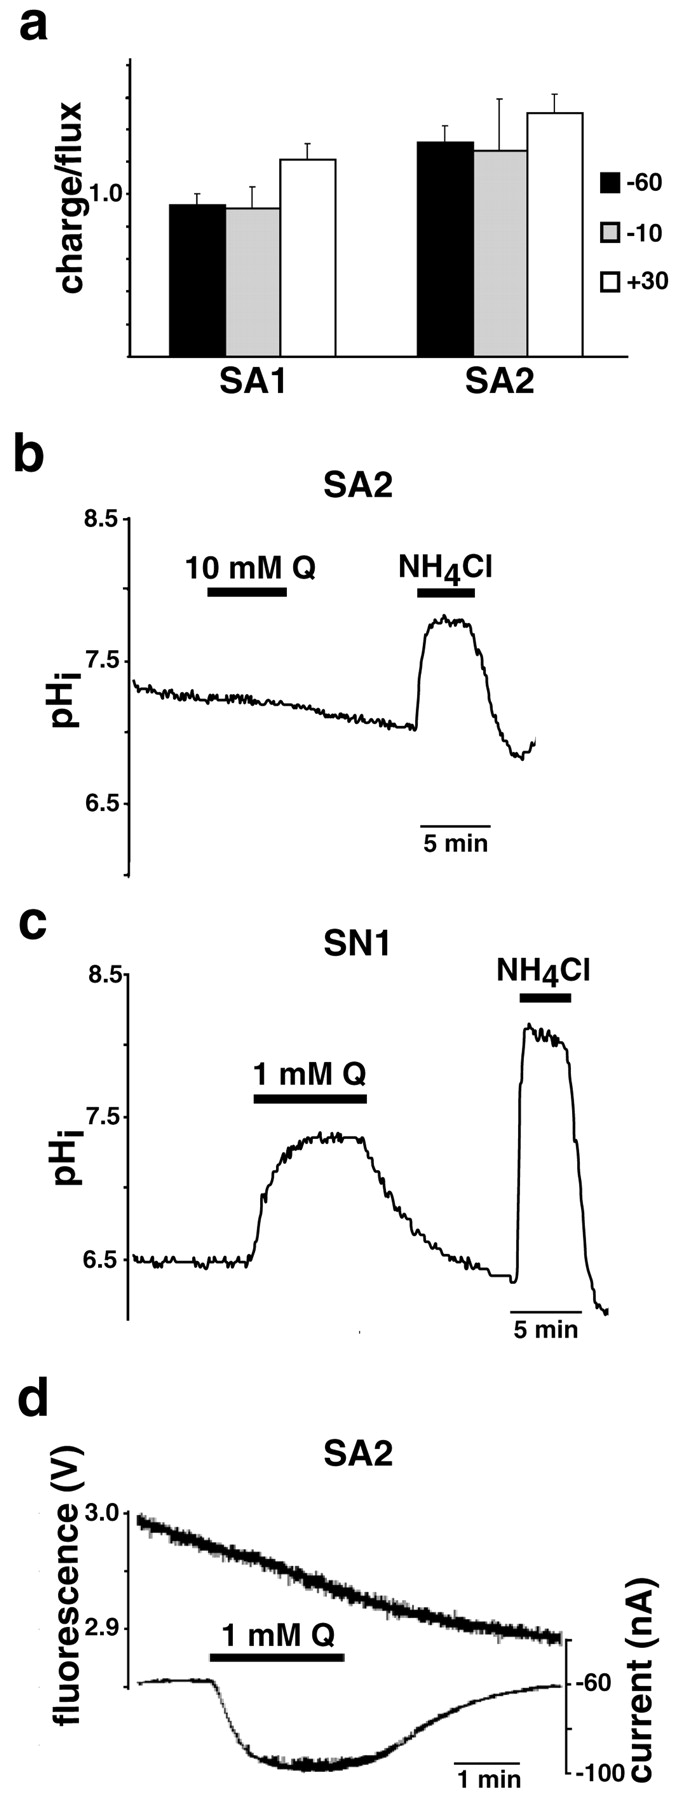
The similar ionic dependence of currents and flux suggests that they are stoichiometrically coupled, but we have found that transport gates a large uncoupled conductance in SN1. The currents associated with SA1 and SA2 may thus also have an ionic dependence identical to transport, yet remain stoichiometrically uncoupled from flux. Analysis of the current–voltage relationship, however, shows that glutamine generates only inward currents in oocytes expressing SA2, even at depolarizing potentials (Fig. 3h). An uncoupled K+, Cl−, or H+ conductance activated by transport would be expected to yield outward currents at depolarizing potentials. The inward rectification of amino acid-induced currents is thus consistent with currents coupled to transport. To confirm that the associated currents are coupled to amino acid flux, we measured the ratio of charge movement to 3H-alanine (1 mm) uptake over 10 min at three different membrane potentials. SA1 exhibits a charge–flux ratio very close to 1 at −60, −10, and +30 mV (Fig.4a). The currents thus appear tightly coupled to amino acid flux. Similarly, the charge–flux ratios observed for SA2 do not vary with membrane potential. However, the charge–flux ratios for SA2 all exceed 1, raising the possibility that more than one Na+ is cotransported with amino acid.

System A Transporters SA1 and SA2 do not translocate protons. a, Charge–flux ratios were determined in oocytes expressing SA1 and SA2 held at −60, −10, and +30 mV from the total current generated over 10 min by 1 mm3H-alanine in individual oocytes and the total accumulation of radiolabeled substrate by the same individual oocytes over the same interval. Currents and 3H-alanine uptake by uninjected oocytes was subtracted. The ratios approximate 1 at all potentials in the case of SA1, consistent with the net inward movement of one charge along with each amino acid. In the case of SA2, the charge–flux ratios exceed 1; n = 3 for each condition. b, c, PS120 cells expressing SA2 (b) and SN1 (c) were loaded with the pH-sensitive dye BCECF-AM, and pHi was measured by ratiometric imaging at 440 and 490 nm. Glutamine (Q) at 10 mm produces no change in the pHi of cells expressing SA2 (b), whereas 1 mmdramatically increases the pHi of cells expressing SN1 (c). Because PS120 cells expressing SN1 are much more acidic at baseline (pHi ∼6.5) (c) than cells expressing SA2 (b), we have used 15 mm ammonium chloride to demonstrate that we can easily detect an increase in pHi under both circumstances.d, Simultaneous measurement of currents and pHi in oocytes expressing SA2 shows that although 1 mm glutamine induces inward currents, it does not change pHi. Thus, transport by SA2 does not involve H+ translocation.
What underlies the difference in charge coupling between the apparently electroneutral System N and electrogenic System A transporters? One possibility is that they differ in the number of Na+ ions translocated per cycle, with 1 Na+ balancing the exchanged proton in the case of SN1, and 2 (or more) Na+ exceeding the charge on the exchanged proton in the case of System A. To assess this possibility, we measured the uptake of3H-MeAIB by transfected HeLa cells to determine the Hill coefficient for Na+. In the case of SA2, the Hill coefficient exceeds 1 at pH 8 (Table1), suggesting that >1 Na+ is cotransported with amino acid, and perhaps accounting for the charge–flux ratio >1 that we have observed for SA2 (Fig. 4a). However, the Hill coefficient of SA2 for Na+ at pH 7 is much closer to 1, as are the Hill coefficients of SA1 at both pH 7 and 8 (Table 1). We therefore considered the alternative possibility that SA1 and SA2, unlike SN1, do not mediate proton exchange. This would result in the transport of neutral amino acid and 1 Na+ unbalanced by the opposite movement of cations, and hence, electrogenic transport. To test this possibility, we imaged pHi in mammalian cells expressing SA2. In contrast to PS120 cells expressing SN1 that exhibit an increase in pHi in response to the addition of glutamine because of the H+exchange mechanism (Chaudhry et al., 1999) (Fig. 4c), PS120 cells expressing large amounts of SA2 show no change in pHi in response to even 10 mm glutamine (Fig. 4b). However, PS120 cells expressing SN1 are very acidic in the absence of external amino acid substrate (Chaudhry et al., 1999) (Fig. 4c), whereas PS120 cells expressing SA1 (data not shown) and SA2 (Fig.4b) exhibit a more neutral pHi. To demonstrate that we can detect an increase in pHiby cells that are more neutral at baseline, we have added ammonium chloride and observed alkalinization of PS120 cells expressing SA2 (Fig. 4b) and SN1 (Fig. 4c). Furthermore, in oocytes expressing SA2, glutamine induces currents but no change in pHi (Fig. 4e). Thus, the electrogenic nature of SA2 derives at least in part from the loss of H+ coupling mediated by electroneutral SN1. The ability of membrane potential to drive transport in the case of System A but not System N carriers predicts that System A generates substantially larger amino acid concentration gradients at resting potential. System N should therefore mediate flux reversal more easily than System A, consistent with the efflux of glutamine from astrocytes by SN1 and the uptake of glutamine into neurons by SA1 and SA2.
The Hill coefficients of SA1 and SA2 for Na+ at pH 7 and 8
Interaction with protons
Despite the absence of proton translocation, both SA1 and SA2 show the classical System A sensitivity to inhibition by low pH (McGivan and Pastor-Anglada, 1994; Palacin et al., 1998), even within the physiological pH range. Low external pH (pHo) inhibits transport by SA2 (Fig. 5) as well as SA1 (Varoqui et al., 2000; Yao et al., 2000). In addition, acidic conditions inhibit the currents associated with SA2 (Fig.3c) as well as SA1 (Reimer et al., 2000; Sugawara et al., 2000). System A transporters may thus have retained the proton binding site of SN1, but not the ability to couple proton movement to amino acid flux.

Protons compete with Na+ for binding to System A transporters. a, b, Increasing Na+ concentrations saturate the uptake of3H-MeAIB by HeLa cells expressing SA2 (a). At 4 μm MeAIB, theKm for Na+ at pHo 7 greatly exceeds the Km at pHo 8. Increasing MeAIB concentrations also saturate uptake by SA2 (b), with a difference inVmax but not Kmbetween pHo 7 and 8. Representative experiments are shown, and the average of multiple experiments ± SEM is compiled in Table 2. c, d, SA1 demonstrates saturation of3H-MeAIB transport in HeLa cells by Na+(c) and MeAIB (d). TheKm for Na+ is higher at pHo 7 than pHo 8, similar to SA2. However, it is more clear that pHo has little effect on theVmax of SA1 at high Na+. pHo also affects the Vmax but not Km for MeAIB (Table 2).
Because H+ coupling appears to account for the difference between electroneutral and electrogenic transport in this family of proteins, we have focused on the interaction of SA1 and SA2 with H+. In agreement with previous work (Varoqui et al., 2000), we found that low pHo reduces theVmax of SA2 for transport, with little effect on the Km for MeAIB (Fig.5b, Table 2). In the case of SA1, low pH also affects primarily theVmax (Fig. 5d). Protons thus act primarily as noncompetitive inhibitors of amino acid, consistent with their binding at a distinct site. However, it seems more likely that H+ competes with Na+ than with amino acid. Indeed, low pHo greatly increases theKm for Na+ of both SA1 and particularly SA2 (Fig.5a,c, Table 2). Failure to saturate transport by SA2 at pH 7 makes it difficult to determine theVmax, however, increasing Na+ concentrations reverse the inhibition of SA1 by low pH. Protons may thus interfere with transport through multiple mechanisms, but appear to compete with Na+ for binding to both SA1 and SA2.
Effect of pH on the kinetics of transport by SA1 and SA2
To understand how the competition between H+ and Na+influences the transport cycle, we have determined whether the binding of Na+ and amino acid is ordered (Fig.6). In the case of symporters such as SA1 and SA2, ordered binding makes predictions about the kinetics of transport, assuming that the translocation of the carrier across the membrane is slow relative to other steps of the cycle (Stein, 1989). Increasing the external Na+ concentration from 6 to 96 mm does not substantially affect the maximal current induced by amino acid in oocytes expressing SA1, but dramatically reduces the Km for alanine (Fig. 6a, Table 3). This result suggests that Na+ binds before amino acid. Conversely, increasing alanine from 0.1 to 1 mm dramatically affects both theVmax andKm for Na+ (Fig. 6b, Table 3), consistent with amino acid binding second. SA2 exhibits the same effects of varying Na+ and alanine on the kinetics of transport (data not shown), indicating that both System A transporters have a fixed order of binding, with Na+ preceding amino acid. Protons thus act in part by blocking the interaction with Na+ required for binding of the amino acid.

Ordered binding of substrates to SA1.A, The currents induced in an oocyte expressing SA1 by different concentrations of alanine in the presence of 6 mmNa+ (left) as a function of holding potential. The same oocyte in 96 mm Na+(right) exhibits no change inImax but the Kmdrops considerably, suggesting that Na+ binds before amino acid. b, Currents induced in an oocyte expressing SA1 by different concentrations of Na+ in the presence of 0.1 mm alanine (A) (left). The same oocyte in 1 mm alanine (right) shows a much largerImax and a differentKm, supporting the ordered binding of first Na+ and then amino acid. The average of multiple experiments ± SEM is compiled in Table 3.
Ordered binding of Na+ and amino acid to SA1
Uncoupled cation conductance
Although System A transporters do not couple the exchange of protons to amino acid flux, we considered that they might still exhibit an uncoupled conductance. Indeed, SN1 exhibits an uncoupled but substrate-activated conductance for H+ in addition to the H+ exchange involved in amino acid flux (Chaudhry, Kavanaugh, and Edwards, unpublished observations). We therefore analyzed the current–voltage relationship of SA1 and SA2. In the presence of substrate, we could not detect any consistent deviation from the currents expected for electrogenic transport, such as a change in reversal potential (data not shown). In the absence of substrate, however, SA2 and to a lesser extent SA1 expression make the oocyte reversal potential sensitive to replacement of Na+ with choline (Fig.7a–c). This shift in reversal potential suggests that, in the absence of amino acid substrate, an uncoupled Na+ conductance is associated with SA2. Li+ also appears to permeate this uncoupled conductance (Fig. 7a). In contrast, uninjected oocytes show no such variation in reversal potential with choline substitution (Fig. 7d). Because SN1 exhibits uncoupled currents only in the presence of amino acid, SA2 again differs by generating an uncoupled current that is detectable only in the absence of substrate.

SA2 mediates a Na+ conductance in the absence of amino acid. a, In the absence of external amino acid, oocytes expressing SA2 exhibit currents that depend on Na+ and Li+. The shift in reversal potential depends on the Na+concentration and varies by 40 mV from 0–96 mmNa+ (b). c,Oocytes expressing SA1 exhibit smaller cation-dependent currents, and uninjected oocytes exhibit none (d);n = 3 for all conditions.
Expression of SA2 by excitatory and inhibitory neurons
To characterize its role in the biosynthesis of amino acid neurotransmitters, we have used in situ hybridization of brain sections to identify the cell populations expressing SA2. SA2 has been considered relatively specific to glutamate neurons (Varoqui et al., 2000), and in situ hybridization confirms high levels of SA2 expression in gray but not white matter (Fig.8a–c). Within the cortex, the expression of SA2 appears laminar (Fig. 8g), supporting selective expression by neurons. Dentate gyrus granule cells and pyramidal neurons in the hippocampus also express SA2 (Fig.8h). However, we have observed expression by non-glutamatergic neurons as well. First, the caudate and putamen contain very few intrinsic glutamate neurons and show levels of hybridization similar to the cortex (Fig. 8a). Second, interneurons in the hippocampus express higher levels of SA2 than pyramidal cells (Fig. 8i). Third, Purkinje cells in the cerebellum, which are GABAergic, also contain abundant SA2 mRNA (Fig.8j). Thus, SA2 cannot have a role only in excitatory neurotransmission. Because glutamate serves as the precursor for GABA, SA2 may also provide the glutamine necessary for biosynthesis of GABA (Pow and Robinson, 1994).
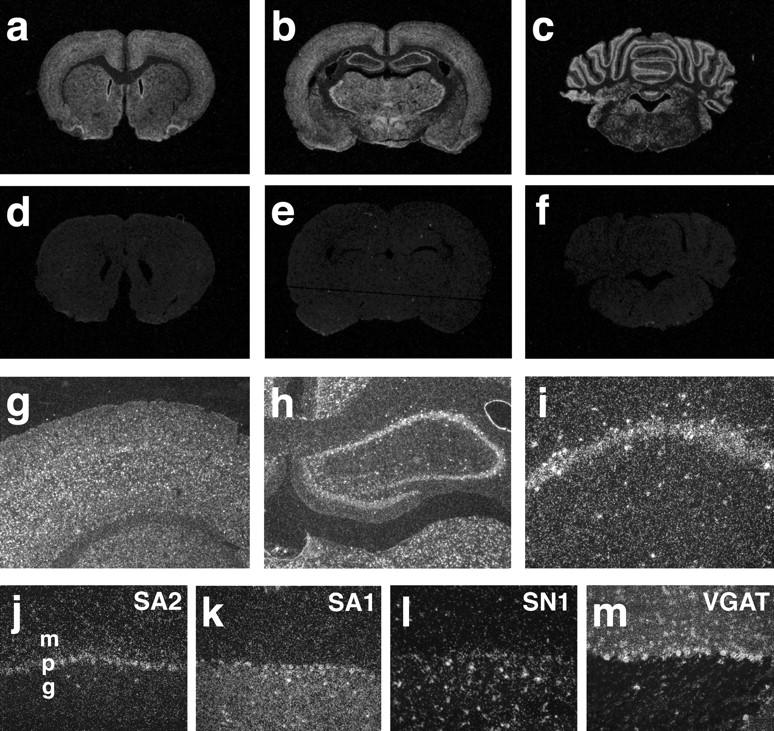
Expression of SA2 by central neuronal populations.a–f,In situ hybridization of coronal sections from the rat brain with 35S-labeled antisense SA2 RNA (a–c) and sense RNA (d–f). All brain regions show specific hybridization signal, but labeling is particularly pronounced in the hippocampus and cerebellum.g–i, Visualized by dark-field illumination, all layers of the cortex contain cells labeled by SA2 antisense RNA (g). In the hippocampus (h), principal cells in the pyramidal and granule cell layers are strongly stained. Scattered positive cells suggestive of interneurons also occur in other layers of CA1 (i). j–m, Related H+-driven amino acid transporters differ in their distribution within the cerebellar cortex. j, Byin situ hybridization with specific antisense RNA, SA2 strongly labels the Purkinje cell layer (p).k, SA1 labels the granule cell layer (g). l, The closely related System N transporter SN1 shows expression by glial-like cells in the granule cell layer. m, The more distantly related vesicular GABA transporter shows expression by inhibitory neurons in the molecular layer (m) and Purkinje cells.
Analysis of the cerebellar cortex illustrates the differences in distribution of the related transporters. SA2 shows expression primarily by Purkinje cells (Fig. 8j), whereas SA1 localizes to neurons and astrocytes in the granule cell layer (Fig.8k). In contrast, SN1 is expressed almost exclusively by astrocytes in the granule cell layer (Fig. 8l). Purkinje cells and interneurons in the molecular layer express the vesicular GABA transporter (VGAT) that originally defined this family of proteins (Fig. 8m) (McIntire et al., 1997). The lack of SA2 hybridization in the molecular layer indicates that although expressed at high levels by Purkinje cells in the cerebellum and interneurons in the hippocampus, SA2 is not expressed by all inhibitory neurons. However, all excitatory neurons in the cerebellum (and perhaps elsewhere) appear to express either SA1 or SA2.
Glutamine depolarizes hippocampal interneurons
To assess the function of System A transporters in neurons, we have examined the direct effect of glutamine on GABAergic interneurons from stratum radiatum of hippocampal area CA1, which expresses SA2 at high levels. In current-clamp mode, glutamine reversibly depolarizes the interneuron membrane (Fig.9a). Consistent with the smaller currents induced by the prototypic System A substrate MeAIB in oocytes expressing SA1 and SA2 (which is not recognized by other neutral amino acid transport systems), MeAIB also induces a smaller depolarization in the hippocampal interneurons. Furthermore, 5 mm glutamine generates a depolarization only slightly larger than 2 mm (Fig. 9b), as anticipated from the currents produced by glutamine at −50 mV inXenopus oocytes expressing SA2 (Km 0.37 ± 0.09 mm;n = 4) and SA1 (Km 2.3 ± 0.3 mm;n = 3). Hippocampal interneurons thus exhibit glutamine-induced depolarization with the properties expected for System A transporters.

Glutamine and MeAIB reduce GABAergic transmission and depolarize interneurons in hippocampal area CA1. a,The membrane potential of CA1 stratum radiatum interneurons depolarizes to a greater extent in response to glutamine (2 mm) than to MeAIB (5 mm). In b, the effects of 2 mm (n = 4) and 5 mmglutamine (n = 5) as well as 5 mm MeAIB (n = 5) are summarized. c, Glutamine (5 mm) reduces the amplitude of the stimulus-evoked IPSCs by ∼30% (top traces). Bottom graphsshow the time course of the experiment. Filled circlesshow the amplitude of the first response, and open symbols show the amplitude of the second. Both responses during the control period have been normalized to 100%. The response to the second stimulus (P2) is less affected by glutamine than the response to the first (P1), thereby increasing the paired pulse ratio (P2/P1). Ind, the effects of glutamine and MeAIB on the first response are summarized. In individual experiments (e), glutamine reversibly affects the paired pulse ratio (n = 5).
We next recorded stimulus-evoked IPSCs in CA1 pyramidal cells of the hippocampus to determine whether glutamine uptake by System A transporters expressed in inhibitory neurons has the potential to affect neurotransmission. In the presence of glutamate receptor antagonists, glutamine (5 mm) reduces the amplitude of IPSCs by 24 ± 5% (n = 7) in a reversible manner (Fig. 9c,e). At 5 mm, MeAIB produces a 15 ± 1% (n = 5) reduction (Fig. 9d), consistent with the smaller currents produced by MeAIB than by glutamine with System A transporters. The reduction in IPSC size is also associated with a change in short-term plasticity, as observed by an increase in the paired pulse ratio (Fig. 9c,e), suggesting a presynaptic locus for the effect. To determine whether the depolarization associated with amino acid uptake by System A transporters might account for the reduced amplitude of the initial response and the increased paired pulse ratio, we also used K+ to produce depolarization. Similar to glutamine, depolarization with 5 and 10 mmK+ reduces the amplitude of the IPSC and increases the paired pulse ratio. Five mmK+ produces an 11.7 ± 3.5% reduction in IPSC amplitude and a 12.5 ± 3.5% increase in the paired pulse ratio (n = 6). A 10 mm concentration of K+ causes a 76.8 ± 3.1% reduction in IPSC amplitude and a 34.1 ± 9.3% increase in the paired pulse ratio (n = 4). The depolarization associated with amino acid is less dramatic than that observed with K+, but a high concentration of System A transporters in the nerve terminal might produce a larger depolarization than what we have observed in the cell body.
DISCUSSION
The results show that System A transporters SA1 and SA2 mediate Na+-dependent electrogenic transport. Consistent with electrogenic transport, depolarization reduces amino acid uptake by both transporters. Charge–flux ratios that are fixed at multiple potentials also indicate little if any uncoupled currents induced by substrate. SA1 and SA2 thus differ from SN1, which exhibits both electroneutral transport and currents uncoupled from flux.
Differences in coupling to H+ appear to account for the differences between System N and A in terms of the charge moved by transport. SN1 mediates the exchange of H+ for Na+and neutral amino acid: glutamine increases the pHi of cells expressing SN1. In contrast, we can detect no change in pHi on addition of amino acid to cells expressing SA2, despite easily detectable inward currents of the same magnitude observed with SN1. SA2 thus does not translocate H+. We have also failed to detect changes in pHi by cells expressing SA1 (R. J. Reimer, unpublished observations). System A carriers thus mediate Na+ cotransport with neutral amino acid but without H+ exchange, resulting in electrogenic transport.
At resting membrane potential, electrogenic Na+-dependent transport produces larger concentration gradients of substrate than otherwise similar electroneutral transport. The Nernst equation predicts that a membrane potential of −60 mV and coupled movement of +1 charge with Na+ will contribute ∼10-fold to the concentration gradient of amino acids produced by the Na+ concentration gradient across the plasma membrane. As a result, electrogenic SA1 and SA2 will not readily catalyze flux reversal at resting potential, although they may reverse with depolarization. In the case of SA2, the charge–flux ratios >1 along with the Hill coefficient for Na+>1 suggest that >1 Na+ may be cotransported with amino acid. Both the increased number of Na+ ions and the charge movement would increase further the driving force for amino acid uptake by SA2. In contrast, we have shown that SN1 readily reverses even at resting membrane potential (Chaudhry et al., 1999), presumably reflecting its electroneutrality. The System N transporter expressed by astrocytes thus has the characteristics required for glutamine export. Although closely related to SN1, neuronal SA1 and SA2 catalyze primarily glutamine uptake. Differences in coupling to H+ thus appear responsible for the vectorial transfer of glutamine from glia to neurons required for the glutamine–glutamate cycle.
Although SA1 and SA2 do not translocate H+, they remain sensitive to inhibition by low pH. We have therefore characterized the nature of the inhibition by H+. Protons increase theKm for Na+ with a less dramatic effect onVmax, particularly in the case of SA2. Although other effects are also possible, H+ thus appears to compete with Na+ for the activation of transport. Similarly, H+ competes with Na+ in the case of SN1, but has the additional possibility to undergo translocation, i.e., promote flux reversal. The inhibition of SA1 and SA2 by H+ may therefore represent a vestige of the H+ exchange mechanism present in SN1.
To explore the role of Na+ in the System A transport cycle, we have determined the order of substrate binding. Using the currents associated with transport, we have found that Na+ binds before amino acid—the Na+ concentration influences theKm but not theVmax for amino acid, whereas the concentration of amino acid influences both theKm and theVmax for Na+ (Stein, 1989). Protons thus influence transport by interfering with the first substrate bound (Na+). In SN1, H+ binding presumably precludes an interaction with Na+ by driving flux reversal.
In addition to the differences in H+coupling, SA1 and SA2 differ from SN1 in terms of uncoupled currents. Despite its electroneutrality, SN1 exhibits a large uncoupled H+ conductance activated by substrates. SA1 and SA2 have no such uncoupled conductance activated by substrate. Indeed, charge–flux ratios that are fixed at different potentials exclude a major uncoupled conductance in the presence of substrate. However, SA1 and SA2 exhibit an uncoupled conductance in the absence of substrate. Na+ carries at least part of this conductance for SA2 because the reversal potential of oocytes expressing SA2 shifts with changes in external Na+. SA2 thus differs from SN1 in gating of the uncoupled conductance—substrates are required to activate the uncoupled currents mediated by SN1, but not those mediated by SA2. The conductance may therefore associate with different phases of the transport cycle catalyzed by SN1 and SA2.
We have taken advantage of these observations made in heterologous expression systems to explore the role of SA1 and SA2 in synaptic transmission. Although either SA1 or SA2 are expressed by essentially all neurons, SA2 appears particularly highly expressed by certain GABAergic interneurons. Glutamine and MeAIB depolarize inhibitory neurons in CA1 of the hippocampus with the relative potency and efficacy anticipated for electrogenic System A transporters. Furthermore, glutamine reduces the size of evoked IPSCs, and changes in the paired pulse ratio suggest effects on transmitter release. Indeed, depolarization with K+ has the same effect on inhibitory transmission as glutamine. System A may therefore contribute to the acute regulation of transmitter release by influencing membrane potential. In addition and perhaps more important, the results suggest that System A transporters function at the nerve terminal, where they may contribute to the regeneration of glutamate and GABA.
Footnotes
- Received April 5, 2001.
- Revision received October 15, 2001.
- Accepted October 16, 2001.
This work was supported by the Norwegian Research Council (F.A.C.), a grant from the Deutsche Forschungsgemeinschaft (Emmy-Noether-Programm) (D.S.), a K08 award from National Institute of Neurological Disorders and Stroke (R.J.R.), and by the National Institutes of Health (M.K., R.A.N., R.H.E.). We thank David Krizaj, David Copenhagen, Rebecca Seal, Jon Storm-Mathisen, Noa Zerangue, Mark Dresser, and the members of the Edwards laboratory for helpful discussions.
Correspondence should be addressed to R. H. Edwards, Department of Neurology, University of California, San Francisco School of Medicine, 513 Parnassus Avenue, San Francisco, CA 94143-0435. E-mail:edwards{at}itsa.ucsf.edu.
F. A. Chaudhry's present address: Department of Anatomy, Institute of Basic Medical Sciences, University of Oslo, N-0317, Oslo, Norway.
- Copyright © 2002 Society for Neuroscience