

Abstract
Dynamics of GABAergic synaptic components have been studied previously over milliseconds to minutes, revealing mobility of postsynaptic scaffolds and receptors. Here we image inhibitory synapses containing fluorescently tagged postsynaptic scaffold Gephyrin, together with presynaptic vesicular GABA transporter (VGAT) or postsynaptic GABAA receptor γ2 subunit (GABAARγ2), over seconds to days in cultured rat hippocampal neurons, revealing modes of inhibitory synapse formation and remodeling. Entire synapses were mobile, translocating rapidly within a confined region and exhibiting greater nonstochastic motion over multihour periods. Presynaptic and postsynaptic components moved in unison, maintaining close apposition while translocating distances of several micrometers. An observed flux in the density of synaptic puncta partially resulted from the apparent merging and splitting of preexisting clusters. De novo formation of inhibitory synapses was observed, marked by the appearance of stably apposed Gephyrin and VGAT clusters at sites previously lacking either component. Coclustering of GABAARγ2 supports the identification of such new clusters as synapses. Nascent synapse formation occurred by gradual accumulation of components over several hours, with VGAT clustering preceding that of Gephyrin and GABAARγ2. Comparing VGAT labeling by active uptake of a luminal domain antibody with post hoc immunocytochemistry indicated that recycling vesicles from preexisting boutons significantly contribute to vesicle pools at the majority of new inhibitory synapses. Although new synapses formed primarily on dendrite shafts, some also formed on dendritic protrusions, without apparent interconversion. Altogether, the long-term imaging of GABAergic presynaptic and postsynaptic components reveals complex dynamics and perpetual remodeling with implications for mechanisms of assembly and synaptic integration.
Introduction
Synapse development is a tightly regulated process involving initiation, maturation, and maintenance. Key steps include accumulation of cell adhesion molecules at sites of axodendritic contact, presynaptic recruitment of vesicle cycling machinery, and postsynaptic recruitment of scaffolding complexes and ionotropic receptors (Shen and Scheiffele, 2010; Siddiqui and Craig, 2011). Regulated plasma membrane insertion, endocytosis, and recycling, as well as local trapping and anchoring control trafficking of synaptic receptors (Malinow and Malenka, 2002; Triller and Choquet, 2005). Emerging evidence suggests that the entire synaptic structure, including scaffolding proteins and vesicles, is highly dynamic during both development and periods of plasticity (Goda and Davis, 2003; McAllister, 2007).
A growing understanding of the dynamics of excitatory synapses has been garnered through long-term live-cell microscopy of fluorescently tagged synaptic proteins. At excitatory synapses in cultured neurons, clusters of PSD-95–GFP and other postsynaptic scaffold proteins show dynamic behaviors over periods of minutes to several days. New PSD-95 clusters formed mainly in dendrite protrusions by gradual accumulation from cytosolic pools, with a slight delay following the appearance of apposed synaptic vesicle clusters (Bresler et al., 2001; Okabe et al., 2001a). However, mobile clusters of postsynaptic scaffolds and stationary postsynaptic clusters that can recruit presynaptic vesicles have also been observed (Gerrow et al., 2006). Stable postsynaptic scaffold clusters were associated with stabilization of dendritic protrusions (Prange and Murphy, 2001) and developed along newly grown dendrite branches over several days (Ebihara et al., 2003). While developing dendrite arbors showed net increases in postsynaptic scaffold cluster density with time, a fraction of clusters were also eliminated (Okabe et al., 1999). The size of individual PSD-95 clusters tended to normalize over time (Minerbi et al., 2009). Postsynaptic scaffold clusters could be mobile, translocating up to a few micrometers along dendrites, or between shafts and dendritic protrusions, and could exhibit complex behavior including merging and splitting (Bresler et al., 2001; Marrs et al., 2001; Prange and Murphy, 2001; Gerrow et al., 2006). The dynamics of excitatory synapse formation have also been shown in vivo. In young neurons of zebrafish optic tectum, PSD-95 accumulation frequently preceded stabilization of dendritic filopodia, which then grew into new dendritic branches (Niell et al., 2004). Mechanisms of axonal arbor stabilization occurring at sites of synaptic vesicle accumulation have also been observed (Meyer and Smith, 2006; Ruthazer et al., 2006). In developing mouse barrel cortex, some PSD-95–GFP clusters imaged in vivo appeared or disappeared, whereas other clusters were stable and maintained relative differences in intensity over days (Gray et al., 2006).
Despite this growing body of evidence on excitatory synapse dynamics, far less is known of inhibitory synapses. Because the balance of excitation and inhibition may be a key factor in the etiology of neurological and cognitive disorders (Rogawski and Löscher, 2004; Sudhof, 2008), it is critical to understand how inhibitory synapses are formed, maintained, and modified. We thus assess here the dynamic behavior of inhibitory presynaptic and postsynaptic components using long-term live-cell fluorescence microscopy, exploring the modification of existing synapses and the development of new ones.
Materials and Methods
Hippocampal neuron culture and nucleofection.
Dissociated hippocampal neuron cultures from embryonic day 18 (E18) rats of both sexes were performed essentially as described previously (Kaech and Banker, 2006), with the following modifications. Freshly dissociated neurons were pelleted at 800 × g for 5 min and subjected to Amaxa nucleofection according to the manufacturer's protocol (Lonza) using 500,000 cells and 3 μg of DNA. Transfected neurons were mixed 1:1 with untransfected neurons and plated at a density of 150,000 cells per 35 mm dish in plating medium (phenol red-free Minimum Essential Medium, 1× Glutamax-I, 1 mm sodium pyruvate, 0.6% glucose, 10% horse serum). Dishes had been prepared previously by drilling a 22 mm round hole in the center of a 35 mm BD Falcon tissue culture dish and adhering a prewashed 25 mm round glass coverslip to the bottom of the dish using a warm 3:1 paraffin/Vaseline mixture. Dishes were extensively washed, coated with polylysine, and preincubated with plating medium. Three hours after neurons were plated onto these dishes, they were briefly washed with phenol red-free Neurobasal medium and then cultured in maintenance medium (phenol red-free Neurobasal medium, 1× Glutamax-I, 2% Neurocult SM1 supplement; StemCell Technologies). This medium had been preconditioned for at least 3 d by glial culture growing on a 24 mm square Thermanox coverslip (Ted Pella), which was also transferred to the 35 mm dish into which neurons were plated. After 2 d in vitro (DIV), glial proliferation was stunted by addition of 4 mm cytosine-arabinoside. Neurons were maintained by replacing one-third of the culture media with fresh maintenance medium every 3 d. All reagents were from Invitrogen or Sigma.
DNA constructs.
cDNA for rat Gephyrin isoform 2,6 was obtained from Dr. A. Triller (INSERM, Paris, France) (Meier et al., 2000). mCitrine [a monomeric, chloride-insensitive variant of yellow fluorescent protein (YFP), but called YFP hereafter for simplicity] was fused to the N terminus of Gephyrin separated by a 12 amino acid spacer (GGGSGGGSGGGS) using site-directed mutagenesis. This construct was subcloned into the NheI/PacI sites of a modified pLentiLox3.7 vector in which the CMV promoter had been replaced with the human synapsinI promoter (Huang et al., 2009), allowing for low-level expression in neurons. For construction of mCherry–Gephyrin, the coding sequence of mCherry (Shaner et al., 2004) was amplified by PCR and inserted into the NheI/BsrGI sites of the above construct to replace mCitrine. cDNA for rat GABAA receptor γ2 subunit (GABAARγ2), short form, was obtained from Dr. P. Seeburg (Max Planck Institute, Heidelberg, Germany) (Pritchett et al., 1989). Site-directed mutagenesis and PCR were used to add His and FLAG epitopes (ASGHHHHHHGMDYKDDDDKGLG), and then enhanced YFP between amino acids 4 and 5 of the mature γ2 peptide coding sequence. This entire construct was subcloned into the AgeI/PacI sites of a modified pLentiLox3.7 vector in which the CMV promoter had been replaced with the chick β-actin CAG promoter (Takahashi et al., 2011).
Immunocytochemistry and live antibody labeling.
Neurons were fixed for 15 min with warm 4% paraformaldehyde and 4% sucrose in PBS, pH 7.4, followed by permeabilization with PBST (PBS plus 0.25% Triton X-100). Fixed and permeabilized cultures were blocked in 10% BSA in PBS for 30 min at 37°C and primary antibodies applied in 3% BSA in PBS for 2 h at room temperature. Coverslips were washed with PBS and incubated in secondary antibodies in 3% BSA in PBS for 1 h at 37°C. The coverslips were then washed and mounted in Elvanol [Tris-HCl, glycerol, and polyvinyl alcohol, with 2% DABCO (1,4-diazabicyclo[2,2,2]octane)]. The following primary antibodies were used: mouse anti-Gephyrin (IgG1; 1:500; mAb7a; Synaptic Systems); rabbit anti-vesicular GABA transporter (VGAT), cytoplasmic domain (1:500; catalog #131 003; Synaptic Systems); guinea pig anti-VGAT, cytoplasmic domain (1:500; catalog #131 004; Synaptic Systems); rabbit anti-GABAARγ2 (1:500; catalog #224 003; Synaptic Systems); and anti-MAP2 for labeling dendrites (chicken polyclonal IgY; 1:10,000; Abcam; ab5392). Labeled secondary antibodies used were raised in goat against the appropriate species and monoclonal isotype, highly cross-adsorbed, and conjugated to Alexa 568 and Alexa 647 dyes (1:500; Invitrogen). To visualize dendrites, we used aminomethylcoumarin acetate-conjugated anti-chicken IgY (donkey IgG; 1:200; Jackson ImmunoResearch; 703-155-155).
For live staining of actively recycling inhibitory presynaptic terminals, neuronal maintenance medium and the glial feeder coverslip were first removed to a separate dish. Neurons were washed briefly in fresh maintenance medium, then briefly in normal extracellular solution [containing the following (in mm): 140 sodium chloride, 4 potassium chloride, 20 HEPES, 10 d-glucose, 2 calcium chloride, 1.3 magnesium chloride, pH 7.4]. Rabbit anti-VGAT directed toward the luminal domain of VGAT and labeled with Oyster-550 (catalog #131 103C3; Synaptic Systems) was suspended at a dilution of 2.5 μg/ml in high potassium extracellular solution [89 mm sodium chloride, 55 mm potassium chloride, 20 mm HEPES, 10 mm d-glucose, 2 mm calcium chloride, 1.3 mm magnesium chloride, 20 μm AP5 ((2R)-amino-5-phosphonovaleric acid), 5 μm CNQX (6-cyano-7-nitroquinoxaline-2,3-dione)]. Neurons were labeled in this solution for 1 min at 37°C then washed extensively with fresh extracellular solution and maintenance medium before the conditioned maintenance medium and glial coverslip were replaced. Neurons were allowed to recover for 30 min before imaging.
Live imaging.
Glass-bottomed neuron dishes were imaged on a modified Nikon TE-2000 inverted epifluorescence microscope (Nikon Instruments). The microscope was equipped with the Perfect Focus System to maintain the plane of focus over various regions of the coverslip for extended periods. Furthermore, the microscope was fitted with a motorized Prior stage, for repeated imaging of multiple coverslip positions, and an OKOLab stage-top environmental control chamber, allowing the imaging environment to be maintained at 37°C, 5% CO2/95% air, and 100% humidity. All imaging was performed with a 63× oil-immersion objective at the lowest light levels and exposure times to allow detection of fluorescence signal without inducing photobleaching or photodamage. Microscope hardware was controlled and images obtained using MetaMorph (Molecular Devices).
Image and data analysis.
Fixed cell immunocytochemistry images were analyzed using custom journals in MetaMorph. Live imaging movies were first aligned in ImageJ (NIH). Fluorescent puncta intensity, size, and density were measured by first applying a “Mexican hat” filter (LoG3D; D. Sage, École Polytechnique Fédérale de Lausanne, Lausanne, Switzerland; http://bigwww.epfl.ch/sage/soft/LoG3D/) to aid detection of spots; detected spots were then used as a mask for quantitation. Motion tracking of fluorescent puncta (see Figs. 2, 3, 5) was performed either by hand or by using the mass-center-tracking-based MTrackJ plug-in for ImageJ (E. Meijering, Erasmus MC, Rotterdam, The Netherlands; http://www.imagescience.org/meijering/software/mtrackj/). The mean-squared displacement and diffusion coefficients were calculated according to the method of Hanus et al. (2006). Formation of new puncta and merging events (see Figs. 5⇓–7) were analyzed by eye and measured by hand. Rapidly mobile YFP–Gephyrin puncta in transfected axons were excluded from analysis. All data were analyzed in Excel and GraphPad Prism. Error bars in graphs represent the mean ± SE.
Results
Clustering of Gephyrin along developing dendrites occurs slowly over time
We characterized the development of inhibitory synapses by expressing the major inhibitory postsynaptic scaffolding protein Gephyrin (Fritschy et al., 2008) tagged with YFP in cultured hippocampal neurons and assessing the changes in YFP–Gephyrin clustering over time. In this system, YFP–Gephyrin clustering becomes prominent on most cells around DIV 10. Beginning at this time point, we imaged fluorescent protein-expressing neurons consecutively every hour for 3 d (Fig. 1A). The integrated fluorescence intensity of individual Gephyrin clusters increased modestly over time at a mean rate of ∼0.4% per hour (Fig. 1B), suggesting gradual addition of YFP–Gephyrin molecules to their sites of clustering. We observed a slow but steady increase in YFP–Gephyrin cluster density of 0.00232 ± 0.00016 puncta per micrometer of dendrite per hour (Fig. 1C). Assuming a dendritic arbor of ∼600 μm in length, this equates to ∼30–35 new YFP–Gephyrin clusters forming per cell per day.

Long-term imaging of inhibitory synapse dynamics. A, Hippocampal neurons expressing YFP–Gephyrin imaged at 1 h intervals for 3 d. Images at left show the first and last time points imaged. The boxed dendrite region is magnified and straightened on the right, with individual frames representing intervals of 7–10 h. B, C, The integrated fluorescence intensity of YFP–Gephyrin puncta over time shows a modest increase, while puncta density shows a slow but steady increase (n = 21 dendrites from 7 cells). D, A YFP–Gephyrin-expressing neuron costained live with Oyster-550-labeled antibody directed toward the luminal domain of VGAT. The boxed dendrite region is magnified on the right. E, Quantitation of colocalization of endogenous Gephyrin or YFP–Gephyrin with VGAT. Left, untransfected DIV 12–15 cells fixed and immunostained for endogenous Gephyrin and VGAT (n = 71 dendrite regions from 20 cells). Middle, DIV 12–15 cells expressing YFP–Gephyrin fixed and stained for VGAT (n = 90 dendrite regions from 20 cells). Right, DIV 12–15 cells expressing YFP–Gephyrin and stained live with 550–VGAT (n = 57 dendrite regions from 7 cells). F, Effect of antibody labeling protocol on inhibitory synaptic markers. Neurons were either untreated (Control), treated with 55 mm KCl solution for 2 min (Stim), or treated with 55 mm KCl solution containing 2.5 μg/ml 550–VGAT antibody for 2 min (Stim + Ab) and then returned to their home dishes and fixed for immunocytochemistry 18 h later. Neither treatment significantly affected endogenous inhibitory postsynaptic (left) or presynaptic (right) density per dendrite area (n = 30 cells). G, Quantitation of Gephyrin-immunoreactive puncta density per dendrite area from untransfected control or YFP–Gephyrin-expressing cells (n = 20 cells). H, Normalized average fluorescence intensity of clusters immunostained for Gephyrin from untransfected control or YFP–Gephyrin-expressing cells showing relative overexpression of Gephyrin of ∼4–14% (n = 20 cells). All values represent mean ± SEM. Scale bars: A, D, left, 10 μm; right, 5 μm.
To assess whether these YFP–Gephyrin clusters represent bona fide synaptic sites, their colocalization with an inhibitory presynaptic marker was assessed. First, we labeled living DIV 12–15 neurons with an antibody to the luminal domain of vesicular GABA transporter VGAT (Martens et al., 2008), allowing specific uptake by actively recycling inhibitory terminals (Fig. 1D). Immunocytochemistry of untransfected cultures and staining for endogenous Gephyrin and VGAT (cytoplasmic domain) showed 54 ± 2% colocalization of Gephyrin with VGAT, whereas colocalization of YFP–Gephyrin with endogenous VGAT showed 66 ± 2% colocalization (Fig. 1E). Interestingly, live cultures stained with the antibody toward the luminal domain of VGAT showed 74 ± 2% colocalization of YFP–Gephyrin with VGAT fluorescent puncta, suggesting this assay may be better suited to visualizing inhibitory synaptic sites than immunocytochemistry methods. To assess the effect of this antibody labeling on inhibitory synapse formation, we stimulated cells with the hyperkalemic loading solution with or without Oyster-550–VGAT antibody (550–VGAT) and allowed cells to recover for 18 h before fixation and immunocytochemistry for endogenous inhibitory synapse markers. Neither treatment showed significant differences in postsynaptic Gephyrin or presynaptic VGAT densities compared to control (Fig. 1F) (ANOVA; p > 0.05). No significant difference was found in the puncta density of endogenous Gephyrin between untransfected control cells and YFP–Gephyrin-expressing cells (Fig. 1G) (t test; p > 0.05), showing that exogenous expression of Gephyrin in this system from the time of plating does not alter overall inhibitory synaptogenesis. This may be due to the fact that expression of YFP–Gephyrin from the human synapsinI promoter results in Gephyrin overexpression of only ∼4–14% above endogenous levels (Fig. 1H). Together, these data show that this system is suitable for studying the developmental dynamics of inhibitory synapses.
Inhibitory postsynaptic scaffolds show dynamic mobility
YFP–Gephyrin was imaged at frame intervals of 1 s (Fig. 2A), 1 min (B), and 1 h (C) for at least 18 frames. Mass-center tracking was used to quantitate the mobility of YFP–Gephyrin clusters. For DIV 12 neurons, the average instantaneous velocities, the gross displacement of a cluster between consecutive frames, were 0.077 ± 0.003 μm/s, 0.193 ± 0.007 μm/min, and 0.261 ± 0.015 μm/h (Fig. 2D). The diffusion coefficient of clusters imaged every 1 s, calculated from the plot of mean-squared displacement (data not shown), was found to be 1.26 ± 0.006 × 10⁻⁴ μm2/s, similar to the value found previously in spinal cord neurons (Hanus et al., 2006). Approximately 5% of clusters imaged moved >1 μm/min or >2 μm/h (Fig. 2E). Mobile YFP–Gephyrin puncta were typically constrained within a relatively small radius, as seen from their average displacement from their original position (0.133 ± 0.012 μm/s, 0.307 ± 0.021 μm/min, and 0.763 ± 0.093 μm/h for DIV 12) (Fig. 2F). Approximately 10% of clusters translocated >5 μm from their origin at some time during an 18 h imaging period (Fig. 2G). Total path length, the sum of all incremental displacements during the entire imaging period, averaged 1.38 ± 0.06 μm in 18 s, 3.47 ± 0.12 μm in 18 min, and 4.71 ± 0.27 μm in 18 h for DIV 12 cells (Fig. 2H). A small subset of puncta were observed to move >10 μm during an 18 h imaging period. Although the three imaging epochs (every second, minute, or hour) show differences in the apparent mobility of YFP–Gephyrin puncta and occasional rapid mobility, it is clear from the high confinement index (the ratio of total path length to displacement from origin) that Gephyrin clusters are generally constrained to a well-defined subregion of dendrite (Fig. 2I). However, clusters imaged every 1 h showed a significantly lower confinement index than those imaged every 1 s or 1 min (Fig. 2I), suggesting a greater involvement of nonstochastic processes in Gephyrin movement during longer imaging intervals.

Mobility of YFP–Gephyrin puncta. A–C, Montages of straightened dendrites obtained by imaging YFP–Gephyrin clusters from DIV 12 neurons for 19 frames at intervals of 1 s, 1 min, and 1 h, respectively. Bottom frames represents the maximum intensity projection of all time points imaged. D–I, Quantitative analysis by mass-center tracking of individual puncta (n = 60–80 puncta from 3–4 cells; DIV 12 per hour and DIV 15 per hour are not significantly different; t test; D, F, H, I). D, Mean instantaneous velocity, averaged over all frames. E, Cumulative probability distribution of the maximum instantaneous velocity within the entire imaging period. F, Mean displacement of puncta from their original positions, averaged over all frames. G, Cumulative probability distribution of the maximum displacement of puncta from their origins within the entire imaging period. H, Scatter dot plot of the total path length of individual puncta over the entire imaging period. Lines show the mean of all tracked puncta. I, Confinement index, defined as the total path length divided by the average displacement from the origin of a punctum. Puncta imaged at 1 h intervals showed significantly less confinement than puncta imaged at 1 s or 1 min intervals (***p < 0.001; ANOVA with Bonferroni's post hoc test). Scale bars: A–C, 5 μm.
Inhibitory presynaptic and postysynaptic structures show correlated mobility as a single unit
Since inhibitory synapses in living neurons could be reliably labeled for both their presynaptic (VGAT) and postsynaptic (Gephyrin) components (Fig. 1D,E), we monitored their mobility in tandem using dual channel fluorescence microscopy. Apposed YFP–Gephyrin and 550–VGAT puncta showed unified mobility (Fig. 3A–J). Mass-center tracking of both presynaptic and postsynaptic puncta showed these two components to be in lockstep with one another, as can be seen from their correlated instantaneous velocities, displacements from origin, total path length, and maintenance of short distance between centers of mass (Fig. 3B–E, G–J). Over the entire imaging period, while both YFP–Gephyrin and 550–VGAT puncta were displaced, >5 μm on average, the distance between their centers of mass remained constant at mean 0.43 ± 0.08 μm (Fig. 3K). The total displacement of a given YFP–Gephyrin punctum and its apposed 550–VGAT punctum were highly correlated, even for puncta traveling >10 μm (Fig. 3L). Moreover, regardless of how much a YFP–Gephyrin punctum was displaced during a single imaging frame, the distance between its center of mass and that for the 550–VGAT punctum remained relatively constant (Fig. 3M). A small proportion of cluster pairs (150/3626; 4.1%) displayed transient interpuncta distances of >2 μm that persisted for only a single frame, likely due to large fluctuations in the VGAT center of mass rather than dissociation and reassociation of appositions (see below). Although we hypothesized that smaller YFP–Gephyrin and 550–VGAT puncta might display higher mobility, there was little correlation (r2 = 0.032; p = 0.055; data not shown).
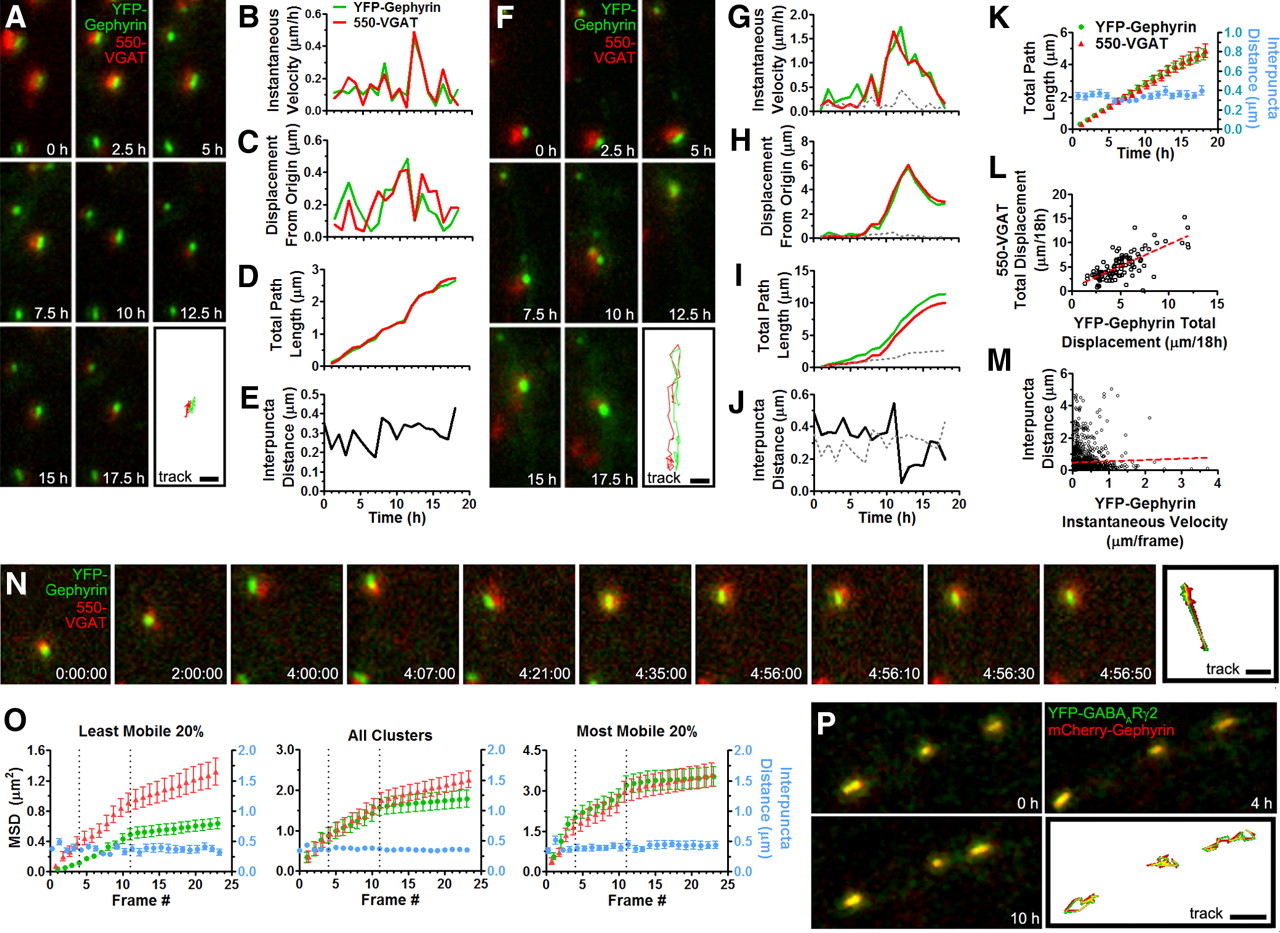
Coordinated movement of inhibitory presynaptic and postsynaptic components. A. Example image montage from a DIV 12 YFP–Gephyrin-expressing neuron colabeled with Oyster-550–VGAT luminal antibody imaged every 0.5 h for 18 h. The lower right frame shows the entire tracked path of both YFP–Gephyrin (green) and 550–VGAT (red) for the entire imaging period. B–E, Measures from mass-center tracking for both YFP–Gephyrin and the corresponding apposed 550–VGAT puncta over time for A. Interpuncta distance (E) is distance between the centers of mass of YFP–Gephyrin and 550–VGAT puncta. F, Example image montage as in A showing a YFP–Gephyrin/550–VGAT cluster pair with greater total path length. G–J, Measures from mass-center tracking of the cluster pair in F. For reference, the YFP–Gephyrin cluster in A is shown on each graph as a gray dotted line. K, Averaged puncta tracking results from 40 YFP–Gephyrin (green)/550–VGAT (red) cluster pairs from DIV 12 neurons. The left y-axis shows the total path length of both particles over time. The right y-axis (cyan) shows the Gephyrin–VGAT interpuncta distance. L, M, Correlation analysis shows positive association of 550–VGAT puncta total displacement with apposed YFP–Gephyrin puncta total displacement (p < 0.0001), and no association of individual frame-by-frame YFP–Gephyrin/550–VGAT interpuncta distance with YFP–Gephyrin instantaneous velocity (p > 0.5; n = 114 clusters; >3600 frames). N, Example image montage of a DIV 12 YFP–Gephyrin-expressing neuron labeled with 550–VGAT imaged every 1 h for 4 h, then every 7 min for 56 min, and then every 10 s for 2 min (time notation shows hours, minutes, and seconds). O, Quantitation of mean-squared displacement (MSD, left y-axis) and interpuncta distance (right y-axis) over the entire imaging period. Vertical dashed lines represent, from left to right, the per 1 h, per 7 min, and per 10 s imaging epochs. The left graph shows quantitation from the 20% of cluster pairs showing the least mobility during the first 4 h of imaging, the middle graph shows all cluster pairs, and the right graph shows the 20% of cluster pairs showing the most mobility (n = 126 cluster pairs from 6 cells). P, Example image montage from a DIV 12 neuron coexpressing mCherry–Gephyrin (red) and YFP–GABAARγ2 (green) imaged every 1 h for 18 h. Scale bars: A, F, N, 1 μm; P, 2 μm.
To ensure we could reliably track apposed presynaptic and postsynaptic clusters and not structures that were disassembled and reformed in between images, we followed low-frequency imaging (every 1 h) by high-frequency imaging (every 7 min and every 10 s) (Fig. 3N). Apposed YFP–Gephyrin and 550–VGAT clusters were visualized in every imaging frame, and the interpuncta distance remained constant over the different imaging epochs (Fig. 3O), suggesting these tracked cluster pairs represent genuine appositions. We also assessed mean-squared displacement as a way to objectively compare mobility of Gephyrin and VGAT clusters. Of the clusters that were most mobile during the initial low-frequency imaging period (Fig. 3O, right), calculated diffusion coefficients, D, for YFP–Gephyrin and 550–VGAT were not significantly different over any imaging epoch (D1 h (Gephyrin) = 0.50 ± 0.10 vs D1 h (VGAT) = 0.45 ± 0.10 μm2/h; D7 min (Gephyrin) = 0.12 ± 0.06 vs D7 min (VGAT) = 0.14 ± 0.08 μm2/min; D10 s (Gephyrin) = 0.022 ± 0.027 vs D10 s (VGAT) = 0.052 ± 0.030 μm2/s; t test, p > 0.05 for all comparisons). Of the clusters that were least mobile during the initial low frequency imaging period (Fig. 3O, left), calculated diffusion coefficients of YFP–Gephyrin and 550–VGAT during the initial low-frequency imaging period were significantly different (D1 h (Gephyrin) = 0.028 ± 0.003 vs D1 h (VGAT) = 0.097 ± 0.028 μm2/h; p < 0.05), whereas other diffusion coefficients were not (D7 min (Gephyrin) = 0.053 ± 0.010 vs D7 min (VGAT) = 0.084 ± 0.024 μm2/min, p > 0.05; D10 s (Gephyrin) = 0.011 ± 0.024 vs D10 s (VGAT) = 0.033 ± 0.011 μm2/s, p > 0.05). This apparently higher diffusion coefficient for VGAT than for Gephyrin for the least mobile cluster fraction may represent greater shifting of the center of mass of the VGAT cluster due to transport of vesicle packets in and out of the VGAT cluster (Ahmari et al., 2000; Staras et al., 2010). In contrast, if YFP–Gephyrin clusters are maintained from cytoplasmic pools (see Fig. 6 and related discussion), exchange of individual molecules would have little effect on center of mass of the Gephyrin cluster. Importantly, for the most mobile fraction of cluster pairs, and for the average (Fig. 3O, middle), calculated diffusion coefficients for Gephyrin and VGAT did not differ, supporting a dominance of coordinated movement.
To further investigate whether these mobile structures represent synapses, we coexpressed mCherry–Gephyrin together with the inhibitory postsynaptic GABAA receptor γ2 subunit tagged with YFP (Fig. 3P). The γ2 subunit is present in the majority of synaptic GABAA receptors and contributes to synaptic localization in hippocampal neurons (Essrich et al., 1998; Luscher and Keller, 2004). Mobile YFP–GABAARγ2 clusters were observed in tight association with mCherry–Gephyrin clusters, moving essentially in unison and displaying patterns of mobility similar to coclusters of YFP–Gephyrin/550–VGAT. We found 74 ± 3% of mCherry–Gephyrin clusters colocalized with YFP–GABAARγ2 clusters (n = 8 cells), similar to the value of 78 ± 2% colocalization of YFP–Gephyrin with endogenous GABAARγ2 (see Fig. 6J) (n = 18 cells). Together, these data show that entire mature inhibitory synapses, composed of both presynaptic and postsynaptic components, can be highly mobile as a single entity.
The number of inhibitory synapses is variable over time due to apparent splitting and merging of presynaptic and postsynaptic structures
Long-term imaging of YFP–Gephyrin and 550–VGAT puncta revealed fluctuations in their cluster density along dendrites over time (Fig. 4A). Spot detection using a “Mexican hat” filter revealed both the appearance and disappearance of puncta between successive 30 min frames, leading to observed changes in puncta density (Fig. 4B,C). Such methods may overestimate transient changes, due to individual clusters crossing paths at distances below resolution or transiently falling below threshold for detection, but present an objective way to compare multiple dendrites and cells, and have commonly been used to quantitate excitatory synapses (Ma et al., 1999). Despite apparent appearance or disappearance of multiple puncta per frame within individual dendrites, the average YFP–Gephyrin puncta density for all cells remained relatively stable for an entire neuron, increasing slightly over the 18 h imaging period (Fig. 4D). The measured rates of addition and elimination of YFP–Gephyrin clusters averaged hourly from multiple dendrites per cell ranged from 0.0088 ± 0.0020 to 0.0261 ± 0.0014 events/μm/h. These short-term rates of addition and elimination were considerably greater than the net rate of change in puncta density determined by comparing the 0 and 18 h times with an average net rate of increase in YFP–Gephyrin cluster density from all dendrites of all cells being 0.00227 ± 0.00082 puncta/μm/h. Individual dendrite regions from different cells showed a continuum of flux behaviors (Fig. 4E,F). For example, all three dendrites of one cell showed little change in YFP–Gephyrin puncta density, with values of 0.0000 to 0.00045 puncta/μm/h, or a change of only 0 to +5% from initial puncta density. In another example, different dendrites of a single cell showed both loss of up to 0.0064 puncta/μm/h and gain of up to 0.0030 puncta/μm/h, or a change of −16 to +20%. Finally, another cell showed different dendrites with a large range of changes in YFP–Gephyrin puncta density, from 0.0000 to 0.0181 puncta/μm dendrite/h, or 0 to +90% from initial puncta density. Hyperkalemic loading of the Oyster-550–VGAT antibody did not affect synapse flux, as cells expressing YFP–Gephyrin but unlabeled for VGAT showed similar rates of addition and elimination with high variability (Fig. 4F). These data suggest that the level of flux is highly variable not only between different neurons but also between dendrites within an individual neuron.

Flux of YFP–Gephyrin puncta in developing neurons. A, Image montage of a straightened dendrite region from a DIV 12 YFP–Gephyrin-expressing cell imaged every 0.5 h for 18 h. Lower panel shows colocalization of YFP–Gephyrin with 550–VGAT at time 3.5 h. B, Thresholded and binarized frames from the montage in A obtained by the “Mexican hat” filter of YFP–Gephyrin signal used to assist in quantitation of individual clusters. Each frame is depicted in a different color, with all time points overlaid at bottom. C, Quantitation of the number of YFP–Gephyrin puncta (green) and 550–VGAT (red) observed over time from the dendrite region in A above. D, Quantitation of average YFP–Gephyrin puncta density over time for 26 dendrite regions from 7 cells at 12–15 DIV. E, Quantitation of the net change in YFP–Gephyrin cluster density at t18 h relative to t0 h. Each column of colored points represents an individual neuron, whereas each point represents a separate dendrite. F, Quantitation of the change in YFP–Gephyrin cluster density per cell averaged over all time points, where addition (solid bars) and elimination (hatched bars) are defined as an increase and decrease, respectively, in puncta density tn to tn + 1. The left (Stim + Ab) shows cells colabeled with Oyster-550–anti-VGAT antibody, with each color representing the corresponding cells in E. The right (Control) shows cells not stimulated or exposed to antibody (n = 3–6 dendrites per cell). Scale bar: B (for A, B), 5 μm.
Appearance and disappearance of fluorescent puncta was often observed associated with the splitting of a single punctum into multiple puncta, or merging of several puncta into one, respectively. The interpretation of such observations is limited by the resolution of light microscopy. While we cannot rule out the possibility that apparently merged clusters are coexisting and comigrating one above the other in the z plane, the apparent unified mobility of such clusters following merging could persist for many hours, even days in the long time-lapse series, suggesting a true merge. Apparent merging of clusters was observed for both YFP–Gephyrin and 550–VGAT in tandem (Fig. 5A,B). We less frequently observed splitting of a single punctum into multiple puncta. Apparent splitting and merging of YFP–Gephyrin often occurred without change in presynaptic structure apposed to the dynamic postsynaptic structures. In such cases, we often saw a single large 550–VGAT cluster apposed to several dynamic YFP–Gephyrin puncta (Fig. 5C), suggestive of multisynapse boutons. By immunofluorescence of control neurons, 3.4 ± 0.4% of VGAT clusters were apposed to greater than one Gephyrin cluster. Cells expressing YFP–Gephyrin and subjected to 550–VGAT antibody labeling showed 3.6 ± 0.6% of VGAT clusters with multiple Gephyrin clusters, suggesting that the live imaging protocol did not affect the formation of multisynapse boutons (t test; p > 0.05).

Complex dynamic behavior of inhibitory synaptic components. A, Image montage of a dendrite region from a DIV 12 YFP–Gephyrin-expressing neuron colabeled with 550–VGAT and imaged every 0.5 h. Two distinct YFP–Gephyrin and 550–VGAT clusters (yellow and cyan arrows) are visible at the beginning of the imaging period, which merge into one cluster at 3 h (green arrow). B, Integrated fluorescence intensity of YFP–Gephyrin puncta corresponding to matching colored arrows in A over time. C, Image montage as in A, showing several YFP–Gephyrin puncta (yellow, magenta, cyan arrows) rearranging around one large central 550–VGAT cluster over time. Scale bars: A, C, 2.5 μm.
Whereas merging occurred frequently, elimination of YFP–Gephyrin and apposed 550–VGAT by gradual diminution was rare. Such gradual elimination of YFP–Gephyrin clusters was more apparent in the 3 d time-lapse series. Careful examination of these long time series revealed a number of clusters that formed by slow accumulation (see below), were stable for many hours, but were eventually eliminated. The mean lifetime of such clusters was 23.2 ± 2.6 h (n = 18 clusters from 4 cells). Since these 3 d experiments were performed without the VGAT colabel, we could not determine whether such eliminated clusters were synaptic.
Development of inhibitory synapses occurs by slow accumulation of presynaptic and postsynaptic components and utilizes recycled synaptic vesicles
A critical factor in the net increase in YFP–Gephyrin clustering along dendrites is the formation of new synapses. Although the net increase in the number of synapses was small, we were able to observe a number of de novo synapse formation events, defined as the appearance of new stable YFP–Gephyrin clusters and associated VGAT at sites previously lacking YFP–Gephyrin or VGAT. These events could be classified by the slow accumulation of YFP–Gephyrin and 550–VGAT at the same site (Fig. 6A). Both YFP–Gephyrin and 550–VGAT fluorescence intensities slowly increased over >8 h (Fig. 6B), with 550–VGAT beginning to accumulate at nascent synaptic sites ∼2 h before the appearance of YFP–Gephyrin (Fig. 6C). These data suggest that inhibitory presynaptic vesicle accumulation precedes postsynaptic scaffold formation. Furthermore, both processes occurred by gradual addition of key synaptic components to these sites rather than by abrupt recruitment of large preformed complexes. Ongoing flux of small 550–VGAT puncta was observed, representing mobile packets that may contribute to both preexisting and newly formed presynaptic elements. On the contrary, discrete dendritic transport packets were not observed for YFP–Gephyrin with its accumulation at nascent synapses appearing to occur from diffuse dendritic pools. In addition to dendritic YFP–Gephyrin, for reasons we do not understand, YFP–Gephyrin occasionally formed puncta that were rapidly transported in transfected axons; such axonal clusters were excluded from the analysis in this study.

Formation of new inhibitory synapses. A, Dendrite region from a DIV 12 YFP–Gephyrin-expressing neuron colabeled with 550–VGAT imaged every 0.5 h for 18 h. Top, Pseudocolor image of YFP–Gephyrin fluorescence. Center, Overlay of YFP–Gephyrin (green) and 550–VGAT (red). Bottom, Pseudocolor image of 550–VGAT fluorescence. Arrow denotes the site at which clustering appears, ultimately consisting of both YFP–Gephyrin and 550–VGAT. Time 0 h represents the frame at which YFP–Gephyrin begins to accumulate. B, Quantitation of fluorescence intensity of YFP–Gephyrin and 550–VGAT from six cluster pairs as in A. Fluorescent signal was baselined to the average fluorescence intensity at the region of interest before accumulation, normalized to intensity at 7–8 h, and aligned to time 0 h when YFP–Gephyrin first began to accumulate. C, Magnification of the x-axis in B shows accumulation of 550–VGAT at synaptic sites preceding accumulation of YFP–Gephyrin. D, Another dendrite region as in A. Only YFP–Gephyrin appears at this site, with no 550–VGAT accumulation. E, Average of fluorescence intensity, baselined, normalized, and aligned as in B, of YFP–Gephyrin and 550–VGAT for five clusters at sites where only YFP–Gephyrin appears to newly accumulate, as in D. F, Dendrite region from a DIV 12 neuron coexpressing mCherry–Gephyrin and YFP–GABAARγ2, imaged every 1 h for 18 h. Top, Pseudocolor image of mCherry–Gephyrin fluorescence. Center, Overlay of mCherry–Gephyrin (red) and YFP–GABAARγ2 (green). Bottom, Pseudocolor image of YFP–GABAARγ2 fluorescence. Arrow denotes the site at which clustering appears, consisting of both mCherry–Gephyrin and YFP–GABAARγ2. G, Quantitation of fluorescence intensity of mCherry–Gephyrin and YFP–GABAARγ2 from 12 cluster pairs as in F. Quantitation was normalized as in B and aligned to time 0 h when mCherry–Gephyrin first began to accumulate. H, Integrated intensity of individual preexisting YFP–Gephyrin clusters was measured over an 8 h period. Shown here are the top (orange), middle (black), and bottom (cyan) 20% fractions from a total of 134 clusters from seven cells. I, Left, Example image montage of a DIV 12 YFP–Gephyrin-expressing neuron imaged every 1 h for 18 h, where time 0 h represents when a new YFP–Gephyrin cluster (arrow) begins to accumulate. Following live imaging, neurons were fixed and subjected to immunocytochemistry for endogenous GABAARγ2 and VGAT (right). The previously identified new YFP–Gephyrin cluster colocalizes with both markers. Scale bars: A, D, F, I, 2 μm.
Our data are also interesting in that 550–VGAT fluorescence signal is detected only in synaptic vesicles that had been labeled during the vesicle recycling protocol before the imaging session. The observation that VGAT intensity at newly formed synapses could reach that of VGAT clusters at neighboring preexisting synapses (Fig. 6A) implies that a significant proportion of vesicles from active release sites could be transferred to generate newly formed presynaptic sites. However, new YFP–Gephyrin clusters could also form in the absence of associated 550–VGAT (Fig. 6D). The time course of YFP–Gephyrin accumulation at sites without 550–VGAT labeling (Fig. 6E) was similar to that at sites where 550–VGAT also accumulated (Fig. 6B). Of all new YFP–Gephyrin clusters observed to form, 65% were accompanied by concomitant accumulation of 550–VGAT at the same site (28 of 43 clusters), whereas the remaining 35% formed in the absence of associated 550–VGAT clustering. However, post hoc immunocytochemistry (Fig. 6I) revealed that 78.5% of newly formed YFP–Gephyrin clusters (62 of 79 clusters) colocalized with VGAT. Since 65% of new YFP–Gephyrin clusters also accumulated 550–VGAT, it appears that approximately only 13.5% of new presynaptic clusters were undetectable in our live imaging assay, highlighting the important contribution of sharing of presynaptic vesicles to nascent synaptic sites. The 21.5% of new clusters of YFP–Gephyrin not apposed to VGAT immunofluorescence may represent future synapses very slow to accumulate VGAT, nonsynaptic clusters, or inhibitory postsynaptic specializations misapposed to excitatory boutons (Rao et al., 2000; Christie and De Blas, 2003).
By post hoc immunocytochemistry (Fig. 6I), we also detected GABAARγ2 at all of the newly formed YFP–Gephyrin clusters colocalized with VGAT (62 of 62), supporting the idea that they represent bona fide synapses. Indeed, further suggesting that many sites of YFP–Gephyrin accumulation represent genuine inhibitory synapses, imaging of neurons coexpressing mCherry–Gephyrin and YFP–GABAARγ2 revealed accumulation of postsynaptic receptors in concert with postsynaptic scaffolds (Fig. 6F,G). Both by the dual live imaging method and by the post hoc immunocytochemistry, over 87% of newly formed stable clusters of tagged Gephyrin, including those not associated with detectable VGAT, were associated with coclustered GABAARγ2.
The rate of new YFP–Gephyrin cluster formation by slow accumulation was estimated around 0.0011 ± 0.0002 new puncta per micrometer per hour based on visual identification of new clusters from time-lapse movies of DIV 12–15 neurons. Comparing with a net rate of increase in YFP–Gephyrin cluster density of 0.00227 ± 0.00082 for DIV 12–15 (Fig. 4D), and of 0.00232 ± 0.00016 puncta/μm/h for DIV 10–13 (Fig. 1C), we suggest that this de novo slow accumulation of YFP–Gephyrin (and 550–VGAT) into clusters represents a major mode of new synapse formation. In support of this idea, new YFP–Gephyrin clusters generated on newly grown dendrite regions observed in the DIV 10–13 time-lapse images (thus without VGAT colabeling) also appeared to form by gradual accumulation (Fig. 7F). Another proportion of new stable synapses may form by splitting of existing synaptic puncta, as there was considerable flux of preexisting clusters (Fig. 4).

Inhibitory synapses form on dendritic shafts, dendritic protrusions, and newly formed dendritic branches. A, Image montage of a DIV 10 YFP–Gephyrin-expressing neuron imaged every 1 h. Dendrite shaft and protrusions are outlined in the first frame. A majority of stable YFP–Gephyrin clusters are present on the dendritic shaft, with a few also on dendritic protrusions. Two new YFP–Gephyrin clusters appear during the imaging period, one on the dendritic shaft (arrowhead) at 3.5 h and another on a dendritic protrusion (arrow) at 9 h. B, Image montage from a DIV 12 YFP–Gephyrin-expressing neuron colabeled with 550–VGAT imaged every 0.5 h for 18 h. Dendrite shaft and protrusions are outlined in the first frame. A new YFP–Gephyrin cluster appears on a dendritic protrusion at 5.5 h associated with appearance of apposed 550–VGAT at 4.5 h (arrow). Note also the appearance of a new YFP–Gephyrin cluster on another dendritic protrusion to the left of this highlighted cluster that appears at time 4.5 h without the appearance of apposed 550–VGAT. C, Image montage of a DIV 10 YFP–Gephyrin-expressing neuron imaged every 1 h for 68 h. First and third rows, Phase contrast images of neurites of both transfected and untransfected cells merged with a pseudocolor representation of YFP–Gephyrin. Second and fourth rows, YFP–Gephyrin fluorescence. Emerging from a primary dendrite at the lower left of the frame is the leading edge of a new dendritic branch (red arrowhead) of a YFP–Gephyrin-expressing cell that crosses the field of view by 28 h. Several YFP–Gephyrin clusters emerge on the new dendritic branch (magenta, cyan, and yellow arrows, in order of appearance). D, Kymograph analysis of the dendrite region outlined in the last frame of C, pseudocolored for fluorescence intensity of YFP–Gephyrin. The dotted line on the kymograph represents the leading edge of the growing dendritic branch. E, Quantitation of normalized YFP–Gephyrin fluorescence intensity of clusters corresponding to their colored arrows in C and aligned to time 0 h defined as the time when the growing dendritic arbor crossed the point at which the YFP–Gephyrin cluster later developed. F, Average of fluorescence intensity of YFP–Gephyrin for four clusters appearing on newly formed regions of dendrite from DIV 10–13 neurons. Fluorescent signal was baselined to the average fluorescence intensity at the region of interest before accumulation, normalized to intensity at 7–8 h, and aligned to time 0 h when YFP–Gephyrin first began to accumulate. Scale bars: A, C, 5 μm; B, 2.5 μm.
Considering the gradual increase in YFP–Gephyrin accumulation that had not yet reached a plateau by 8 h following new cluster formation (Fig. 6A–G, 7F), and the overall slow rate of increase in YFP–Gephyrin intensity from averaging all clusters (Fig. 1B), we next assessed the change in individual YFP–Gephyrin integrated intensity in relation to initial value. There was a >10-fold range in initial integrated intensity of individual clusters, so we compared specifically the top, middle, and bottom 20% of all clusters. The top and middle fractions essentially maintained their original YFP–Gephyrin intensities, showing little increase (101.6% for top fraction and 107.9% for middle fraction, compared with 100% starting value) over 8 h (Fig. 6H). In contrast, the bottom fraction increased in YFP–Gephyrin integrated intensity to 286% in just 8 h. Thus, the net increase in YFP–Gephyrin puncta intensity among all clusters (Fig. 1B) reflects primarily continued recruitment to the smallest/dimmest clusters, without a change in the midrange or largest/brightest clusters. Since we also show here that new synapses begin as small/dim clusters, these results suggest that as new synapses form, YFP–Gephyrin accumulates steadily over many hours to reach a target postsynaptic density size. Furthermore, once a target size is reached (above the bottom 20% but including the middle and top 20% in our measures), synapses generally maintain those size differences.
Inhibitory synapse formation can occur on both dendritic shafts and dendritic protrusions and on newly formed dendrite branches
Imaging of YFP–Gephyrin in DIV 10–15 neurons revealed a majority of clusters stably present on the dendritic shaft, including at the base of protrusions. However, stable clusters were also observed on dendritic protrusions, sometimes with more than one YFP–Gephyrin cluster located on a single protrusion. New clusters were able to form both on the dendritic shaft and on dendritic protrusions (Fig. 7A,B). Accumulation of apposed 550–VGAT was associated with some new clusters of YFP–Gephyrin both on dendrite shafts (Fig. 6A) and on dendritic protrusions (Fig. 7B). We were unable to observe clear transition of YFP–Gephyrin clusters from shaft to protrusion or, conversely, protrusion to shaft. Thus, it is likely that new inhibitory synapses that form on dendrite shafts remain on shafts, and those that form on filopodia or spines remain on the filopodia or spine.
We next sought to observe how newly formed dendrites develop inhibitory synapses. Significant dendrite branch growth was observed only in the long DIV 10–13 time-lapse series of YFP–Gephyrin, thus without VGAT colabel. Using phase contrast microscopy to image all neurites, the growth of dendritic arbors was tracked with respect to inhibitory synapse formation. In one example (Fig. 7C–E), new YFP–Gephyrin clusters appeared between 20–36 h after the new dendrite region was established. From observations of other newly growing dendrite branches, YFP–Gephyrin clusters could form as early as 1 h after the branch's origin, or even as the growth cone passed. The time of appearance of new YFP–Gephyrin clusters with respect to their position on the new dendrite branch (i.e., their distance from the dendrite's branch point) was also unpredictable. In the example shown (Fig. 7C–E), the last cluster to form was closest to the branch point, whereas the first cluster to form was halfway between the second and last formed clusters. These observations imply that synapse formation does not proceed in a simple proximal to distal direction on a newly formed dendrite branch in hippocampal culture. New clusters on new dendrites showed accumulation of YFP–Gephyrin with similar kinetics to new clusters forming on preexisting dendrites (compare Figs. 6B,E, 7F). Considering as well our observation that VGAT clustering precedes Gephyrin clustering at new synapses (Fig. 6), it may be that GABAergic innervation drives the spatiotemporal arrangement of inhibitory synaptogenesis.
Discussion
We report here multiple features of the long-term dynamics of Gephyrin inhibitory postsynaptic scaffold clusters and associated GABAARγ2 and presynaptic VGAT in cultured hippocampal neurons. Entire synapses translocated as a unit over mean path lengths of 5 μm in less than a day, with the Gephyrin, GABAARγ2, and VGAT puncta remaining tightly associated. The densities of Gephyrin and VGAT puncta along dendrites fluctuated, mainly representing merging and splitting of preexisting clusters. Multiple dynamic Gephyrin puncta often rearranged around a large VGAT puncta. There was a slow net increase in Gephyrin cluster density due largely to development of new synaptic clusters. Synapse formation occurred by gradual accumulation of components over several hours, with VGAT accumulating before Gephyrin and GABAARγ2. Comparing active uptake of a VGAT luminal antibody with post hoc immunofluorescence revealed significant contribution of recycled vesicles to the majority of nascent synapses. New synapses formed predominantly on dendrite shafts, but also on dendritic protrusions, without apparent interconversion, and formed on newborn dendritic branches nonsequentially with respect to dendrite lifetime. Together, these data reveal a complex long-term dynamic nature of inhibitory synapses, with implications for synaptic integration and signaling.
We consistently observed submicrometer translocations of YFP–Gephyrin clusters within seconds to minutes. Previous studies indicate that such mobility is promoted by F-actin and inhibited by microtubule cytoskeletal networks, and regulated by calcium and synaptic activity (Hanus et al., 2006). Here, by extending the imaging period to many hours, we found a reduction in confinement index with longer imaging intervals (Fig. 2), indicating a greater contribution of nonstochastic processes to long term translocations. Importantly, these translocations of postsynaptic scaffolds were tightly coordinated with corresponding translocations of associated GABAARs and apposed synaptic vesicles, even over distances of several micrometers and timescales of several hours (Fig. 3). Similar movements of entire synapses have been observed for excitatory synaptic structures (Bresler et al., 2001). It is unlikely that this coordinated movement is a passive process, but rather that it involves cross-talk between presynaptic and postsynaptic components to accomplish rearrangements of both the cytoskeleton and membrane domains to maintain axodendritic synaptic specializations in close apposition. Cell adhesion molecules such as neurexins/neuroligins and cadherins may function to maintain the close apposition (Huang et al., 2007; Arikkath and Reichardt, 2008; Siddiqui and Craig, 2011). By controlling their precise positions on the dendritic arbor, this mobility would regulate the integrative contribution of each inhibitory synapse to network signaling. Dynamic positioning of synapses, either as a by-product of neuronal cytoskeletal and membrane dynamics or a tightly locally regulated process, could be one means of regulating inhibitory/excitatory balance within dendritic segments (Liu, 2004). Synapse mobility is likely to be greatest early in development and during the peak phase of synaptogenesis, when synaptic spacing is largely determined, as in our relatively immature (DIV 10–15) cultures. Whether the dense neuropil of an adult brain affects synapse mobility requires further investigation.
In addition to this coordinated mobility of YFP–Gephyrin and 550–VGAT clusters, we also observed apparent merging and splitting events. While we were able to track a number of these events individually (Fig. 5), their frequency is also reflected in the high flux of puncta with only a relatively small net change in puncta density (Fig. 4). Flux in the density of excitatory postsynaptic scaffold clusters over time along dendritic segments has also been reported, with an interesting synchronization within a given cell (Ebihara et al., 2003). Although merging of clusters has been observed (Gerrow et al., 2006), a major mode for reduction of excitatory postsynaptic scaffold clusters is by elimination or disappearance without obvious merging (Okabe et al., 1999; Niell et al., 2004). For inhibitory postsynaptic scaffold clusters, our observations suggest that merging may be a major mode for reducing the number of synaptic clusters while concomitantly increasing individual synapse size due to the merge (Fig. 5A,B), whereas transient, potentially nonsynaptic clusters may gradually disassemble.
The frequently observed mobility as well as potential merging and splitting of multiple YFP–Gephyrin clusters surrounding a single large 550–VGAT cluster (Fig. 5C) may indicate flux in postsynaptic elements on a single dendrite region associated with a multiple synapse bouton. GABAergic boutons bearing multiple active zones, each with associated postsynaptic specialization, have been described previously in several brain regions (Studler et al., 2002; Biro et al., 2006). At such GABAergic synapses, spillover of transmitter released from one active zone may activate receptors opposite another active zone and may contribute to high persistent inhibition over stimulus trains (Telgkamp et al., 2004; Wanaverbecq et al., 2008). Dynamic rearrangements of postsynaptic elements associated with multiple synapse boutons, as observed here, may influence the response to spillover and thus modify properties of transmission.
We observed new inhibitory synapse formation on previously established and newly grown dendritic regions, mainly on dendrite shafts but also on protrusions (Fig. 7). The gradual increase in YFP–Gephyrin cluster density we observed parallels previously observed developmental maturation of presynaptic release and GABAAR clustering and functionality in culture (Deng et al., 2007). Our results support a mechanism in which YFP–Gephyrin is recruited to new synaptic sites from a cytoplasmic pool over several hours. We were unable to observe small, rapidly moving transport packets of YFP–Gephyrin, which have been suggested to be precursors for synaptic clusters at glycinergic synapses (Maas et al., 2006). Although transport packets of excitatory synaptic scaffold proteins have also been reported (Gerrow et al., 2006), other groups have suggested that, as we observed for inhibitory scaffolds, excitatory scaffolds become clustered from a diffuse pool (Bresler et al., 2001; Okabe et al., 2001b). It is generally agreed that small, rapidly mobile transport packets of synaptic vesicle clusters contribute to new synapses (Ahmari et al., 2000; Bresler, 2004), and our 550–VGAT imaging was consistent with this idea. Presynaptic development is thought to precede postsynaptic development at excitatory synapses (Friedman et al., 2000; Okabe et al., 2001a); likewise, we observed clustering of inhibitory synaptic vesicles before formation of Gephyrin and GABAAR clusters. However, whereas synaptic vesicles, active zone components, postsynaptic scaffolds, and neurotransmitter receptors were recruited within tens of minutes to nascent excitatory synapses (Ahmari et al., 2000; Bresler, 2004), accumulation of VGAT, Gephyrin, and GABAARs occurred over a period of many hours (Fig. 6). Once YFP–Gephyrin clusters reached a certain size, as reflected by integrated intensity, differences in size tended to be maintained (Fig. 6H). Similarly, PSD-95–GFP clusters in vivo were observed to maintain differences in size over days (Gray et al., 2006). The gradual accumulation of postsynaptic components may be triggered in part by Gephyrin oligomerization via its N-terminal G domain and C-terminal E domain (Fritschy et al., 2008), Gephyrin interaction with GABAA receptor subunits (Essrich et al., 1998; Tretter et al., 2008; Saiepour et al., 2010), and Gephyrin interactions with Neuroligin-2 and Collybistin (Harvey et al., 2004; Poulopoulos et al., 2009). While we used only one Gephyrin splice variant in these studies, other variants with different affinities of interaction (Meier et al., 2000) may influence kinetics of Gephyrin accumulation.
Perhaps one of the most striking findings here is the involvement of recycled vesicles in new synapse formation (Fig. 6); to appear at newly formed synapses, the Oyster-550 anti-VGAT antibody label had to bind the luminal domain of VGAT and be endocytosed during stimulation-induced loading of active boutons. Retrospective immunocytochemistry revealed that contribution of vesicles from previously active terminals to nascent synapses represents the major mode of inhibitory presynaptic development. Whether recycled vesicles contribute to new excitatory synapse formation has not been determined, although recent work has shown that recycling vesicles can be shared among multiple preexisting neighboring excitatory boutons (Darcy et al., 2006; Staras et al., 2010). Further quantitative assays to determine the precise contributions of different vesicle pools to nascent inhibitory and excitatory synapses may prove insightful.
Whereas the majority of excitatory synapses form on dendritic protrusions (Prange and Murphy, 2001), we observed the majority of inhibitory synapses to form on dendritic shafts. Indeed, inhibitory synaptogenesis is thought to take place without the participation of axonal or dendritic protrusions (Wierenga et al., 2008). However, a proportion of inhibitory synapses on pyramidal neurons in hippocampus and cortex are located on spines (Megias et al., 2001; Knott et al., 2002). We also observed a proportion of YFP–Gephyrin clusters located on dendritic protrusions, and indeed saw new YFP–Gephyrin clusters form on both dendritic shafts and protrusions (Fig. 7). We did not observe transitioning of YFP–Gephyrin clusters from shafts to dendritic protrusions or vice versa, and therefore suggest that inhibitory synapses may remain on the morphological structure on which they initially form.
Excitatory synapse formation on dendritic protrusions can stabilize those protrusions, promoting further dendrite elongation in a synaptotropic model of dendrite growth in some (Niell et al., 2004; Chen et al., 2010) but not all (Kerschensteiner et al., 2009) neuron types. In cultured rat hippocampal neurons, excitatory synapse formation can stabilize filopodia (Prange and Murphy, 2001), but most new synapses form on preexisting or newly formed dendritic protrusions (Okabe et al., 2001a) that develop on dendrite branches over several days following the branch's outgrowth (Ebihara et al., 2003). Here, we observed inhibitory synapses form anywhere from <1 h to several days after new dendrite growth, with the temporal sequence of synapse formation not strictly coupled to dendrite lifetime (Fig. 7C–E). Further investigation will be required to better understand any relationships between inhibitory synaptogenesis and dendrite morphogenesis, particularly in vivo where contact by GABAergic axons is more precisely patterned than in culture.
Together, our results show complex dynamics of inhibitory synapses over long time courses. These dynamics may be reflective of the perpetual remodeling of synapses that takes place in response to signals arising from molecular interactions and synaptic activity (Liu, 2004; Hartman et al., 2006; Huang et al., 2007; Siddiqui and Craig, 2011). Understanding these complex dynamics may be critical in deciphering a number of neuropsychiatric diseases that arise from GABAergic dysfunction or imbalances in inhibition/excitation.
Footnotes
This work was supported by Canadian Institutes of Health Research (CIHR) Grant MOP-69096, Canada Research Chair and Michael Smith Foundation for Health Research (MSFHR) awards (A.M.C.), and CIHR and MSFHR fellowships (F.A.D.). We thank Xiling Zhou for excellent preparation of neuron cultures.
- Correspondence should be addressed to Ann Marie Craig, Brain Research Centre, Room F149, University of British Columbia, 2211 Wesbrook Mall, Vancouver, British Columbia, Canada V6T 2B5. amcraig{at}interchange.ubc.ca


