

Abstract
Much research has been devoted to characterizing brain representations of reward and movement. However, the mechanisms allowing expected rewards to influence motor commands remain poorly understood. Unraveling such mechanisms is crucial to providing explanations of how behavior can be driven by goals, hence accounting for apathy cases in clinics. Here, we propose that the reduction of motor beta synchrony (MBS) before movement onset could participate in this incentive motivation process. To test this hypothesis, we recorded brain activity using magnetoencenphalography (MEG) while human participants were exerting physical effort to win monetary incentives. Knowing that the payoff was proportional to the time spent above a target force, subjects spontaneously took breaks when exhausted and resumed effort production when repleted. Behavioral data indicated that the rest periods were shorter when higher incentives were at stake. MEG data showed that the amplitude of MBS reduction correlated to both incentive level and rest duration. Moreover, the time of effort initiation could be predicted by MBS reduction measured at the beginning of rest periods. Incentive effects on MBS reduction and rest duration were also correlated across subjects. Finally, Bayesian comparison between possible causal models suggested that MBS reduction mediates the impact of incentive level on rest duration. We conclude that MBS reduction could represent a neural mechanism that speeds the initiation of effort production when the effort is more rewarded.
Introduction
Typical explanations of behavior involve reward prospect: we engage in actions to attain more valuable states. The question of how expected value can induce behavioral activation—a process termed incentive motivation—has been investigated extensively in neuroscience (Berridge, 2004; Schultz, 2006). A central issue is how the value of a world state can be translated into a motor code. The basal ganglia system seems a likely candidate for mediating this incentive motivation process, as revealed by electrophysiology or functional MRI in healthy subjects (Schmidt et al., 2012; Tachibana and Hikosaka, 2012) and by the effects of focal lesions or degenerative disease in patients (Czernecki et al., 2002; Schmidt et al., 2008).
The case of Parkinson's disease (PD) is particularly enlightening. PD is primarily attributable to degeneration of dopaminergic neurons and manifests as a set of motor symptoms (akinesia, rigidity, tremor). However, the reduction of movement (or hypokinesia) could easily be reframed in terms of dysfunctional motivation, i.e., as a difficulty in activating motor plans leading to better states (Mazzoni et al., 2007; Baraduc et al., 2013). This idea accords well with an abundant literature that has implicated dopamine in incentive motivation (Berridge, 2004; Salamone and Correa, 2012). Interestingly, one electrophysiological hallmark of PD is the high level of synchronous oscillations in the beta band (Schnitzler and Gross, 2005; Brown, 2006; Uhlhaas and Singer, 2006). Dopamine replacement therapy, as well as deep brain stimulation, was shown to simultaneously reduce beta synchrony and alleviate hypokinesia (Brown et al., 2001; Kühn et al., 2008). More precisely, delay in voluntary movement initiation was linked to insufficient reduction of beta synchrony in the subthalamic nucleus (Kühn et al., 2004; Williams et al., 2005). Furthermore, simultaneous deep and surface recordings showed that beta oscillatory activities were coherent across basal ganglia nuclei and motor cortical areas (Klostermann et al., 2007; Litvak et al., 2010). Together, these findings suggest that reducing motor beta synchronization (MBS) represent a neural mechanism through which expected rewards may facilitate action initiation.
In healthy people, there is indeed a progressive reduction of MBS (typically in the 13–30 Hz range and centered on the precentral cortex), preceding movement initiation (Jasper and Penfield, 1949; Feige et al., 1996; van Wijk et al., 2012). It is thought to play a “gating role,” meaning that high beta synchrony maintains the motor status quo, whereas low beta synchrony allows for a motor change (Engel and Fries, 2010; Jenkinson and Brown, 2011). Direct evidence of this idea is the finding that driving motor cortical activity in the beta rhythm slows motor performance (Pogosyan et al., 2009; Joundi et al., 2012). Therefore, we reasoned that, in incentive motivation paradigms, the reward magnitude should modulate MBS, which, in turn, should impact movement initiation. To test this hypothesis, we analyzed MEG activity recorded previously in healthy participants while they were trying to minimize the duration of breaks during force production to maximize their payoff (Meyniel et al., 2013).
Materials and Methods
The experimental procedures were designed for other purposes: tracking accumulation and dissipation of cost signals while subjects alternate effort and rest periods. Nevertheless, they seem well suited to address our question about the role of MBS in incentive motivation. The task involved subjects squeezing a handgrip to accumulate as much money as possible. The payoff was calculated as the monetary incentive multiplied by the time spent above a target force level (which indexed task difficulty). Both the incentive and difficulty levels were varied across trials such that we could assess their effects on effort allocation. Incentive levels were sufficient for subjects making the effort and reaching the target, but difficulty levels were too demanding for subjects to sustain their effort throughout trials, which lasted 30 s. Instead, they freely alternated effort and rest periods within trials (for an illustration, see Fig. 1B). Note that any time spent resting corresponded to potential money that was not earned. Thus, subjects had no instructions about when to start force production but were motivated with various incentives to hurry up. We reproduce here the methodological aspects that are relevant to the present question; additional details can be found in our previous publication (Meyniel et al., 2013).
Subjects.
The study was approved by the Pitié-Salpétrière Hospital ethics committee. Subjects (n = 19, 8 males; aged 24.9 ± 0.7 years) were recruited within an academic database via E-mail and gave informed consent before participating in the study. They were right-handed (according to self-report), between 20 and 30 years old, free from magnetic artifacts, and had normal vision and no history of neurological or psychiatric disease. They believed that the money won while performing the task would be their remuneration for participating, but their payoff was eventually rounded up to a fixed amount (100€).
Experimental setting.
Before scanning, participants were given written instructions on the task, which were repeated step-by-step orally. Subsequently, they were escorted inside the MEG scanning room and encouraged to find a comfortable body position that they could keep throughout the experiment. The only change in position was passing the power grip from one hand to the other between sessions. We used homemade power grips composed of two plastic cylinders compressing an air tube when squeezed. The tube led to the control room, where it was connected to a transducer converting air pressure into voltage. Thus, grip compression resulted in the generation of a differential voltage signal, linearly proportional to the force exerted. The signal was fed to a stimuli presentation computer via a signal conditioner (CED 1401; Cambridge Electronic Design) and read by a MATLAB program (MathWorks). Stimuli presentation was also programmed with MATLAB using Cogent 2000 (Wellcome Department of Imaging Neuroscience, London, UK).
Behavioral task.
Before starting task performance, we measured the maximal force for each hand following published guidelines (Gandevia, 2001). Participants were verbally encouraged to squeeze continuously as hard as they could, until a line growing in proportion to their force reached a target displayed on a computer screen. Maximal force was defined as the average, over the last half of the squeezing period, of data points exceeding the median force. Then subjects were provided real-time feedback about the force produced on the handgrip, which appeared as a fluid level moving up and down a thermometer (the maximal force being indicated as a horizontal bar at the top). Subjects were asked to try outreaching the bar and state whether it truly corresponded to their maximal force. If not, the calibration procedure was repeated.
Task sessions included nine trials corresponding to the nine cells of the factorial design (3 incentive × 3 difficulty conditions), which were presented in random order. Subjects performed eight sessions in total, switching hands as instructed between sessions to avoid muscle exhaustion. After baseline measurement of the pressure at rest, each trial started by revealing the monetary incentive with a coin image (10, 20, or 50 euro cents) displayed for 1 s. Then subjects had 30 s to win as much money as possible. They knew that the payoff was proportional to both the incentive and the time spent above the target bar, which was always placed at the same height in the thermometer. The force needed to reach the bar (70, 80, or 90% of subject's maximal force), i.e., trial difficulty, was not indicated to subjects. Subjects only knew that task difficulty would vary across trials. They were provided with online feedback on both the exerted force (with a fluid level moving up and down a thermometer) and the trialwise cumulative payoff (with a counter displayed above the thermometer). The counter was only started when fluid level was above the target bar, with a rate proportional to the current incentive. The fluid had the same luminance as the background to avoid confounding force level with basic visual features. Each trial ended with a 2 s display of the sessionwise cumulative payoff.
Behavioral data analyses.
Effort onsets and offsets were manually identified offline based on the electromyograms and force-level time series. The first rest period started with coin presentation and ended with the first effort onset. The last period, which was interrupted by trial ending, was not analyzed. Effort initial speed was estimated as the mean derivative of force level within the 500 ms after effort onset. Effort and rest period durations were separately analyzed using a repeated-measures ANOVA (R software; John Fox's CAR library, McMaster University, Hamilton, ON, Canada), with incentive and difficulty as factors of interest. The p values reported for these ANOVAs integrate the conservative Greenhouse–Geisser correction.
MEG data acquisition.
A whole-head MEG system with 151 axial gradiometers (CTF Systems) was used to sample brain activity at 1250 Hz with an online low-pass filter of 300 Hz. Two bad sensors (MLT42 and MRT32) were excluded because of high noise levels. Head position was determined using marker coils at fiducial points (nasion, left and right ears) before each session. The first session served as a reference to control that head displacement in the seven remaining sessions never exceeded 5 mm. The first two sessions were excluded from the analyses in two participants because of excessive change in head position.
Electromyograms were recorded simultaneously with two pairs of disposable surface electrodes on each hand, which were placed to target the flexor digitorum superficialis (on the forearm) and the first dorsal interossei (between thumb and index). The two EMG traces and the force time series were recorded along with MEG data (hence sampled at 1250 Hz) and were conjointly used to detect effort and rest onsets by visual inspection. For this offline manual detection, the EMG traces were high-pass filtered (>100 Hz) and the force levels low-pass filtered (<10 Hz).
MEG spectral decomposition.
Data were imported into MATLAB and analyzed using Fieldtrip toolbox (http://fieldtrip.fcdonders.nl; Oostenveld et al., 2011). For each session (lasting ∼320 s), the whole dataset was decomposed into power over time and frequency, using a product with a set of Morlet wavelets after fast Fourier transform. A product in the frequency space is equivalent, but computationally faster, to a convolution in the time space. The Morlet wavelets trade temporal against spectral resolution (σt against σf), such that σfσt = 1/(2π), and scale this tradeoff according to the frequency f, such that f/σf is constant. This ensures that finer temporal resolution is achieved for higher frequencies at the expense of a lower spectral resolution. We set the f/σf ratio to 7, which is standard for the frequency range investigated here. For each unit frequency between 5 and 40 Hz, the product between the wavelets and the data was computed for every 50 ms step. This is well below the original sampling rate (1250 Hz) but sufficient considering the timescale of the process investigated (seconds). The length of each wavelet used for the computation was three times its temporal resolution (σt). These power data were used for every analysis, except the source reconstruction.
MEG source reconstruction.
We used source reconstruction to check that the desynchronization of beta oscillations during rest was arising from the motor cortex. Templates of brain anatomy (single_subj_T1.nii) and meshes of cortical surface and head envelope (cortex_5124.surf.gii) were taken from SPM8 (http://www.fil.ion.ucl.ac.uk/spm). For every subject, sensor positions were coregistered in the MNI space using the mean fiducial positions over sessions as landmarks. The volume conductor model that served to compute dipole orientation was based on the template tessellation of cortical surface. The normalized lead field, i.e., the forward solution from the distribution of dipoles over the grid space to the set of scalp sensors, was estimated using a realistic single shell head model. This corresponds to the “Nolte” method in the Fieldtrip software. The grid size was 10 × 10 × 10 mm, which covered the entire brain. Time series were epoched into pairs of temporal windows, first with the 2 s of rest preceding effort onset and second with the 2 s of baseline preceding the corresponding trial. All epochs were analyzed together in the 13–30 Hz frequency domain, using multi-tappers to compute the cross-spectrum matrix between sensor pairs (in which the diagonal corresponds to the power spectrum at each sensor). A spatial filter was jointly computed for rest and baseline data, using DICS beam former (Dynamic Imaging of Coherent Sources; Gross et al., 2001), without regularization of the solution. Then, we projected the signal of each epoch separately through the filter to estimate the power in the source space, over the 13–30 Hz range. A common filter allows contrasting rest and baseline power levels, hence computing the percentage of signal change. The group mean was interpolated onto the anatomical template for display.
MEG statistical analyses.
Multiple regressions of power level against the various factors of interest (see Fig. 3A) were estimated using MATLAB statistical toolbox. The significance of all regression coefficients was estimated at the group level using a nonparametric procedure, which was repeated for every frequency tested. To estimate uncorrected p values, the null distribution of t values was estimated by flipping the sign of regression coefficients over participants. To estimate familywise error (FWE) corrected p values, the null distribution of the maximal t value was estimated in a similar manner (Nichols and Hayasaka, 2003). In both cases, 200,000 distinct sign changes were used among the 192 = 524,288 possible changes. This correction accounts for multiple testing over frequencies but not for regressing against multiple factors. We did not correct for the number of regressors in the linear models, because they were tested against each other.
For between-subject correlations (see Fig. 3B), uncorrected p values were calculated from Spearman's correlations, and FWE-corrected p values were derived from Holm's step-down adaptive method, which strongly controls FWE without making any assumption (Nichols and Hayasaka, 2003).
Cluster statistics in Figure 4B were calculated using a cluster-mass permutation scheme described previously (Maris and Oostenveld, 2007). First, to determine uncorrected statistical threshold (Tthd) corresponding to p = 0.05, we used the same randomization procedure as described above for multiple regression analyses. These nonparametric thresholds (incentive, Tthd = 2.092; rest duration, Tthd = 2.088) were very close to their parametric counterpart (t0.975,18 = 2.101). Second, cluster-mass FWE-corrected p values were estimated from the null distribution of maximal cluster mass (sum of cluster t values) formed at Tthd. This distribution was approximated using 200,000 distinct randomizations (again among 524,288) of regression coefficient signs over participants. All p values reported throughout this study correspond to bilateral tests.
Bayesian model selection.
For each model depicted in Figure 5B, rest duration and z power were separately modeled as linear combinations of the variables supposed to influence them (through the arrows). We fitted the models by adjusting the beta coefficients so as to minimize the residuals (denoted ε) in the following equations (with I being the incentive level, F the first eigenvector of MBS, and D the rest duration):


 All variables were z scored beforehand, such that their offset and scaling could not bias model comparison. Models were estimated using a variational-Bayes approach under the Laplace approximation (Friston et al., 2007; Daunizeau et al., 2009), which was implemented in a toolbox by Jean Daunizeau (available at http://sites.google.com/site/jeandaunizeauswebsite/). This algorithm estimates model evidence and parameters, using the free-energy approximation (Friston et al., 2007). This approximation of model evidence is computationally tractable and usually more accurate than the Akaike information criterion or the Bayesian information criterion (Penny, 2012). A model evidence is the probability of observing the data given this model. It corresponds to the marginal likelihood, i.e., the integral over the parameter space of the model likelihood weighted by the prior on its parameters. Therefore, model evidence increases with likelihood (accuracy of the fit) but is penalized by the dimension of the parameter space (complexity of the model). In other words, it quantifies the complexity versus accuracy tradeoff, which is mandatory for model comparison (Stephan et al., 2009). Model selection was performed at the group level using a random effect: log-evidence values were passed through Gibbs sampling (provided in SPM8) to approximate the models posterior densities and hence the models exceedance probabilities. Given the data acquired across participants, the model exceedance probability quantifies the belief that this model is more frequently implemented in the general population than any other model of the tested set (Stephan et al., 2009).
Results
Factors affecting rest behavior
In our task, participants could freely allocate their effort production within the 30 s of each trial (Fig. 1A), knowing that the payoff was proportional to both the effort duration and the incentive level. All subjects spontaneously alternated effort and rest periods during the course of trials (Fig. 1B), suggesting that incentive levels were high enough to induce effort production and difficulty levels high enough to impose breaks. Two repeated-measure ANOVAs were performed to characterize the effect of the manipulated factors (incentive and difficulty levels) on the durations of rest and effort periods separately (Fig. 1B). For higher incentives, participants prolonged effort duration (F(2,36) = 11.1, p = 2.7 × 10⁻³) and shortened rest duration (F(2,36) = 10.5, p = 3.2 × 10⁻⁴). These two effects contributed to increase the payoff, because they augmented the total time spent squeezing the grip when more money is at stake. Higher difficulty shortened effort duration (F(2,36) = 14.0, p = 4.3 × 10⁻⁵) but did not significantly affect rest duration (F(2,36) = 1.0, p = 0.35). In the following, we focus on rest duration, which was only affected by incentive level. The aim of the following MEG data analysis was to test whether incentive effect on rest duration was mediated by MBS reduction.

Behavioral task and results. A, The illustrated screenshots were successively presented every trial. When the thermometer image was displayed, participants could squeeze a handgrip to win money. Subjects were provided online feedback on force level and cumulative payoff. The payoff was only increased when force level was above the target bar, at a constant rate proportional to the monetary incentive. Two factors were manipulated over trials: (1) the incentive (10, 20, or 50¢), which was explicitly indicated as a coin image; and (2) the difficulty, i.e., the force required to reach the target bar (70, 80, or 90% of maximal force), which remained implicit. The last screen indicated the money won so far, summed over all preceding trials. B, Example recording of the force level produced during one trial. Three rest (blue shading) and effort (red shading) epochs could be defined. Force production was only rewarded when above the target threshold (here, 80% of maximal force), i.e., when plotted in black (not gray) on the graph. C, Average data sorted by incentive and difficulty levels. Bars are mean effort and rest epoch durations, and error bars are the intersubject SEs. Significance of repeated-measure ANOVA main effects: nsp < 0.1, **p < 0.005, ***p < 0.0005.
Spatiotemporal characteristics of MBS
To be qualified as MBS, our signal had to exhibit three critical features: (1) a dip around movement initiation; (2) in a specific frequency band (13–30 Hz); and (3) from a source located over the central sulcus, lateralized with respect to the hand used.
After spectral decomposition of oscillatory activity, the power was normalized by a z-score transformation. This z power was calculated at each frequency by subtracting the mean and dividing it by the standard deviation of the trial baseline, which was defined as the 2 s window preceding incentive display. To verify the scalp topography of MBS at effort initiation, we averaged z power over time (within 1 s centered on effort onset) and frequency (within a range of 13–30 Hz). Sensors showing the lowest synchrony level were indeed localized around central brain surface (Fig. 2A, right). To analyze variations of MBS level, we selected as sensors of interest the 10% sensors with lowest beta synchrony level. The selection procedure resulted in a similar list of sensors when applied on left-hand, right-hand, or pooled data (as can be expected from topographies in Fig. 2B). To simplify subsequent analyses, we selected a single set of sensors across hands and subjects, based on pooled data. The time course of z power, averaged across sensors of interest, showed the classical progressive reduction in the beta band, over the 2 s preceding effort initiation, dipping just after effort onset (Fig. 2A, left).

Characterization of MBS. A, Beta synchrony level recorded from central sensors. The time–frequency map shows synchrony level around effort onset, averaged over central sensors (white dots on both hands topography). The mean ± SEM (in gray) time series over the beta band (13–30 Hz) is plotted underneath. z-power means that the power is z scored relative to the trial baseline. B, Scalp topography of beta synchrony level. Maps show synchrony level averaged over beta-range frequencies (13–30 Hz) in a time window centered on effort onset (−0.5 to 0.5 s), for pooled sessions and for left and right hand sessions, separately. White dots correspond to the 10% sensors with lowest synchrony level. C, Sources of beta synchrony reduction. The color code indicates percentage of beta synchrony reduction relative to the baseline. Coronal and sagittal sections show regions exhibiting the most pronounced reduction, within the 2 s preceding effort onset, regardless of the hand used (left panels) and contrasted between hands (right panels). To superimpose sources onto brain anatomy, we arbitrarily used a bilateral threshold taken at half the extremes (±14.5%) for the left panels and a more liberal threshold (±8%) to illustrate lateralization effects in the right panels.
To confirm that beta synchrony reduction arose from motor regions, we reconstructed the sources of power in the 13–30 Hz range using a beam former (see Materials and Methods). Contrasting rest to baseline revealed that two main sources underpinned beta power reduction in the left and right sensorimotor cortex [MNI peak coordinates: (30, −30, 60) and (−50, −40, 50)]. When contrasting sessions using left and right hands, a significant asymmetry was observed in favor of the contralateral sensorimotor cortex (Fig. 2B). Note that the sources of desynchronization in the alpha band (10–13 Hz) were very close, with peaks at (40, −40, 50) and (−60, 30, 40). The asymmetry between hemispheres could reflect the fact that slightly different motor regions are recruited when subjects (who were all right-handed in our study) move their dominant versus their nondominant hand.
Factors modulating MBS
The above results confirmed that our task elicits MBS reduction before effort, using classical fixed-window analyses. Because we aimed at explaining rest duration in the following analyses, we now considered variable windows: the entire epochs between effort offset and onset. To identify which factors have an effect on MBS, we averaged, for each rest epoch, z power over time points and sensors of interest, which were selected on the basis of independent criteria (see above). This mean z power was fitted with a linear model including both manipulated and observed variables: (1) incentive level; (2) difficulty level; (3) duration of the preceding effort; (4) rest duration; (5) initiation speed of the following effort; and (6) duration of the following effort. The model also included factors of no interest that would capture fatigue or adaptation effects at different timescales: (1) the ordinal position of the considered rest period within a trial; (2) that of the trial within a session; and (3) the session number. Regression coefficients were estimated independently for every frequency, and their significance was calculated after FWE correction for multiple comparisons at the group level (see Materials and Methods). z power was specifically reduced in the beta band by two factors: (1) higher incentive levels; and (2) shorter rest durations (Fig. 3A). Among the motor execution parameters (previous and following effort duration, rest duration, effort initiation speed, and effort difficulty), MBS only varied with rest duration. The size of this effect was significantly higher than the others (paired t test over frequencies and variables, all p < 0.05, except for “next effort” at 14–16 Hz and “difficulty” at 39–40 Hz for which there was a weak trend, p < 0.1). Thus, the regression analysis supports the idea that MBS reduction may mediate incentive effects on a specific movement-related parameter: rest duration.

Factors affecting MBS. A, Within-subject effects on z power (z-scored power change relative to baseline level). The six rows show the effect of the six factors of interest included in the multiple regression analysis. The coefficients (betas) obtained at each frequency are shown in the left panels (as intersubject mean ± SEM). Their significance was estimated at the group level and plotted as p value logarithms in the right panels (plain lines, uncorrected p values; dashed lines, FWE-corrected p values). The horizontal line corresponds to p = 0.05. B, Across-subject correlations between incentive effects on rest duration and z power (the latter being estimated in the null space of rest duration effect). Spearman's correlation coefficients are plotted for each frequency in and around the beta band (5–40 Hz). empty circle: p < 0.05 uncorrected, filled circle: p < 0.05 FWE corrected.
This idea also predicts that subjects who exhibit strong incentive effects on MBS reduction should as well exhibit strong incentive effects on rest duration. Note that, at the subject level, MBS level and rest duration are not independent, which may bias the between-subject correlation between incentive effects on MBS reduction and rest duration. Therefore, we orthogonolized the two variables by regressing the linear effect of rest duration out of MBS level before estimating the parametric effect of incentive levels. As predicted, the between-subject correlation was positive and significant in the beta range (Fig. 3B), surviving FWE correction for testing multiple frequencies (see Materials and Methods).
Comparison of causal models linking incentives, MBS, and behavior
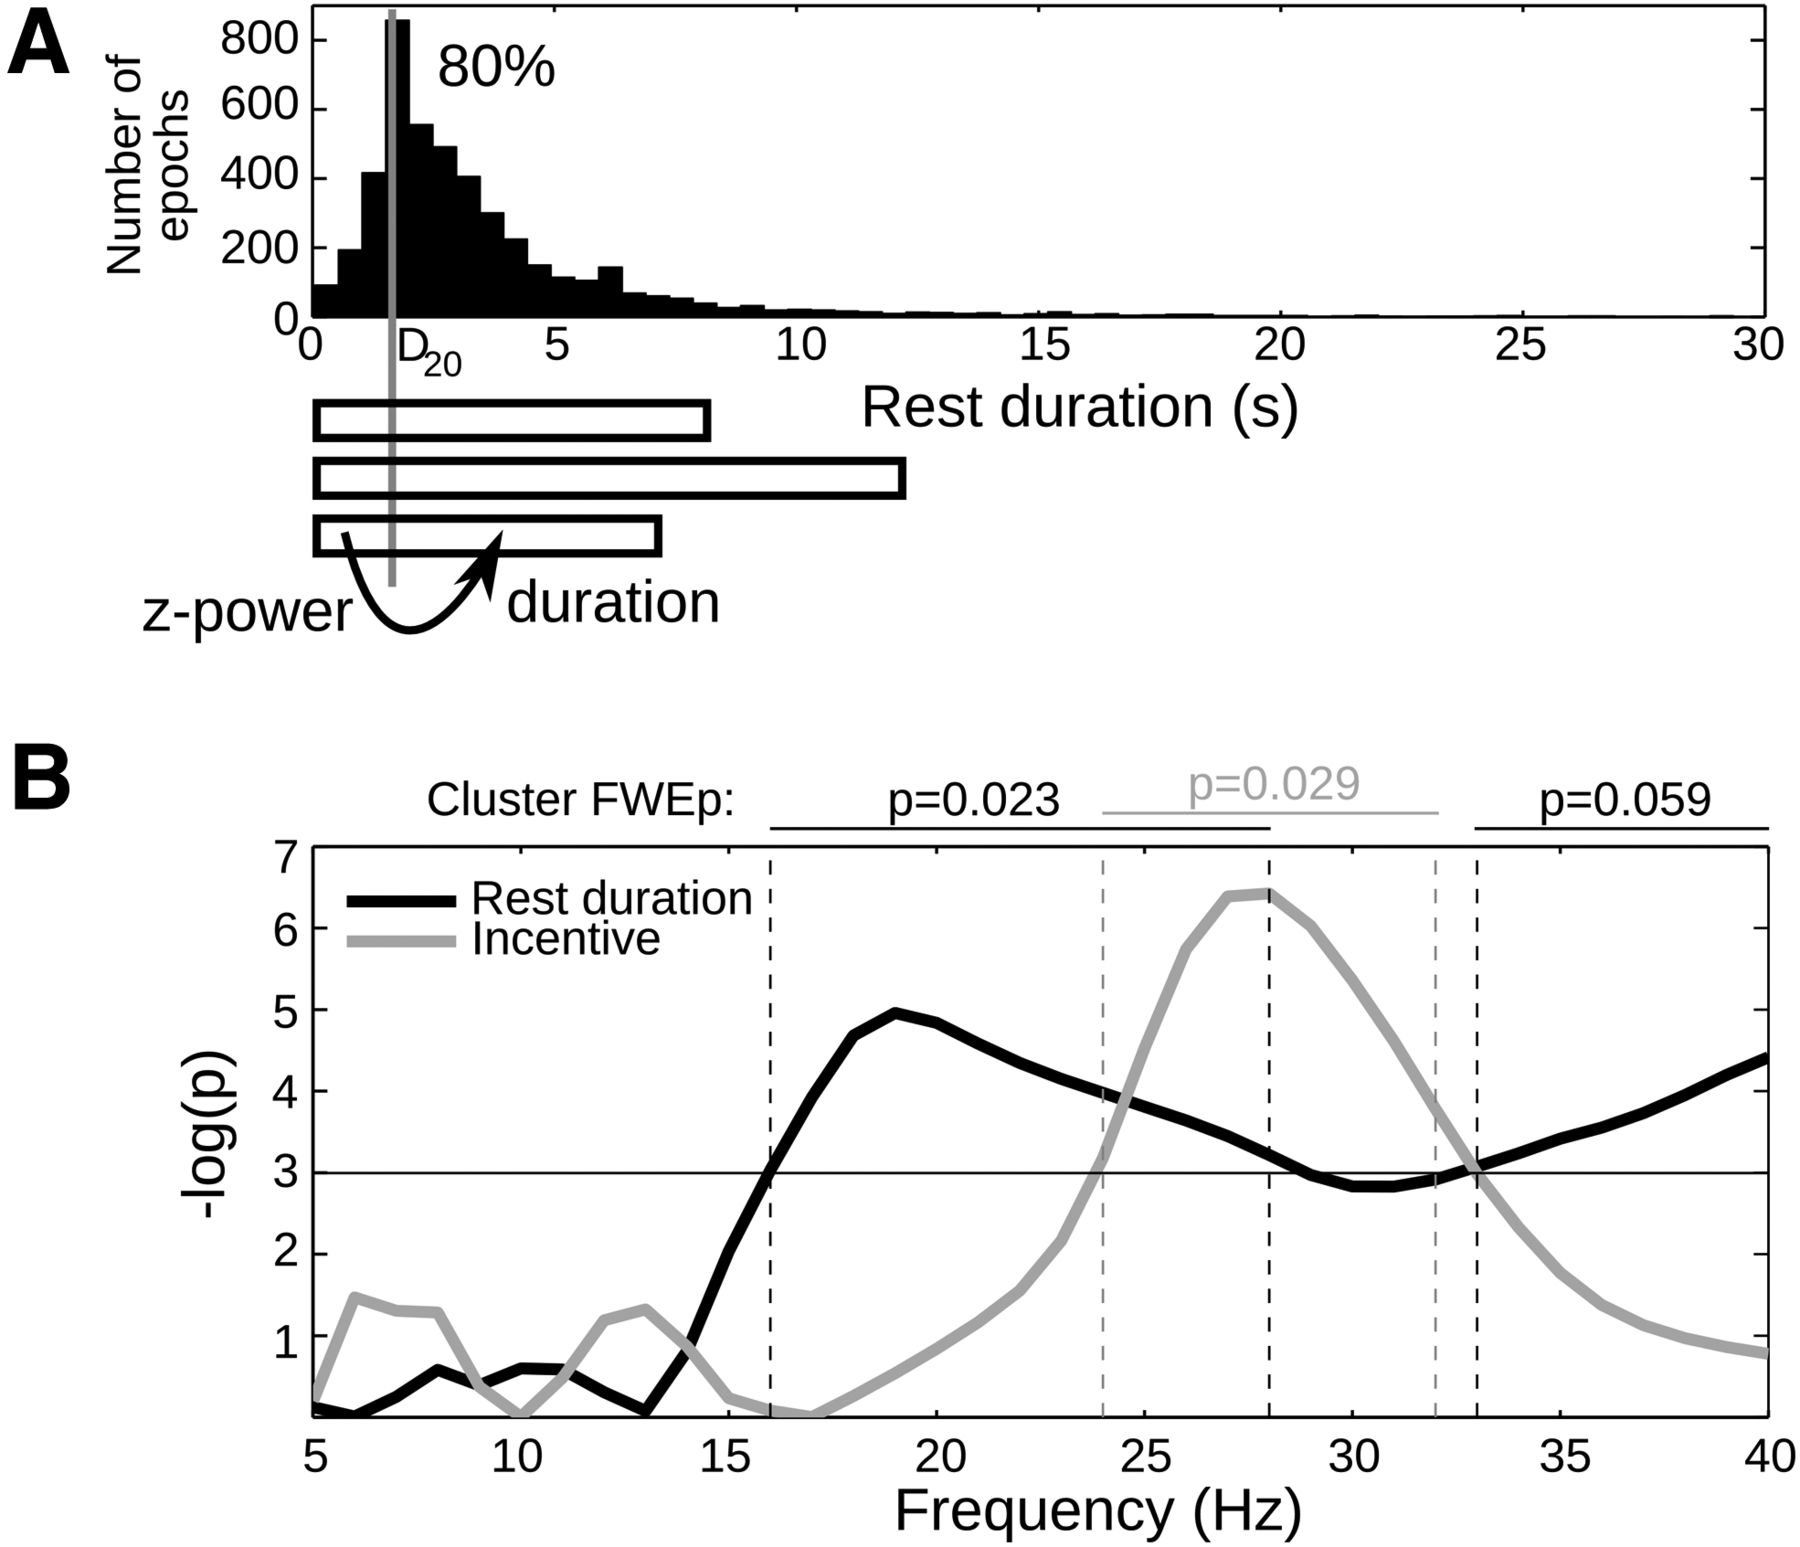
In principle, the statistical dependencies between incentives, MBS, and behavior could result from rest duration mediating incentive effects on MBS. In other words, shorter duration would artifactually reduce measures of MBS level. Although we do not see what mechanism could support this scenario, we intended to rule this out formally. Because consequences cannot precede their causes, we simply tested whether MBS reduction would anticipate rest shortening. z power was averaged within a limited time window starting with effort offset and independent from rest duration (Fig. 4A). This early z power was then regressed against the subsequent rest duration. The end of the time window was set for each subject at the 20th percentile of rest durations to ensure both a sufficient amount of z-power samples (the minimum being 24 samples at 20 Hz, corresponding to 1.2 s) and a sufficient amount of rest periods included (the 20% rest periods shorter than the time window being excluded). We also included incentive level in the regression model, because it is correlated with rest duration. The regression was done for each subject and frequency and then tested for significance at the group level (Fig. 4B). Several clusters of frequencies formed at a p < 0.05 uncorrected threshold survived FWE correction, revealing that z power in the beta range was correlated positively with rest duration and negatively with incentive level. Thus, the early MBS reduction was enhanced by incentive level and predicted the upcoming rest duration. Therefore, it seems unlikely that shorter rest duration may be the cause of MBS reduction.

Early MBS predicts rest duration. A, Distribution of rest durations pooled over all participants. The graph below depicts the logic of the analysis: for each subject, the 20th percentile of rest duration (D20) was estimated, and early z power was defined as the mean z power between rest onset and D20. Then rest duration (together with incentive level) was regressed against early z power, across all epochs that lasted longer than D20 (hence representing 80% of the total). B, Simultaneous regression of rest duration and incentive level against early z power. Regression significance at the group level is shown as logarithm of uncorrected p values, for each frequency in and around the beta band (5–40 Hz). Clusterwise FWE-corrected p values are also indicated above the graph.
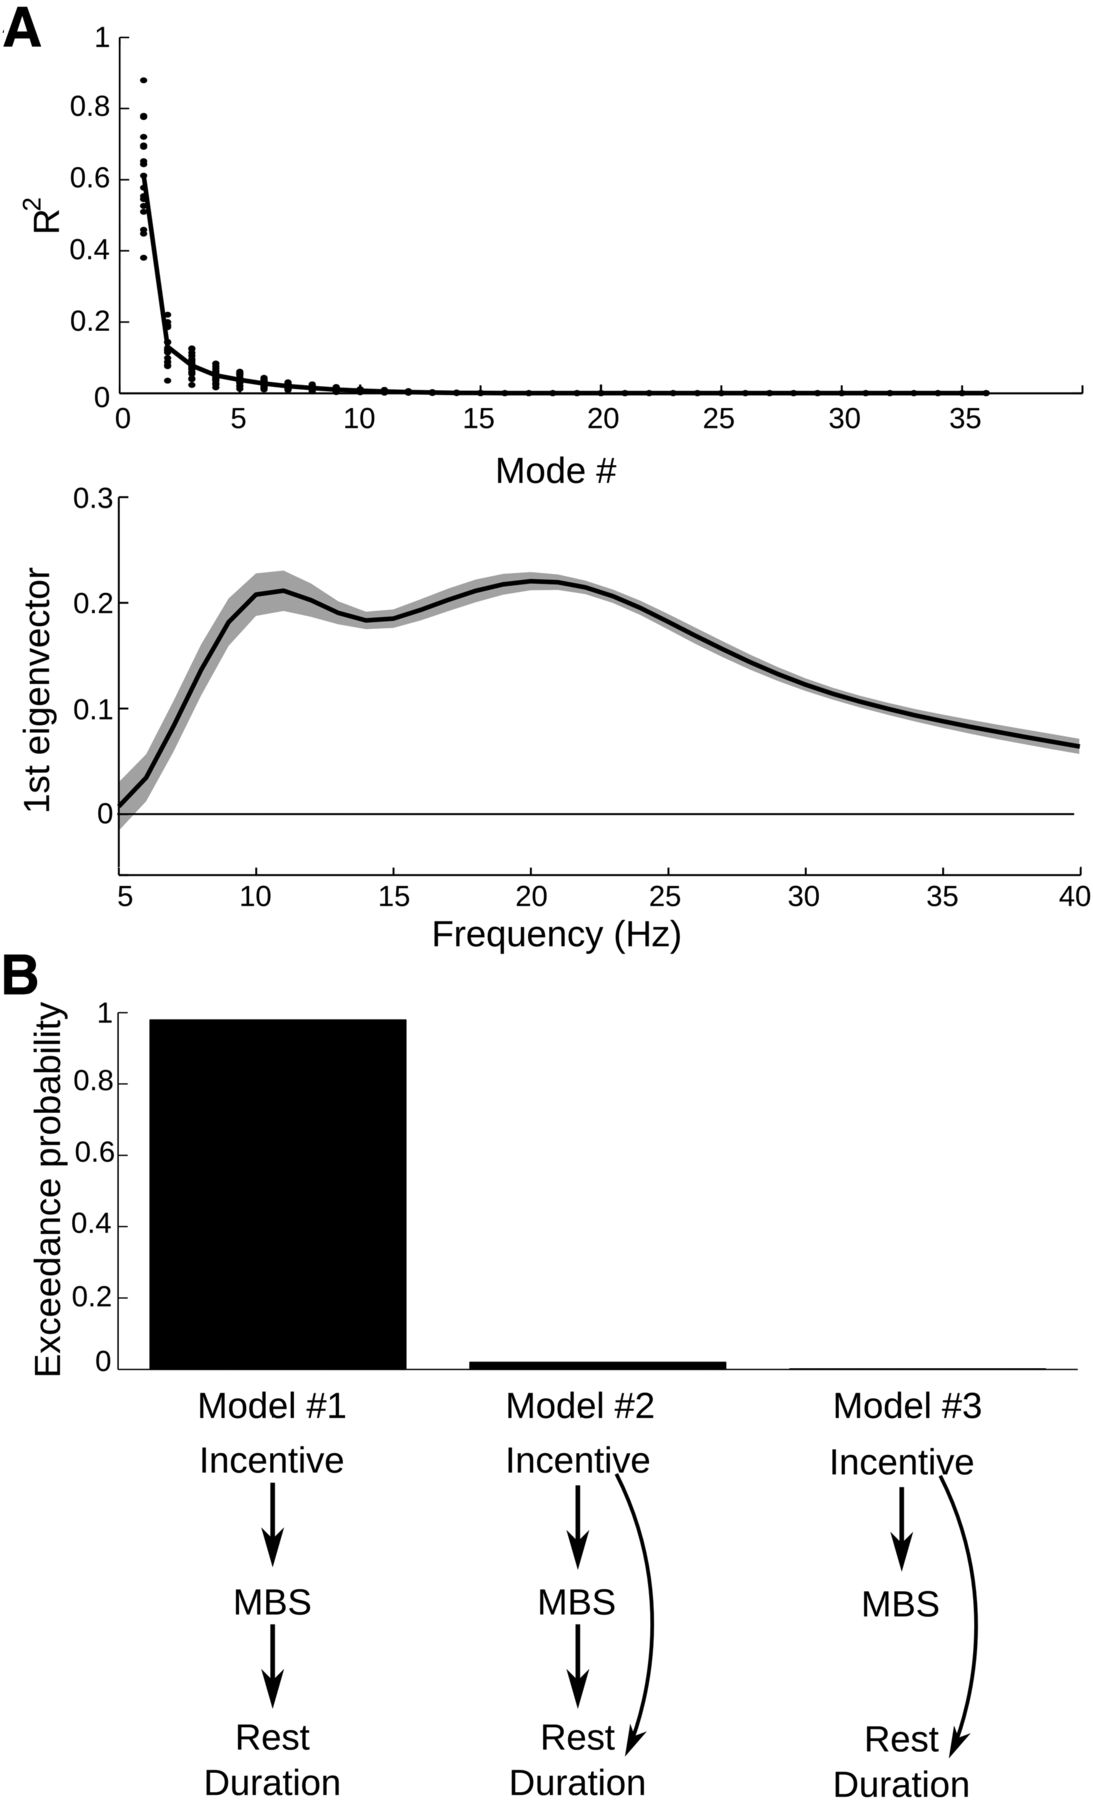
However, the causal links between incentives, MBS, and behavior remained to be specified. Our hypothesis posits that incentives influence MBS reduction, which in turn controls effort initiation (model 1). A more complicated possibility is that incentives also influence rest duration, independently from their effect on MBS (model 2). A last alternative is that incentive level is a common cause of both MBS reduction and rest duration, which would induce a spurious correlation between MBS level and rest duration (model 3). To reduce dimensionality of z power, we ran a singular value decomposition. Results showed that z power could reasonably be reduced to its first mode, which captured most of the variance (Fig. 5A). In all subjects, the first eigenvector mirrored closely the MBS pattern over frequencies at effort initiation. For display purpose (Fig. 5B), we oriented this first eigenvector such that its mean value in the beta range (13–30 Hz) was positive in each subject. Indeed, the orientations of eigenvectors over frequencies and observations (i.e., left and right singular vectors) are arbitrary and depend on each other. Thus, using the first mode of z power, we had one vector of observations for all three variables (incentive level, MBS reduction, and rest duration). Models were specified by linear dependencies between these variables (Fig. 5C, arrows). Given the data, we estimated these models and took their respective evidence to perform Bayesian model selection with a random-effect analysis at the group level (see Materials and Methods). Model 1, with an expected frequency of 0.85, obtained a high exceedance probability (xp > 0.99), which is the confidence that this model is more frequently implemented than the two other models in the general population. Thus, the model comparison provided evidence for MBS reduction mediating the effect of incentive level onto rest duration. A prediction of this mediation model is that the estimates of incentive effect onto rest duration should be reduced when MBS level is included as a second regressor in the analysis. Indeed, the regression coefficients assigned to incentive level when alone (−0.074 ± 0.022 SEM) were greater (more negative) than when accompanied by MBS level (−0.058 ± 0.020 SEM) with a significant difference (p = 0.007, bilateral paired t test).

Evidence for MBS reduction mediating incentive effects on rest duration. A, Singular value decomposition of z-power variations over epochs, in the 5–40 Hz range. Top, Dots represent R2 statistics obtained for each mode and subject; solid line is the mean over subjects. Bottom, The curve indicates the first eigenvector (intersubject mean ± SEM), for each frequency in and around the beta band. Because the direction of eigenvectors is arbitrary, we flipped them subjectwise for their mean value over the beta range to be positive, which allows direct visual comparison of the group average with the other figures. B, Results of model comparison. The graphs illustrate the three models tested to account for statistical dependencies between incentive level, beta z power, and rest duration (with arrows representing linear links). Bars indicate model exceedance probability (i.e., the probability that the model is the most frequently implemented in the population).
Discussion
In this study, participants were not instructed when to start exerting physical effort. Instead, they were motivated by monetary incentives to spend more time working. They spontaneously adjusted effort allocation to these incentives, trading off benefits against costs. In particular, they shortened breaks when work paid more. We found evidence that such an effect of incentive motivation was underpinned by a reduction of MBS relative to trial baseline. Indeed, MBS reduction was correlated across trials with both incentive level and rest duration. In addition, subjects who exhibited stronger incentive effects on rest duration also exhibited stronger incentive effects on MBS reduction. Finally, direct Bayesian model comparison suggested that the most likely interpretation of statistical dependencies between our three variables of interest is that incentive effect on rest duration was mediated by the amplitude of MBS reduction. In the following, we first discuss the modulation of rest duration by MBS reduction and then the modulation of MBS reduction by incentives.
Effort onset could be predicted by MBS reduction measured in a fixed time window at the beginning of rest periods. This observation discards the possibility that rest duration per se may bias MBS measurements. On the contrary, it suggests that MBS reduction favors the initiation of effort production. This is in line with the general idea that a high MBS level represents an “idling rhythm” maintaining the motor status quo and that decreasing MBS allows for a motor change (Engel and Fries, 2010). More precisely, the corticospinal pathway might be less excitable during high MBS states, preventing any motor program from triggering movement initiation. Interestingly, we observed that MBS reduction only affected initiation time and no other effort-related parameter, such as speed or duration. This specificity echoes numerous reports that MBS reduction observed before the action onset is not linked to any movement parameter (van Wijk et al., 2012).
Growing evidence suggests that MBS reduction indeed plays on movement initiation. In PD patients, a higher MBS level in the subthalamic nucleus was correlated across trials with longer initiation delay (Kühn et al., 2004) and with successful inhibition of the prepotent response in a Stroop task (Swann et al., 2009; Brittain et al., 2012). In healthy participants, faster finger tapping (with reduced intervals between movements) resulted in a lower MBS level (Toma et al., 2002), but prolonged movement duration (with constant intervals between movements) did not (Cassim et al., 2000), suggesting that MBS is specifically modulated by rest (not effort) duration. Interestingly, increasing response uncertainty (by augmenting the number of possible movements) also enhances both reaction time and MBS level (Tzagarakis et al., 2010). Accordingly, in a visual detection task, the progressive reduction of MBS correlated with the gradual commitment to a motor response, which was distinct from the confidence in the perceptual decision (Donner et al., 2009; O'Connell et al., 2012).
The specific link of pre-effort MBS to initiation time should be contrasted to the case of readiness potential or field (RP/RF), which also manifests as a slow ramping signal that precedes voluntary movement (Pedersen et al., 1998; Praamstra et al., 1999; Leuthold and Jentzsch, 2002; Shibasaki and Hallett, 2006). Many movement-related factors affect the RP/RF, such as the force load, the effector used, and the movement complexity (Lang, 2003). Thus, although MBS reduction may reflect motor gating in general (Engel and Fries, 2010), with a main source in the contralateral motor cortex (Jurkiewicz et al., 2006; Donner et al., 2009; Tzagarakis et al., 2010), the RP/RF seems to reflect the preparation of a specific motor program (Shibasaki and Hallett, 2006), with main sources in the supplementary motor area in addition to the primary motor cortex (Ball et al., 1999; Cunnington et al., 2005). However, such a clear-cut distinction between MBS–motor gating and RP/RF–motor preparation should be tempered: some authors argue that the RP denotes the transition from intention to action (Lang, 2003), and others have proposed recently that the RP reflects the passive stochastic accumulation of a “go” signal (Schurger et al., 2012).
Little is known about how these signals relate to reward processing, which has been overlooked by the EEG–MEG literature until recently. On the one hand, MBS reduction was characterized as a gating signal in the domain of motor control, the movement being directly instructed or related to a perceptual decision, without bearing any particular value for the subject. On the other hand, MBS was characterized in the domain of motor disorders as a pathological signal, which should be eliminated to alleviate symptoms such as hypokinesia in PD. To our knowledge, the intuitive idea that MBS could represent a normal process adjusting motor behavior to subjective goals in healthy conditions has not been directly investigated. Here we provide evidence that MBS reduction may speed up effort initiation proportional to expected rewards in healthy subjects. Other neural mechanisms have been suggested for underlying such incentive motivation process. For instance, reward representation may influence motor output through corticocortical connections, implementing a top-down regulation of behavior (Locke and Braver, 2008; Kouneiher et al., 2009). Another possibility is that the interaction between reward and motor circuits occurs within the basal ganglia, with the ventral parts boosting the dorsal parts (Knutson et al., 2008; Schmidt et al., 2012; Tachibana and Hikosaka, 2012). An alternative suggestion is that dopamine release facilitates the expression of motor programs, either at the cortical or subcortical level (Berridge, 2004; Robbins, 2007; Salamone and Correa, 2012).
These possibilities are not mutually exclusive and could be articulated with the phenomenon of MBS reduction. It is known that degeneration of dopaminergic neurons in animal models of PD, as well as in human patients, results in abnormally high beta oscillations that can be reduced by dopamine replacement medications (Schnitzler and Gross, 2005; Uhlhaas and Singer, 2006; Hammond et al., 2007). This is possibly because dopamine release in the striatum helps filter cortical input and desynchronize basal ganglia output signals (McIntyre and Hahn, 2010). Thus, one could speculate that reward prospects represented in limbic circuits may amplify dopamine release, which in turn may facilitate movement initiation by lowering beta oscillations in the motor circuits. This view would invite reconsidering the status of bradykinesia or akinesia as motor symptoms. They would instead represent dysfunction of motivational processes that occur between pure reward and motor representations. Several computational accounts of dopamine depletion support this interpretation, because they attributed slowness to a shift in the movement cost/benefit ratio rather than to suboptimal control of the movement spatiotemporal trajectory (Mazzoni et al., 2007; Niv et al., 2007; Baraduc et al., 2013). However, the link between dopamine release and MBS reduction in healthy conditions remains to be established. We also note that abnormal oscillations in PD are not restricted to the beta band: excessive power was found at lower frequency (in the alpha band) and deficient power at high-frequency oscillations (in the gamma band), both anomalies being correlated to apathy scores (Özkurt et al., 2011; Airaksinen et al., 2012). This is in line with the idea that beta and gamma motor oscillations have anti-kinetic and pro-kinetic properties, respectively (Brown et al., 2001; Schoffelen et al., 2005).
How the brain machinery for incentive motivation interacts with brain systems signaling effort costs remains poorly understood. In a previous study (Meyniel et al., 2013), we investigated a cost signal conveyed by proprioceptive regions (posterior insula) during the same task. In principle, this signal, which accumulated during effort and dissipated at rest, could be sufficient for making “stop” and “go” decisions. In particular, the decision to resume effort exertion was triggered when the insular cost signal reached down to a fixed lower bound. It is possible that insular dissipation is causally linked to MBS reduction or that they simultaneously favor effort initiation. Interestingly, the dissipation rate in the posterior insula increased with incentive level, as if a tonic reward signal was negatively integrated into the cost signal. An open question is whether insular dissipation and MBS reduction feed one another or integrate the same tonic incentive-related signal, possibly coming from a common input.
Thus, we conclude that MBS reduction may represent a neural process translating expected reward into motor activation. However, there are some limitations that should be acknowledged. First, our conclusion is based on statistical dependencies between variables, which suggests, but does not prove, a causal pathway from incentive level to MBS reduction to effort initiation. Direct manipulation of MBS level, through dopaminergic medication or electrical stimulation, could provide more conclusive evidence for causality by affecting subjects' sensitivity to incentives and perhaps patients' apathetic symptoms. Second, the frequencies that were correlated to incentive level and rest duration were slightly different, even if they could all be labeled as “beta.” It remains to be understood whether these differences in frequency are functionally significant for the incentive motivation process.
Footnotes
The study was funded by a Starting Grant from the European Research Council (ERC-BioMotiv) and by the program investissements d'avenir (ANR-10-IAIHU-06). F.M. benefited from a doctoral fellowship by the French Ministère de l'Eduction Nationale. We thank Catherine Tallon-Baudry for her valuable discussions on the analysis, the Centre de NeuroImagerie de Recherche magnetoencenphalography team and Raphael Lebouc for help during recordings, and Véronique Marchand-Pauvert for her technical support with electromyography recordings.
The authors declare no competing financial interests.
- Correspondence should be addressed to Mathias Pessiglione, Bâtiment Institut du Cerveau et de la Moelle Épinière, Hôpital de la Pitié-Salpêtrière, 47 Boulevard de l'Hôpital, F-75013 Paris, France. mathias.pessiglione{at}gmail.com


